| Param | Original file | Final file |
|---|---|---|
| Filename | modeM0/AS1A12_022T01_9000005498_39861cztM0_level2.fits | modeM0/AS1A12_022T01_9000005498_39861cztM0_level2_quad_clean.evt |
| Size (bytes) | 821,724,480 | 214,182,720 |
| Size | 783.7 MB | 204.3 MB |
| Events in quadrant A | 6,638,765 | 1,442,656 |
| Events in quadrant B | 6,467,812 | 1,468,288 |
| Events in quadrant C | 9,000,307 | 1,374,490 |
| Events in quadrant D | 7,274,428 | 1,274,795 |
| Mode M0 | |||
|---|---|---|---|
| Quadrant | BADHDUFLAG | Total packets | Discarded packets |
| A | 0 | 28445 | 4 |
| B | 0 | 28891 | 3 |
| C | 0 | 35780 | 3 |
| D | 0 | 31865 | 3 |
| Mode M9 | |||
|---|---|---|---|
| Quadrant | BADHDUFLAG | Total packets | Discarded packets |
| A | 0 | 43 | 0 |
| B | 0 | 43 | 0 |
| C | 0 | 43 | 0 |
| D | 0 | 43 | 0 |
| Mode SS | |||
|---|---|---|---|
| Quadrant | BADHDUFLAG | Total packets | Discarded packets |
| A | 0 | 276 | 0 |
| B | 0 | 276 | 0 |
| C | 0 | 276 | 0 |
| D | 0 | 276 | 0 |
| Quadrant | Total seconds | Saturated seconds | Saturation percentage |
|---|---|---|---|
| A | 13370 | 33 | 0.246821% |
| B | 13370 | 93 | 0.695587% |
| C | 13370 | 487 | 3.642483% |
| D | 13370 | 349 | 2.610322% |
Noise dominated data is calculated using 1-second bins in cleaned event files. If a bin has >2000 counts, and if more than 50% of those come from <1% of pixels, then it is considered to be noise-dominated and hence unusable.
| Quadrant | # 1 sec bins | Bins with >0 counts | Bins with >2000 counts | High rate bins dominated by noise | Noise dominated (total time) | Noise dominated (detector-on time) | Marked lightcurve |
|---|---|---|---|---|---|---|---|
| A | 17727 | 13372 | 17 | 17 | 0.10% | 0.13% | 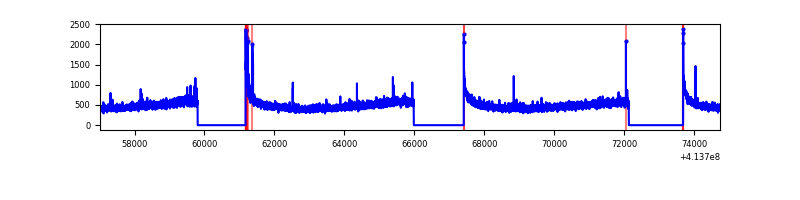 |
| B | 17727 | 13372 | 58 | 58 | 0.33% | 0.43% | 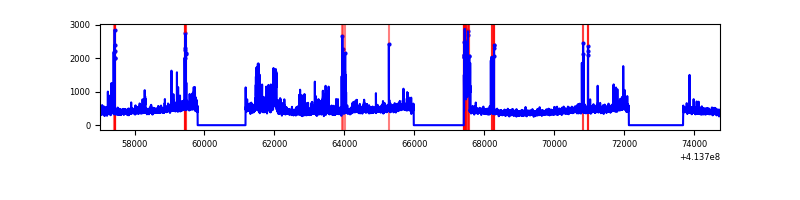 |
| C | 17727 | 13372 | 423 | 423 | 2.39% | 3.16% | 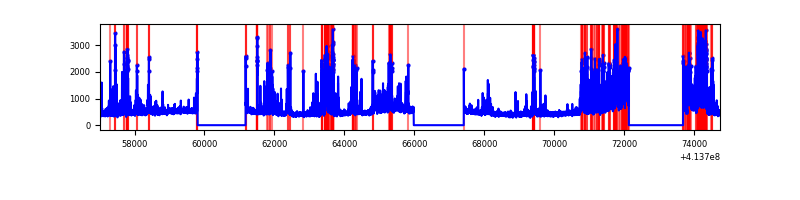 |
| D | 17727 | 13372 | 242 | 242 | 1.37% | 1.81% | 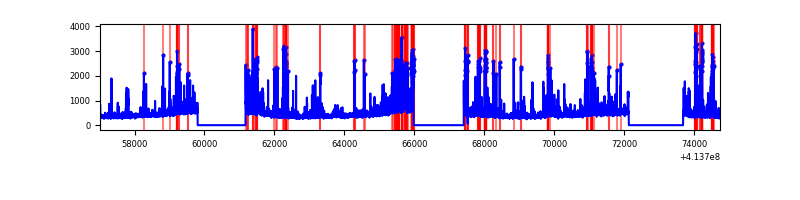 |
Top three noisy pixels from each quadrant. If the there are fewer than three noisy pixels in the level2.evt file, extra rows are filled as -1
| Pixel properties | Quadrant properties | ||||||
|---|---|---|---|---|---|---|---|
| Quadrant | DetID | PixID | Counts | Sigma | Mean | Median | Sigma |
| A | 10 | 83 | 970035 | 3329.3 | 1440 | 1412 | 290.9 |
| A | 13 | 248 | 53601 | 179.38 | 1440 | 1412 | 290.9 |
| A | 13 | 254 | 23631 | 76.37 | 1440 | 1412 | 290.9 |
| B | 4 | 170 | 409699 | 1502.12 | 1423 | 1384 | 271.8 |
| B | 0 | 230 | 121024 | 440.13 | 1423 | 1384 | 271.8 |
| B | 4 | 171 | 116456 | 423.33 | 1423 | 1384 | 271.8 |
| C | 9 | 187 | 2962408 | 9257.91 | 1373 | 1376 | 319.8 |
| C | 15 | 214 | 544148 | 1697.02 | 1373 | 1376 | 319.8 |
| C | 1 | 16 | 94550 | 291.32 | 1373 | 1376 | 319.8 |
| D | 13 | 249 | 652346 | 1929.59 | 1379 | 1337 | 337.4 |
| D | 2 | 249 | 637518 | 1885.64 | 1379 | 1337 | 337.4 |
| D | 2 | 250 | 273481 | 806.63 | 1379 | 1337 | 337.4 |
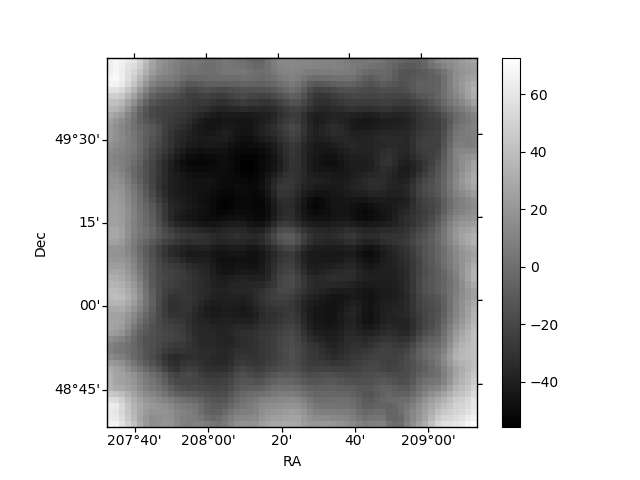
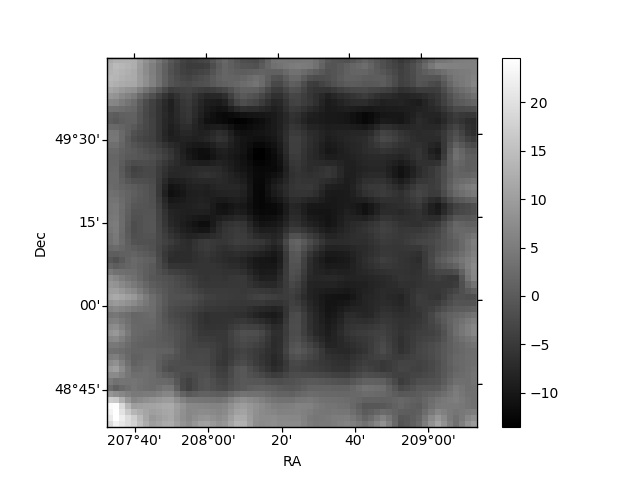
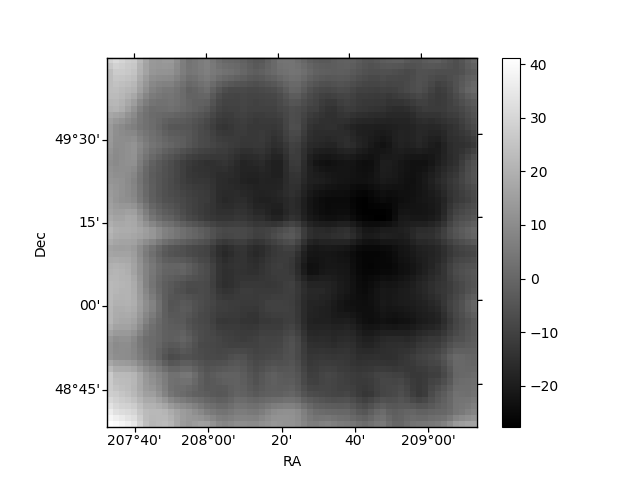
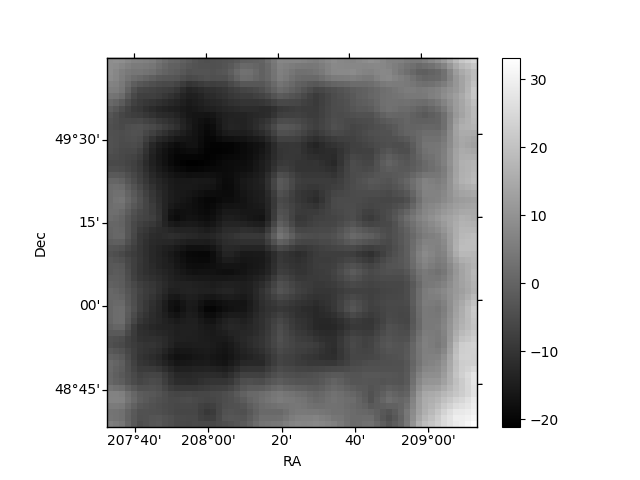
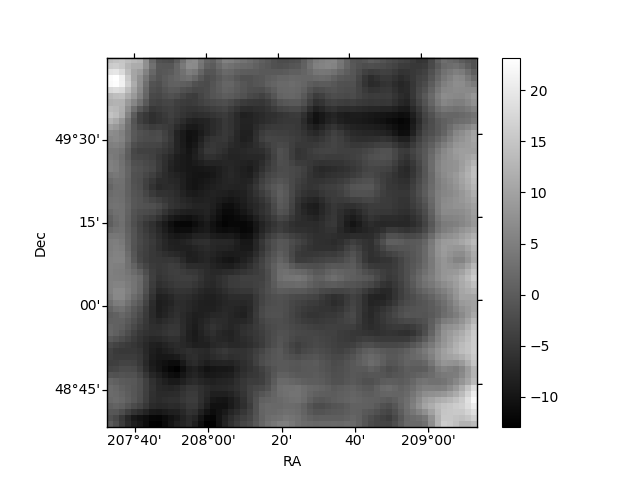
Histogram calculated using DETX and DETY for each event in the final _common_clean file
| Quadrant A | 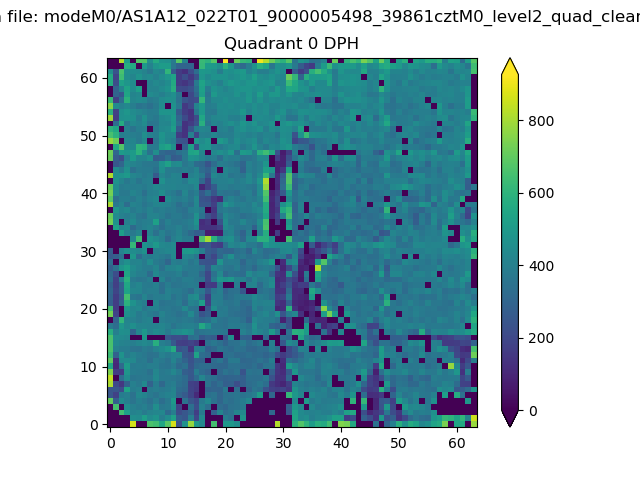 |
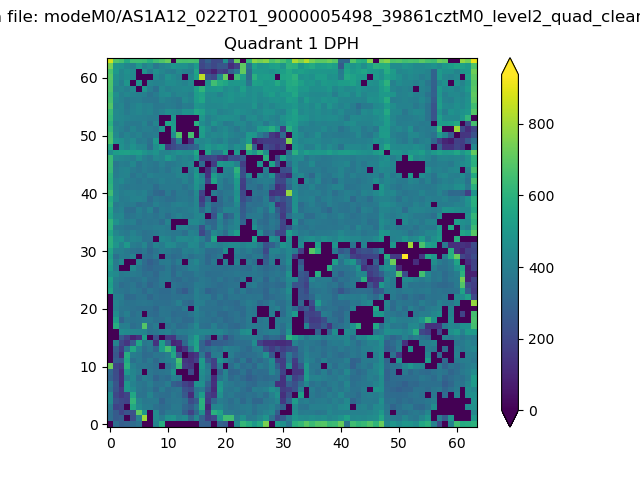 |
Quadrant B |
|---|---|---|---|
| Quadrant D | 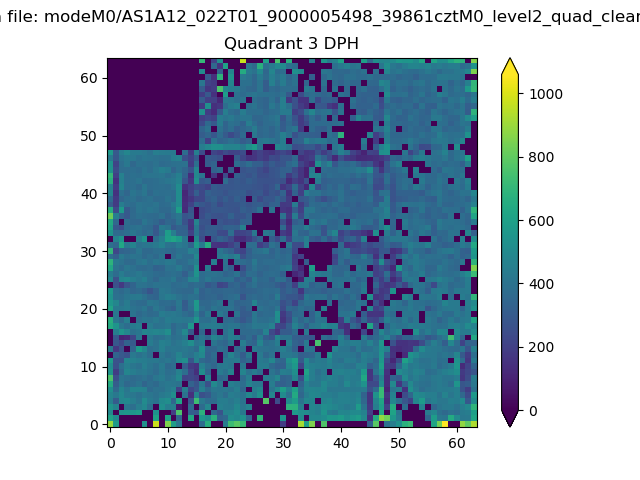 |
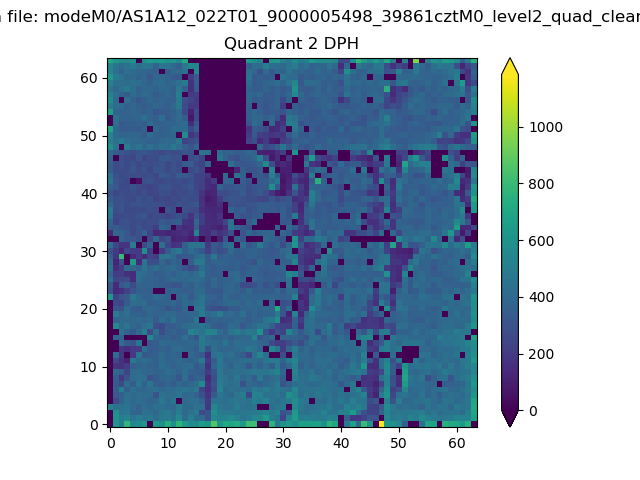 |
Quadrant C |
| Plot type | Count rate plots | Images |
|---|---|---|
| Comparison with Poisson distribution Blue bars denote a histogram of data divided into 1 sec bins. Red curve is a Poisson curve with rate = median count rate of data. |
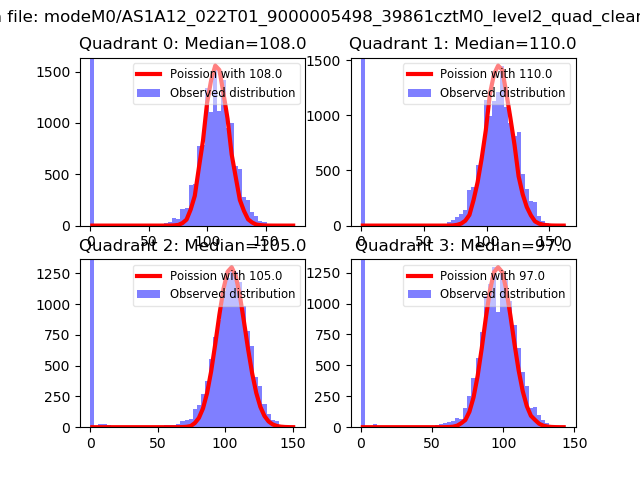 |
 |
| Quadrant-wise count rates Data is divided into 100 sec bins |
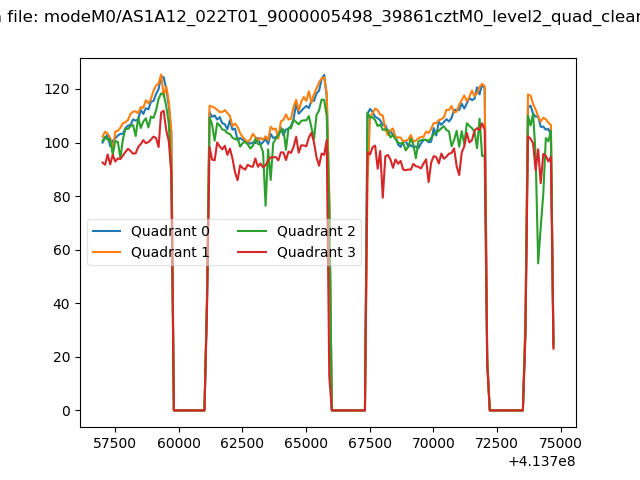 |
|
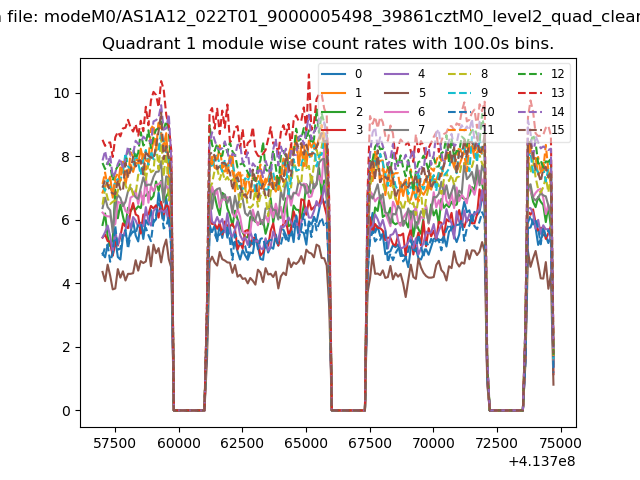
| Module-wise count rates for Quadrant A Data is divided into 100 sec bins |
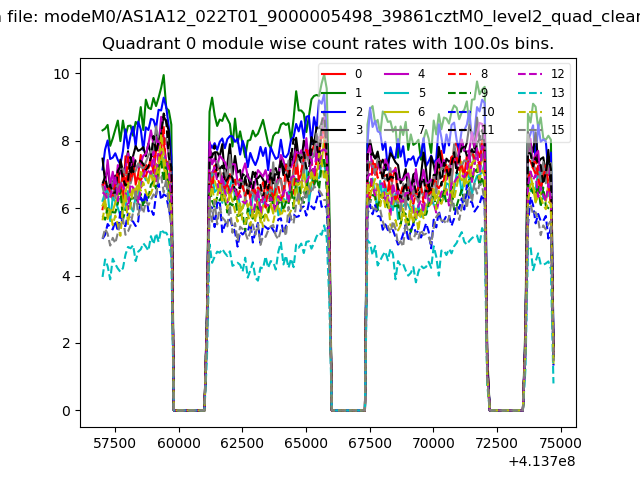 |
 |
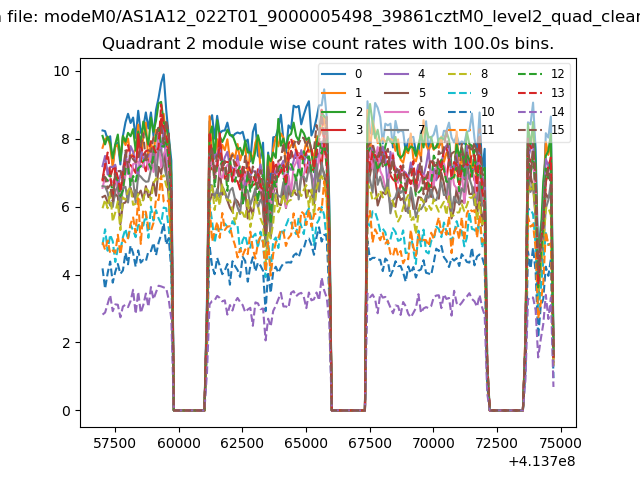
| Module-wise count rates for Quadrant B Data is divided into 100 sec bins |
 |
 |
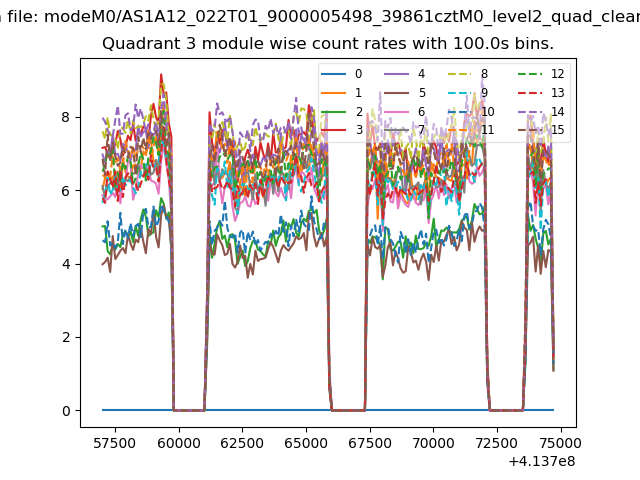
| Module-wise count rates for Quadrant C Data is divided into 100 sec bins |
 |
 |
| Module-wise count rates for Quadrant D Data is divided into 100 sec bins |
 |
 |
| Parameter | Plot |
|---|---|
| CZT HV Monitor | 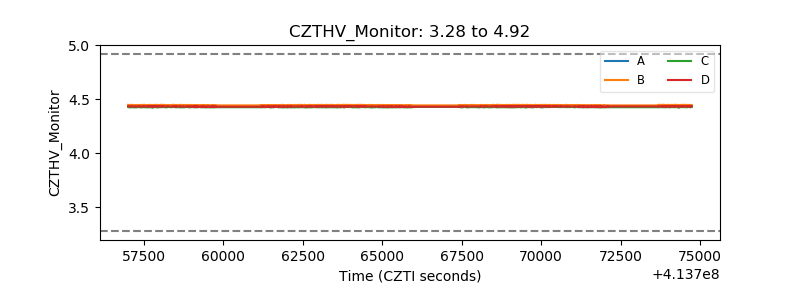 |
| D_VDD | 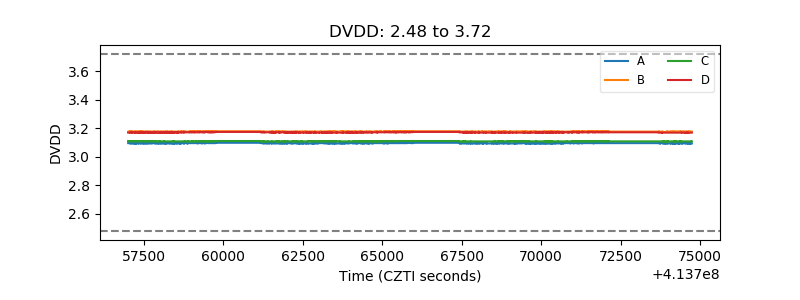 |
| Temperature 1 | 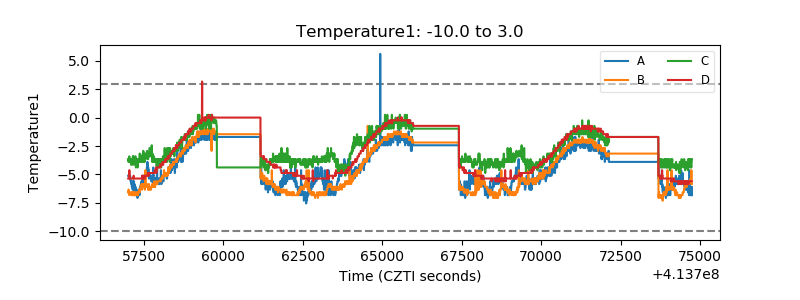 |
| Veto HV Monitor |  |
| Veto LLD | 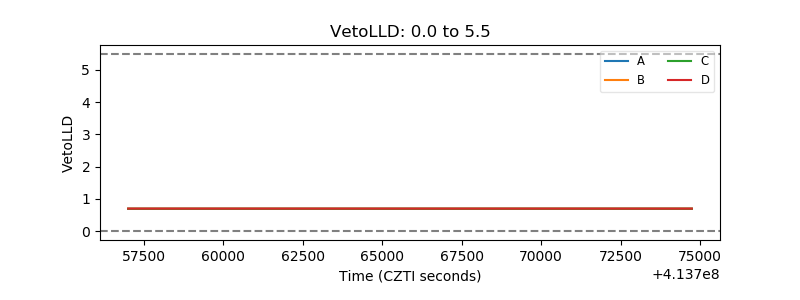 |
| Alpha Counter | 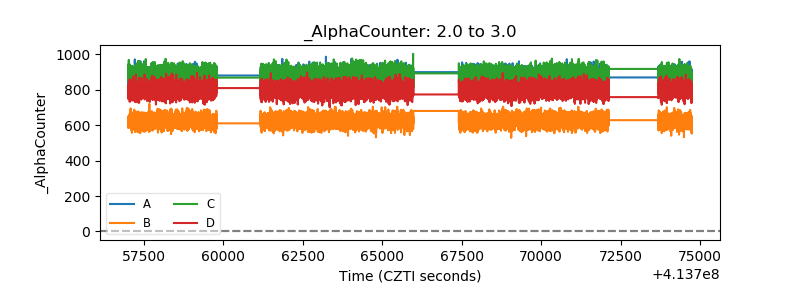 |
| _CPM_Rate | 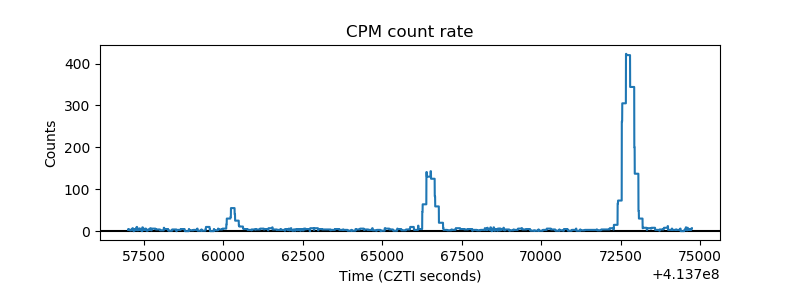 |
| CZT Counter | 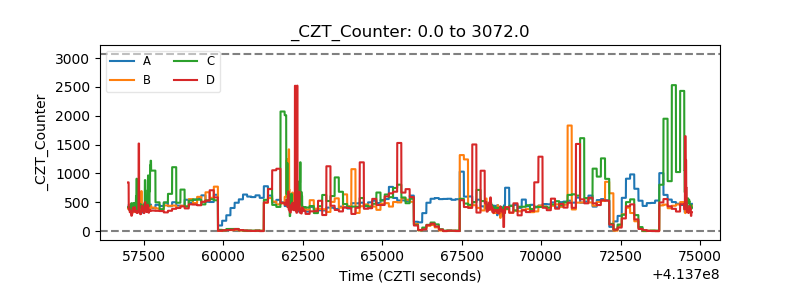 |
| +2.5 Volts monitor |  |
| +5 Volts monitor | 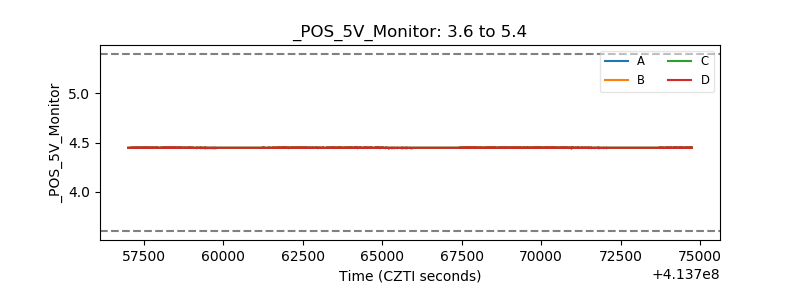 |
| _ROLL_ROT | 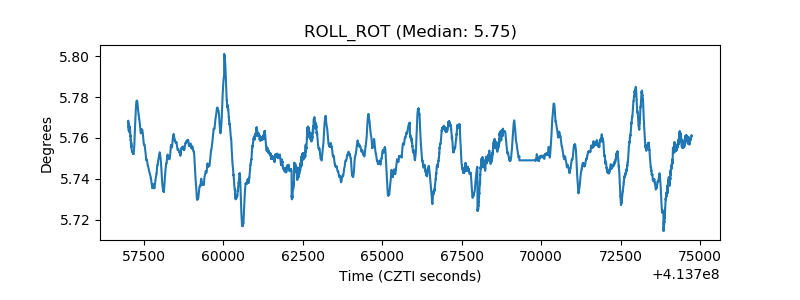 |
| _Roll_DEC | 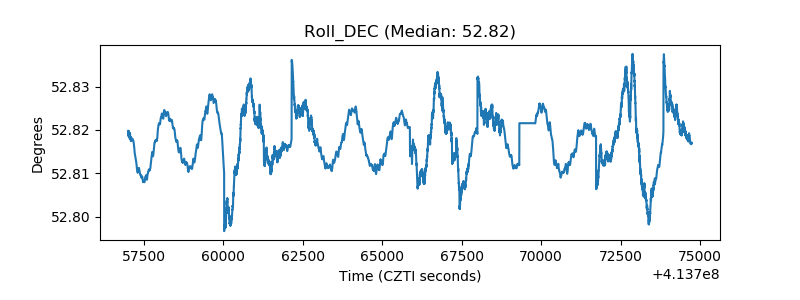 |
| _Roll_RA | 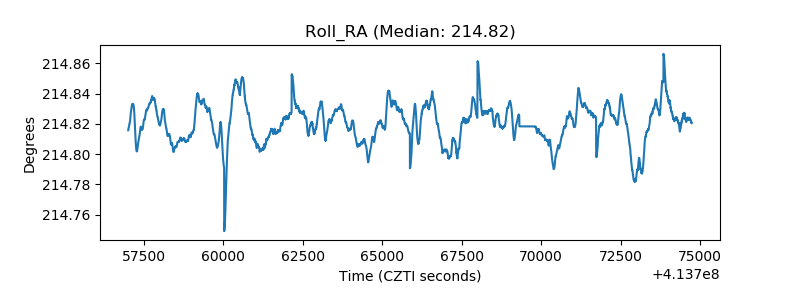 |
| Veto Counter | 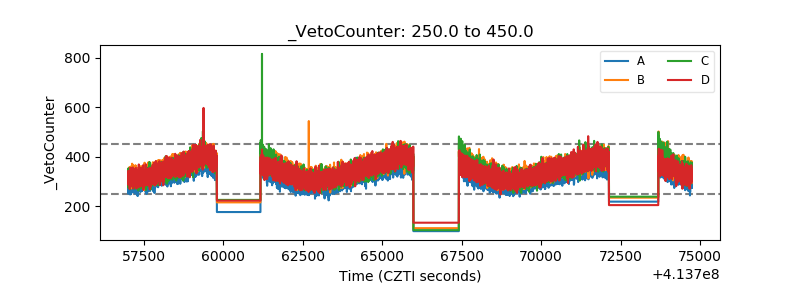 |