| Param | Original file | Final file |
|---|---|---|
| Filename | modeM0/AS1A12_022T01_9000005498_39867cztM0_level2.fits | modeM0/AS1A12_022T01_9000005498_39867cztM0_level2_quad_clean.evt |
| Size (bytes) | 170,285,760 | 44,357,760 |
| Size | 162.4 MB | 42.3 MB |
| Events in quadrant A | 1,285,991 | 296,207 |
| Events in quadrant B | 1,112,683 | 304,581 |
| Events in quadrant C | 2,370,337 | 275,520 |
| Events in quadrant D | 1,313,974 | 266,627 |
| Mode M0 | |||
|---|---|---|---|
| Quadrant | BADHDUFLAG | Total packets | Discarded packets |
| A | 0 | 5794 | 0 |
| B | 0 | 5621 | 0 |
| C | 0 | 8973 | 0 |
| D | 0 | 6259 | 0 |
| Mode SS | |||
|---|---|---|---|
| Quadrant | BADHDUFLAG | Total packets | Discarded packets |
| A | 0 | 56 | 0 |
| B | 0 | 56 | 0 |
| C | 0 | 56 | 0 |
| D | 0 | 56 | 0 |
| Quadrant | Total seconds | Saturated seconds | Saturation percentage |
|---|---|---|---|
| A | 2803 | 1 | 0.035676% |
| B | 2803 | 2 | 0.071352% |
| C | 2803 | 205 | 7.313593% |
| D | 2803 | 48 | 1.712451% |
Noise dominated data is calculated using 1-second bins in cleaned event files. If a bin has >2000 counts, and if more than 50% of those come from <1% of pixels, then it is considered to be noise-dominated and hence unusable.
| Quadrant | # 1 sec bins | Bins with >0 counts | Bins with >2000 counts | High rate bins dominated by noise | Noise dominated (total time) | Noise dominated (detector-on time) | Marked lightcurve |
|---|---|---|---|---|---|---|---|
| A | 2803 | 2803 | 0 | 0 | 0.00% | 0.00% | 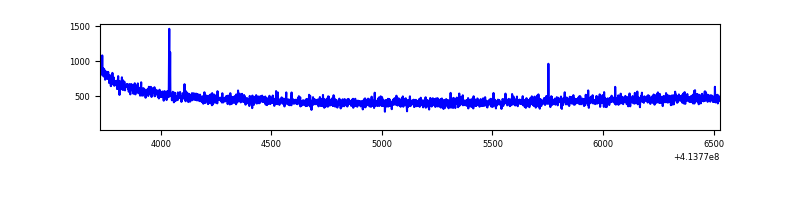 |
| B | 2803 | 2803 | 0 | 0 | 0.00% | 0.00% | 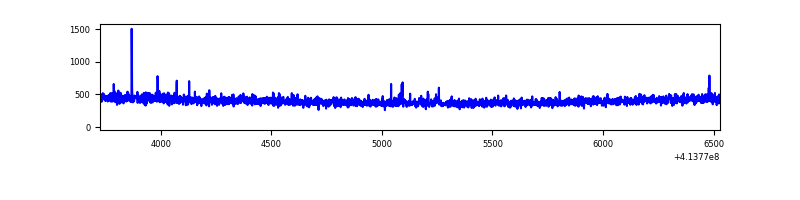 |
| C | 2803 | 2803 | 218 | 218 | 7.78% | 7.78% | 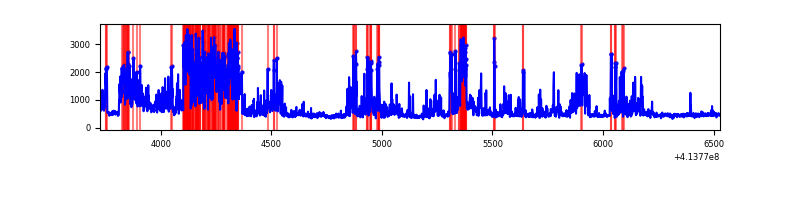 |
| D | 2803 | 2803 | 43 | 43 | 1.53% | 1.53% | 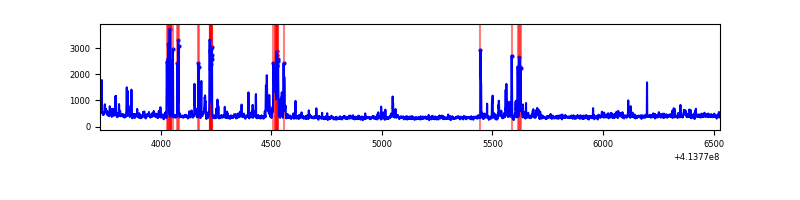 |
Top three noisy pixels from each quadrant. If the there are fewer than three noisy pixels in the level2.evt file, extra rows are filled as -1
| Pixel properties | Quadrant properties | ||||||
|---|---|---|---|---|---|---|---|
| Quadrant | DetID | PixID | Counts | Sigma | Mean | Median | Sigma |
| A | 10 | 83 | 201349 | 3462.97 | 278 | 272 | 58.1 |
| A | 13 | 254 | 5794 | 95.1 | 278 | 272 | 58.1 |
| A | 7 | 3 | 4167 | 67.08 | 278 | 272 | 58.1 |
| B | 5 | 255 | 11236 | 199.51 | 278 | 271 | 55.0 |
| B | 12 | 111 | 6881 | 120.27 | 278 | 271 | 55.0 |
| B | 11 | 111 | 6236 | 108.53 | 278 | 271 | 55.0 |
| C | 9 | 187 | 1200205 | 19249.12 | 261 | 262 | 62.3 |
| C | 15 | 214 | 114162 | 1827.15 | 261 | 262 | 62.3 |
| C | 1 | 16 | 34136 | 543.4 | 261 | 262 | 62.3 |
| D | 2 | 249 | 164184 | 2458.39 | 266 | 258 | 66.7 |
| D | 13 | 249 | 117883 | 1764.01 | 266 | 258 | 66.7 |
| D | 2 | 250 | 14548 | 214.31 | 266 | 258 | 66.7 |
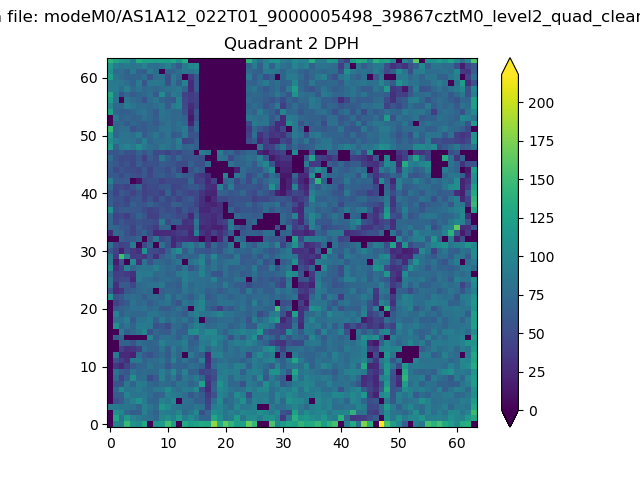
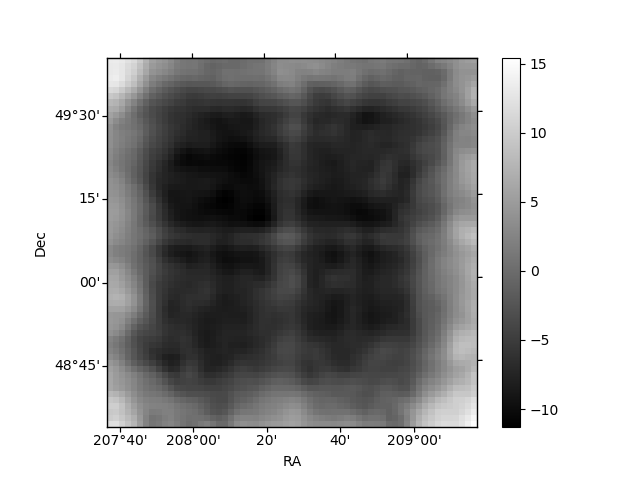
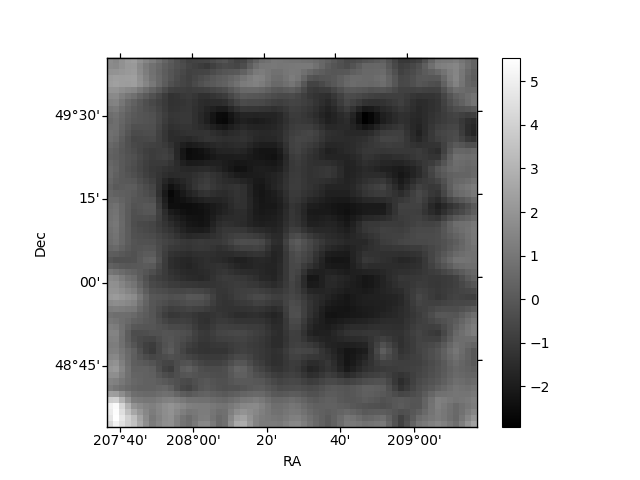
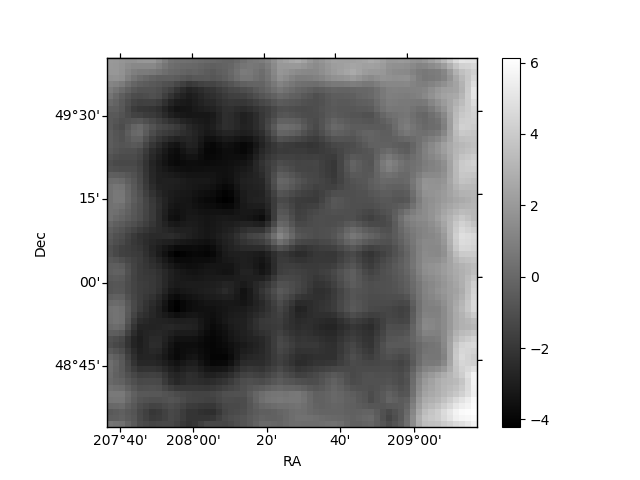
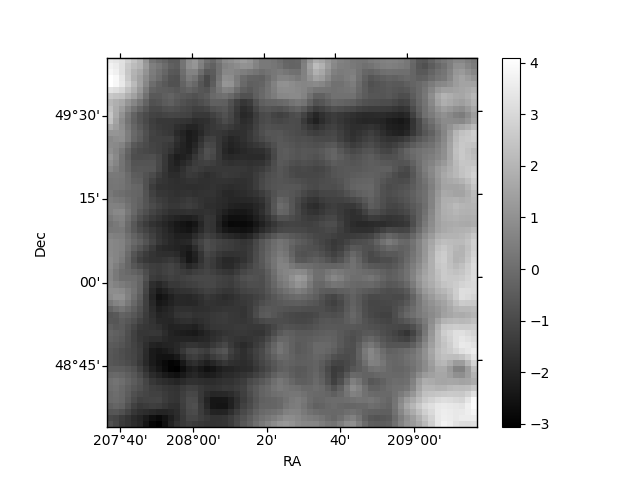
Histogram calculated using DETX and DETY for each event in the final _common_clean file
| Quadrant A | 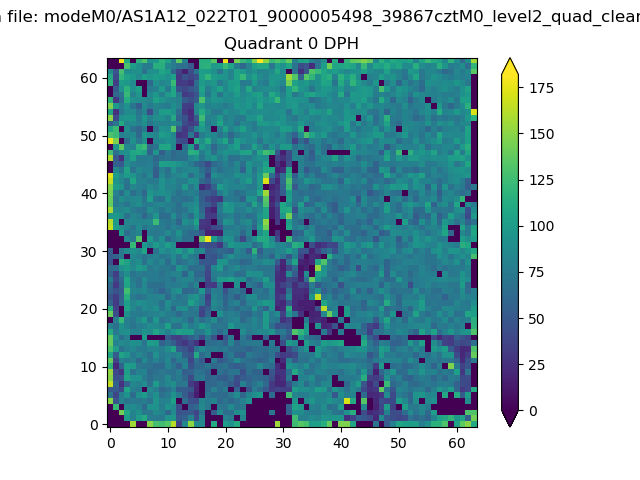 |
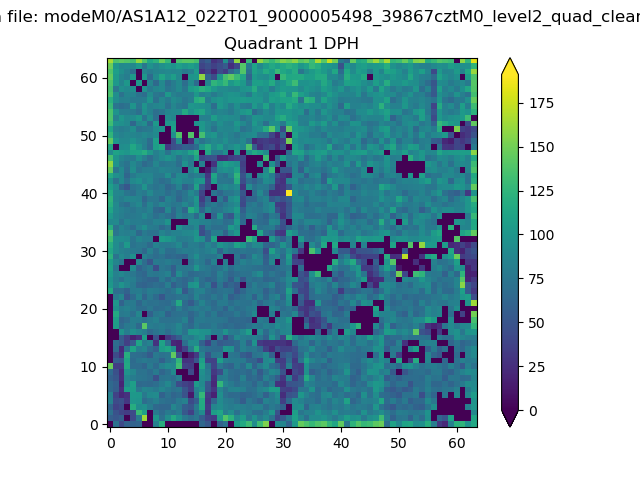 |
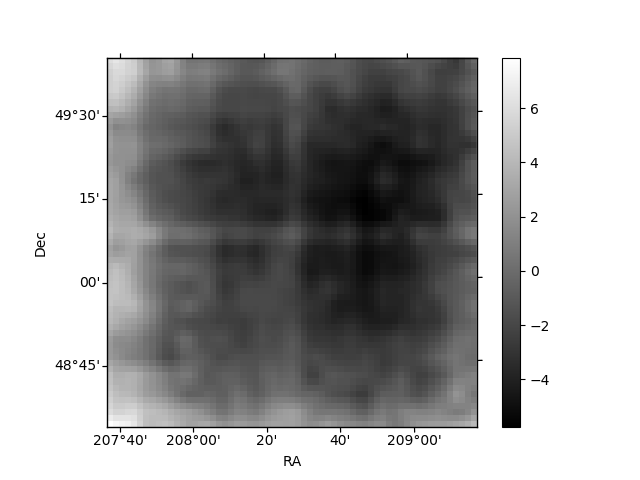
Quadrant B |
|---|---|---|---|
| Quadrant D | 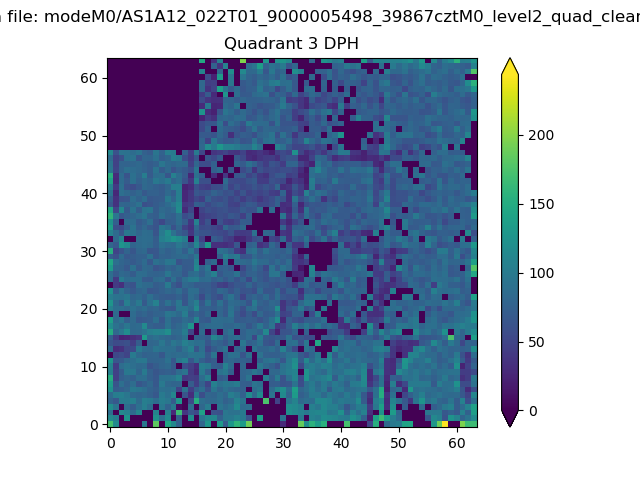 |
 |
Quadrant C |
| Plot type | Count rate plots | Images |
|---|---|---|
| Comparison with Poisson distribution Blue bars denote a histogram of data divided into 1 sec bins. Red curve is a Poisson curve with rate = median count rate of data. |
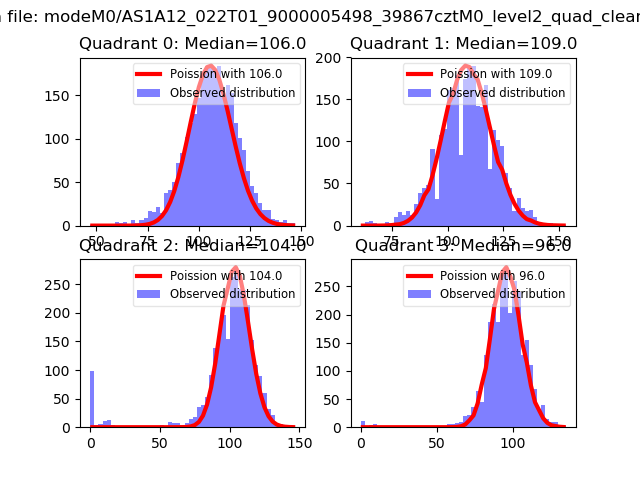 |
 |
| Quadrant-wise count rates Data is divided into 100 sec bins |
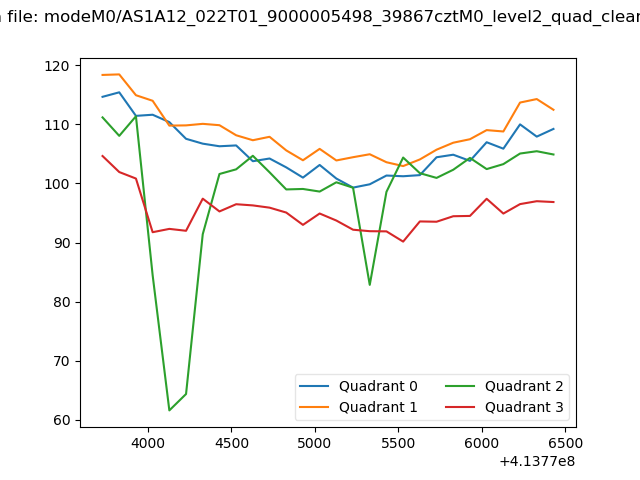 |
|
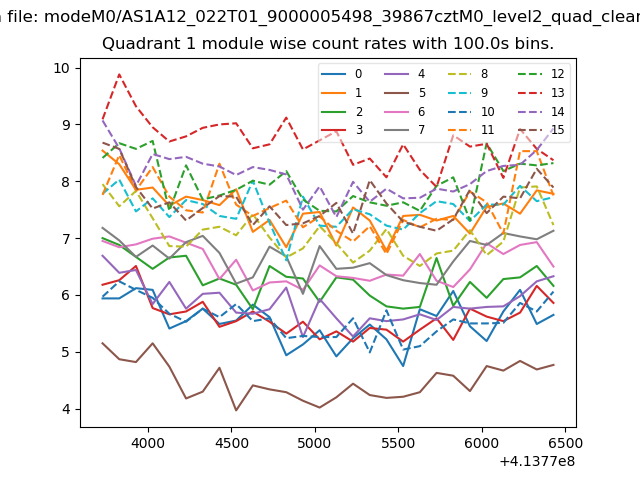
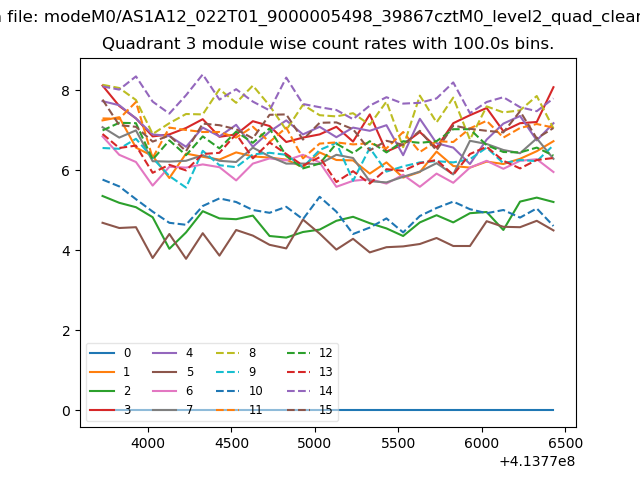
| Module-wise count rates for Quadrant A Data is divided into 100 sec bins |
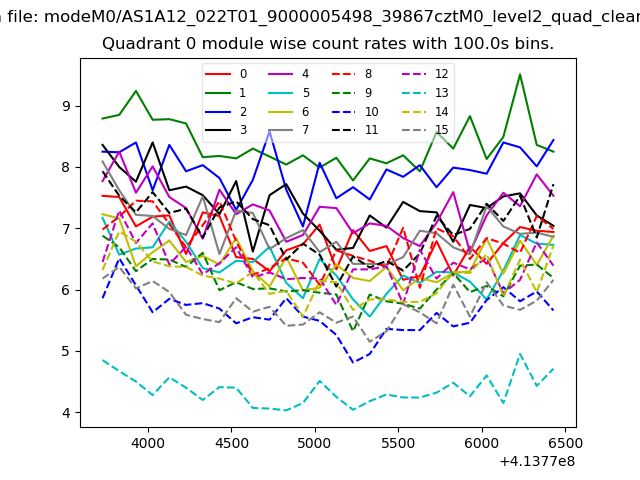 |
 |
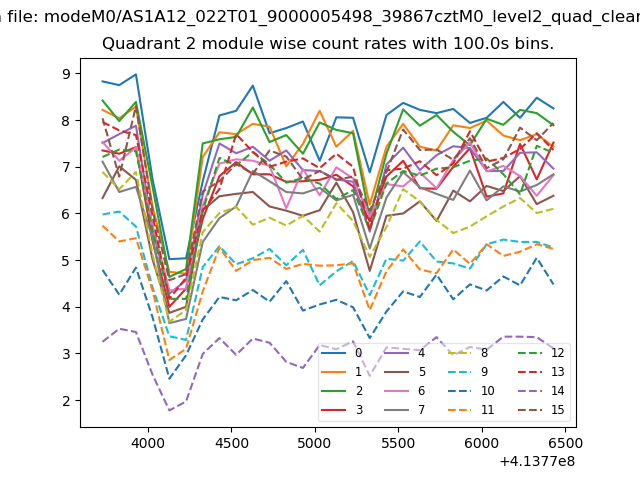
| Module-wise count rates for Quadrant B Data is divided into 100 sec bins |
 |
 |
| Module-wise count rates for Quadrant C Data is divided into 100 sec bins |
 |
 |
| Module-wise count rates for Quadrant D Data is divided into 100 sec bins |
 |
 |
| Parameter | Plot |
|---|---|
| CZT HV Monitor | 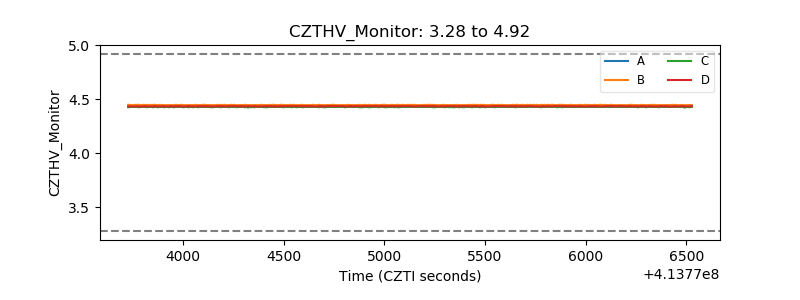 |
| D_VDD | 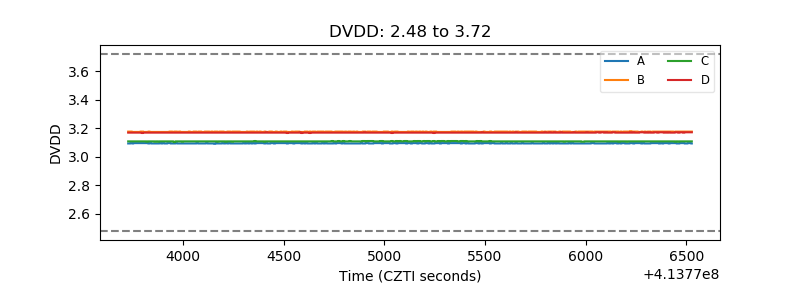 |
| Temperature 1 | 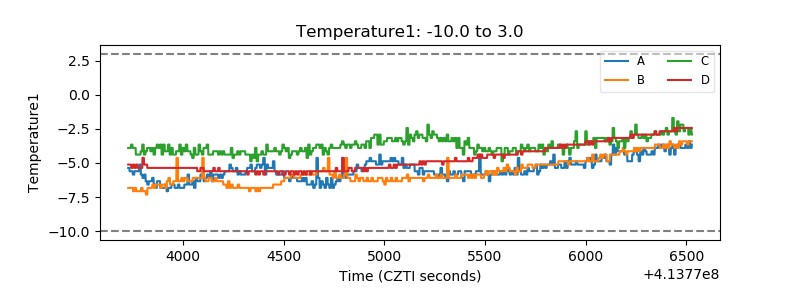 |
| Veto HV Monitor | 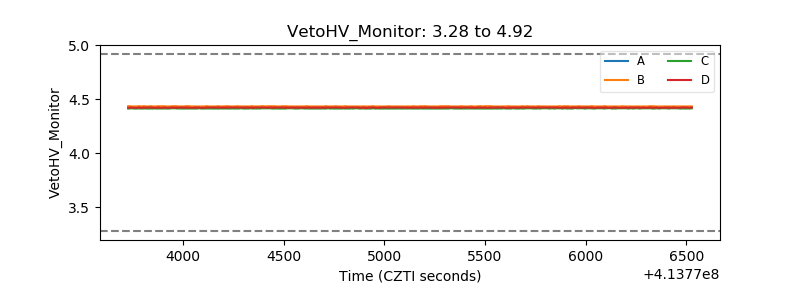 |
| Veto LLD | 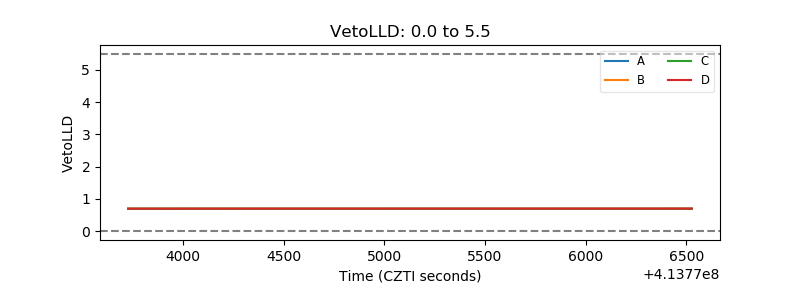 |
| Alpha Counter | 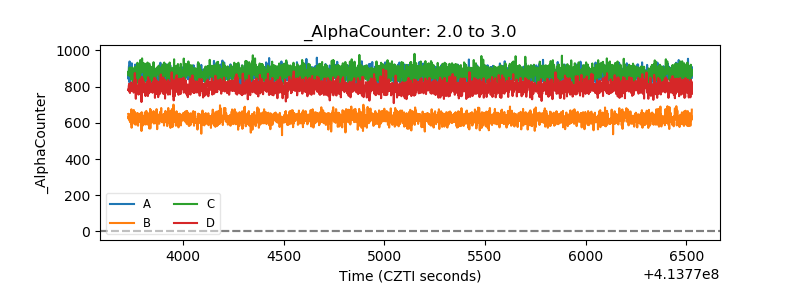 |
| _CPM_Rate | 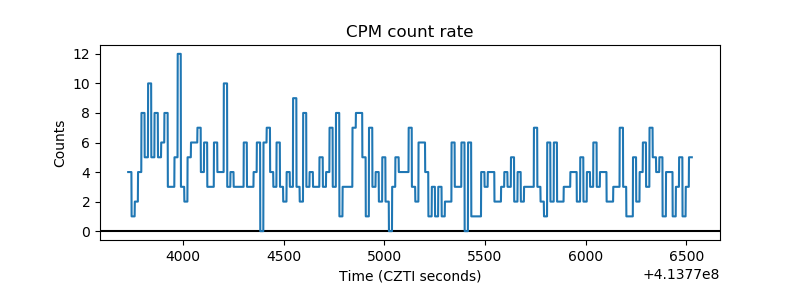 |
| CZT Counter | 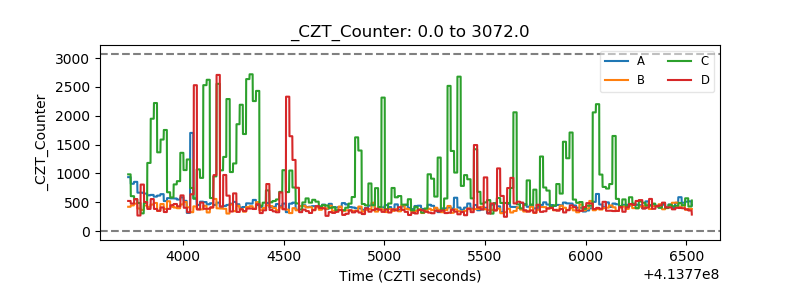 |
| +2.5 Volts monitor |  |
| +5 Volts monitor | 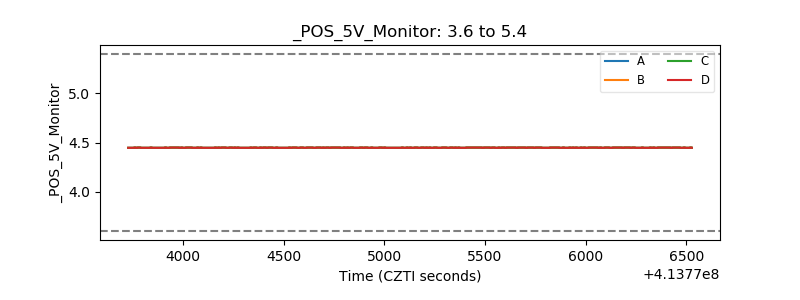 |
| _ROLL_ROT | 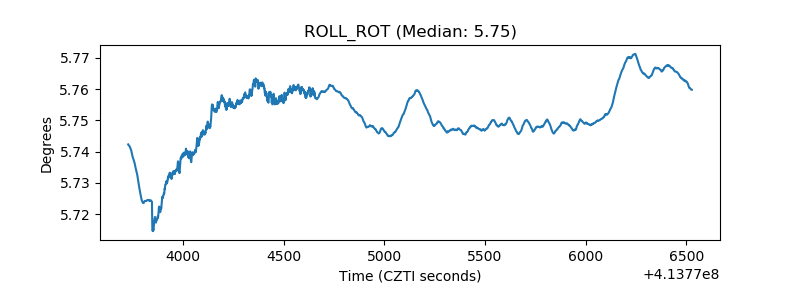 |
| _Roll_DEC | 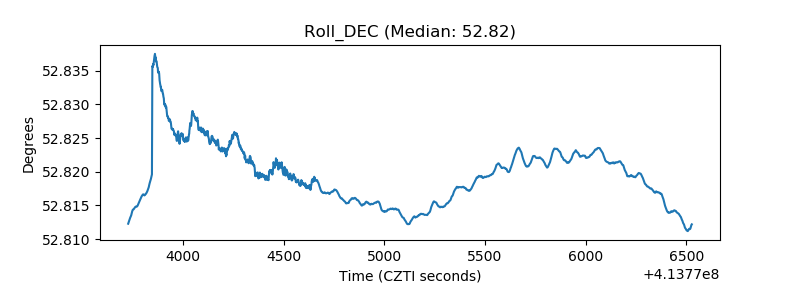 |
| _Roll_RA | 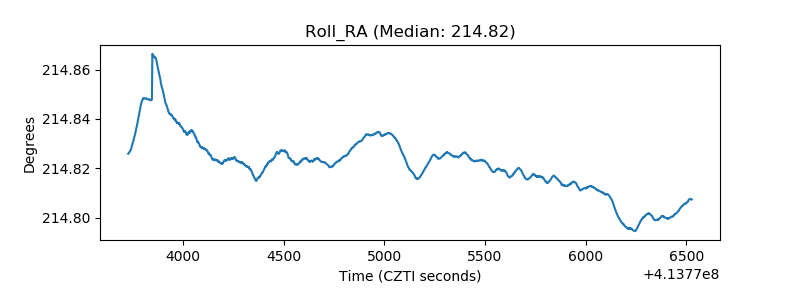 |
| Veto Counter | 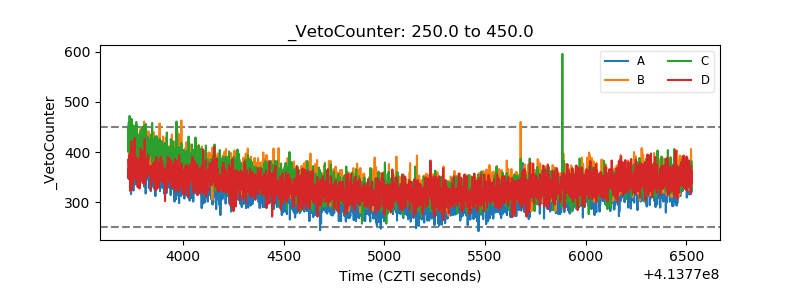 |