| Param | Original file | Final file |
|---|---|---|
| Filename | modeM0/AS1A12_032T02_9000005500_39865cztM0_level2.fits | modeM0/AS1A12_032T02_9000005500_39865cztM0_level2_quad_clean.evt |
| Size (bytes) | 328,363,200 | 82,454,400 |
| Size | 313.2 MB | 78.6 MB |
| Events in quadrant A | 2,682,441 | 559,136 |
| Events in quadrant B | 2,670,133 | 578,151 |
| Events in quadrant C | 3,245,425 | 540,494 |
| Events in quadrant D | 3,190,512 | 488,795 |
| Mode M9 | |||
|---|---|---|---|
| Quadrant | BADHDUFLAG | Total packets | Discarded packets |
| A | 0 | 19 | 0 |
| B | 0 | 19 | 0 |
| C | 0 | 19 | 0 |
| D | 0 | 19 | 0 |
| Mode SS | |||
|---|---|---|---|
| Quadrant | BADHDUFLAG | Total packets | Discarded packets |
| A | 0 | 96 | 0 |
| B | 0 | 96 | 0 |
| C | 0 | 96 | 0 |
| D | 0 | 96 | 0 |
| Mode M0 | |||
|---|---|---|---|
| Quadrant | BADHDUFLAG | Total packets | Discarded packets |
| A | 0 | 10790 | 2 |
| B | 0 | 11075 | 1 |
| C | 0 | 12528 | 1 |
| D | 0 | 12735 | 1 |
| Quadrant | Total seconds | Saturated seconds | Saturation percentage |
|---|---|---|---|
| A | 4703 | 50 | 1.063151% |
| B | 4703 | 64 | 1.360834% |
| C | 4703 | 214 | 4.550287% |
| D | 4703 | 291 | 6.187540% |
Noise dominated data is calculated using 1-second bins in cleaned event files. If a bin has >2000 counts, and if more than 50% of those come from <1% of pixels, then it is considered to be noise-dominated and hence unusable.
| Quadrant | # 1 sec bins | Bins with >0 counts | Bins with >2000 counts | High rate bins dominated by noise | Noise dominated (total time) | Noise dominated (detector-on time) | Marked lightcurve |
|---|---|---|---|---|---|---|---|
| A | 6646 | 4704 | 32 | 32 | 0.48% | 0.68% | 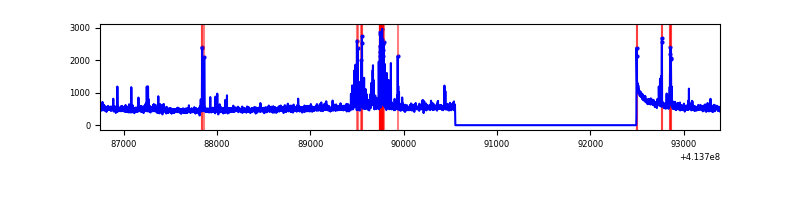 |
| B | 6646 | 4704 | 12 | 12 | 0.18% | 0.26% |  |
| C | 6646 | 4704 | 224 | 224 | 3.37% | 4.76% | 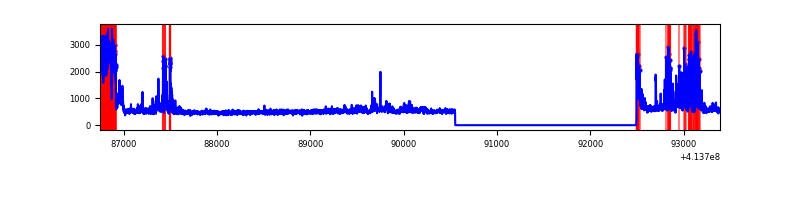 |
| D | 6646 | 4704 | 246 | 246 | 3.70% | 5.23% | 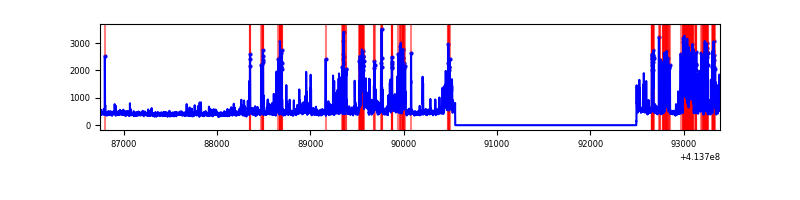 |
Top three noisy pixels from each quadrant. If the there are fewer than three noisy pixels in the level2.evt file, extra rows are filled as -1
| Pixel properties | Quadrant properties | ||||||
|---|---|---|---|---|---|---|---|
| Quadrant | DetID | PixID | Counts | Sigma | Mean | Median | Sigma |
| A | 10 | 83 | 345439 | 3167.97 | 537 | 526 | 108.9 |
| A | 13 | 248 | 159057 | 1456.08 | 537 | 526 | 108.9 |
| A | 7 | 3 | 70651 | 644.09 | 537 | 526 | 108.9 |
| B | 4 | 170 | 443307 | 4334.42 | 533 | 517 | 102.2 |
| B | 5 | 255 | 69994 | 680.1 | 533 | 517 | 102.2 |
| B | 0 | 230 | 24184 | 231.67 | 533 | 517 | 102.2 |
| C | 9 | 187 | 901420 | 7361.95 | 523 | 526 | 122.4 |
| C | 15 | 214 | 190589 | 1553.16 | 523 | 526 | 122.4 |
| C | 1 | 16 | 72846 | 590.99 | 523 | 526 | 122.4 |
| D | 2 | 249 | 582123 | 4559.91 | 522 | 509 | 127.5 |
| D | 2 | 250 | 243053 | 1901.57 | 522 | 509 | 127.5 |
| D | 12 | 233 | 183730 | 1436.47 | 522 | 509 | 127.5 |
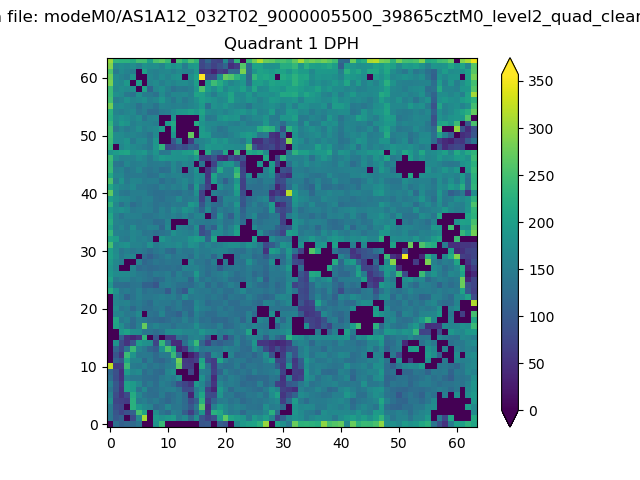
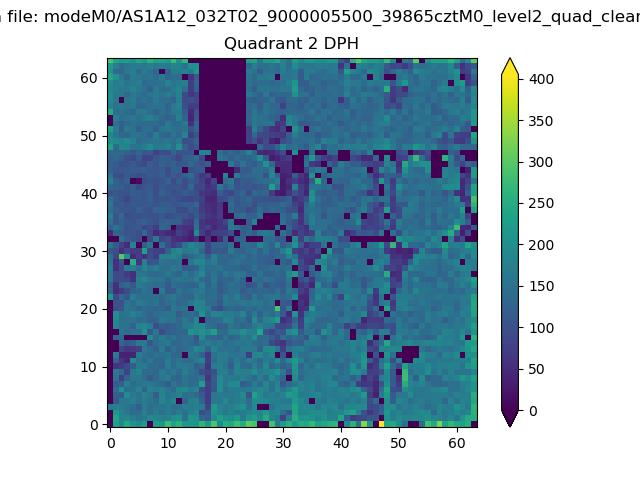
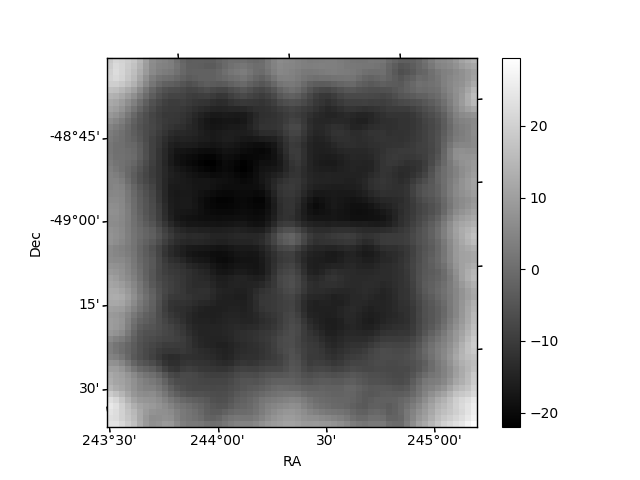
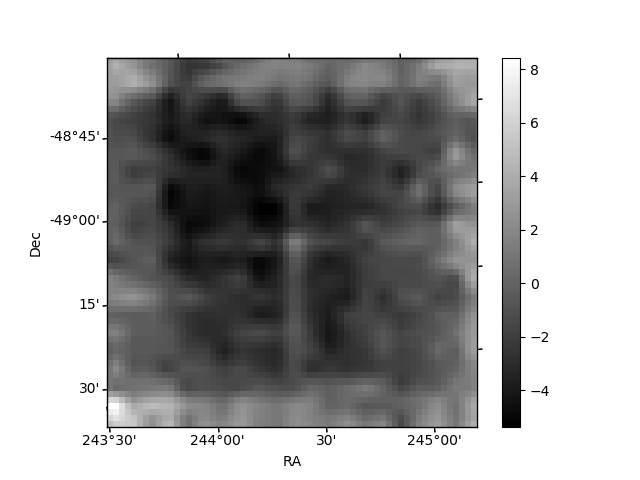
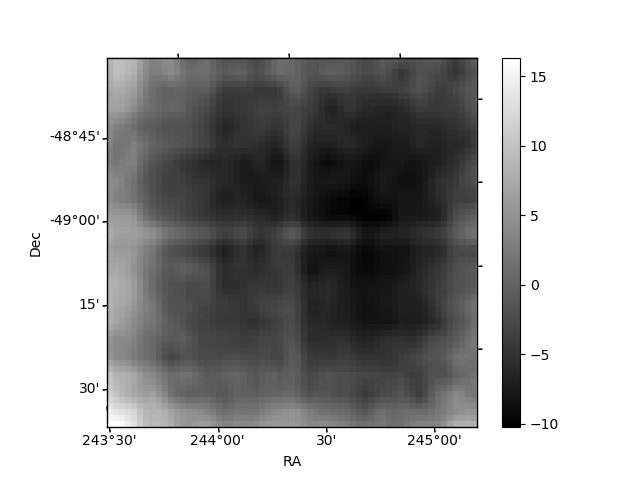
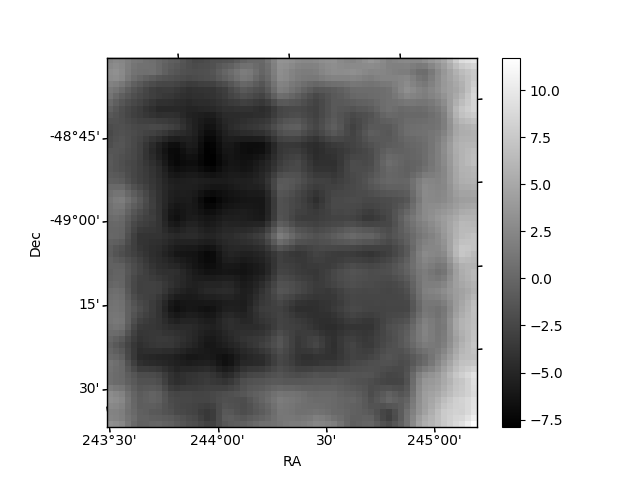
Histogram calculated using DETX and DETY for each event in the final _common_clean file
| Quadrant A | 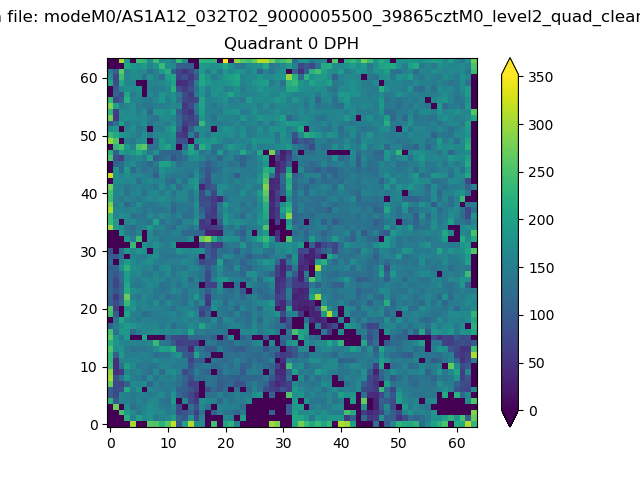 |
 |
Quadrant B |
|---|---|---|---|
| Quadrant D | 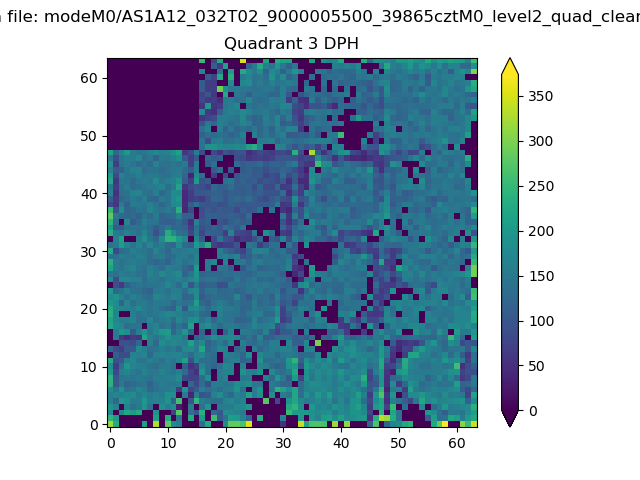 |
 |
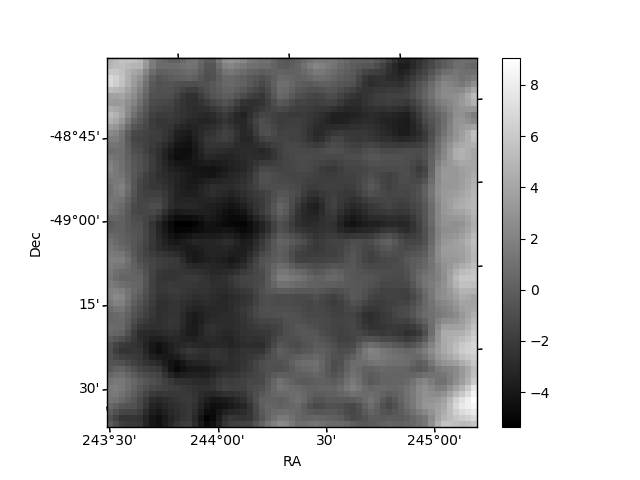
Quadrant C |
| Plot type | Count rate plots | Images |
|---|---|---|
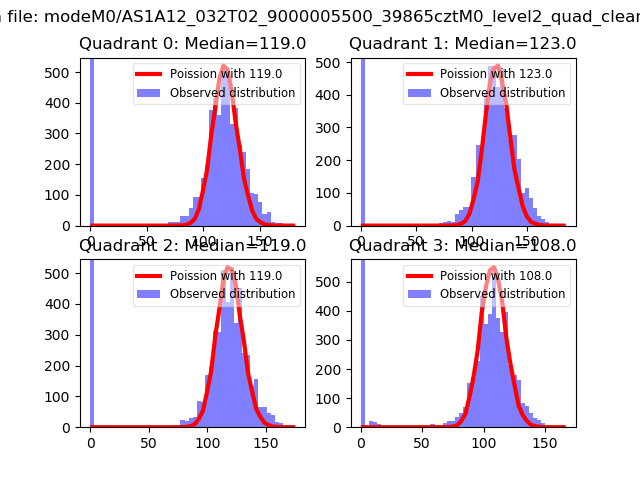
| Comparison with Poisson distribution Blue bars denote a histogram of data divided into 1 sec bins. Red curve is a Poisson curve with rate = median count rate of data. |
 |
 |
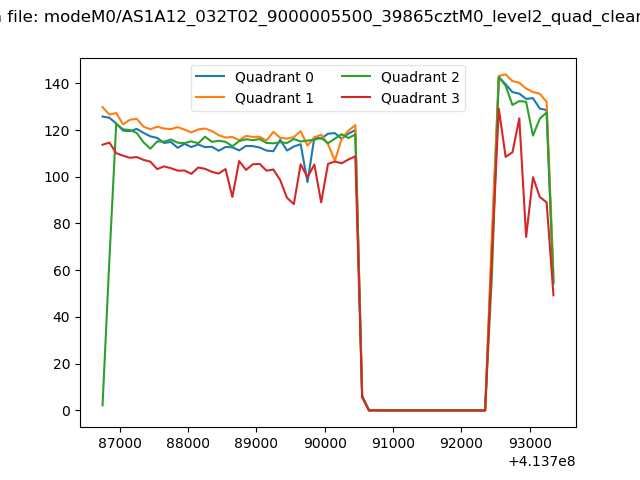
| Quadrant-wise count rates Data is divided into 100 sec bins |
 |
|
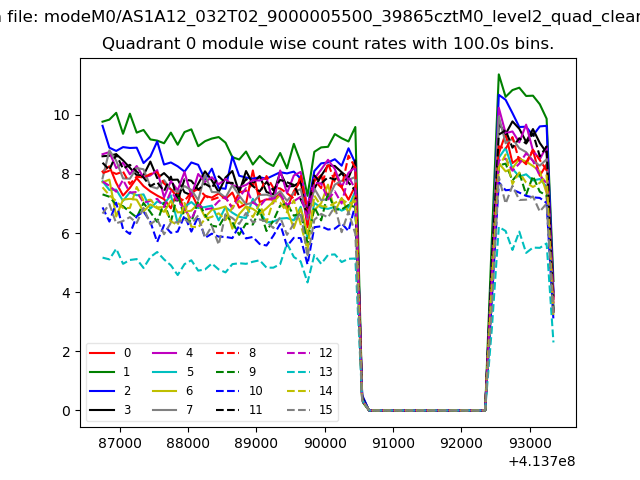
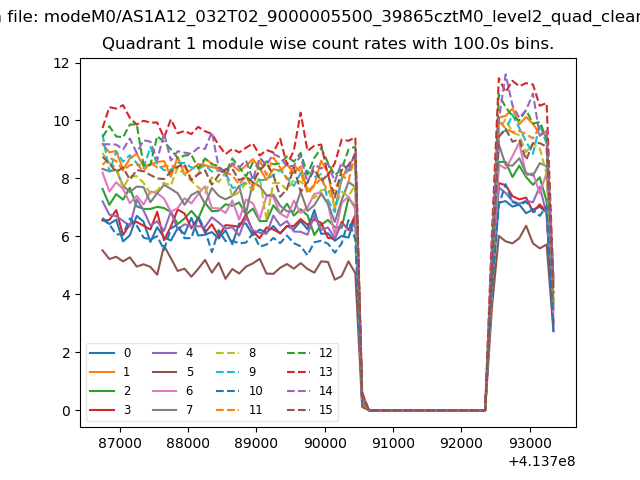
| Module-wise count rates for Quadrant A Data is divided into 100 sec bins |
 |
 |
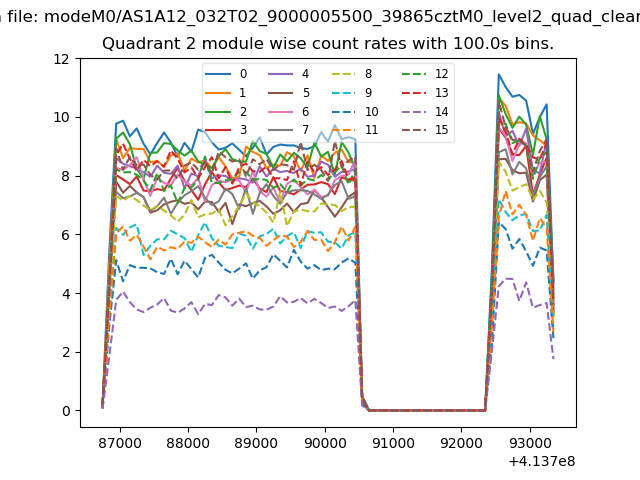
| Module-wise count rates for Quadrant B Data is divided into 100 sec bins |
 |
 |
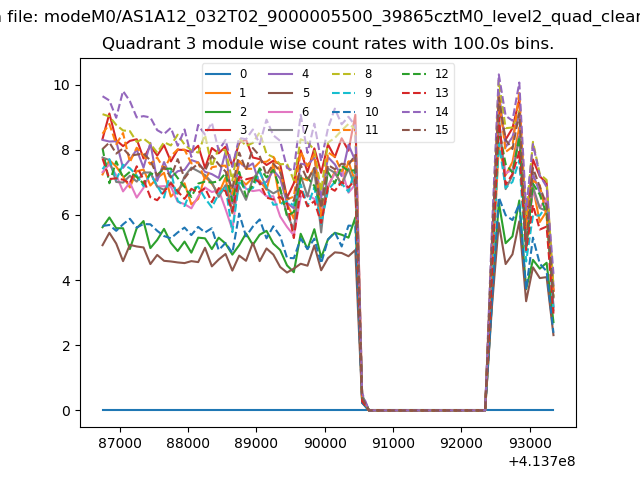
| Module-wise count rates for Quadrant C Data is divided into 100 sec bins |
 |
 |
| Module-wise count rates for Quadrant D Data is divided into 100 sec bins |
 |
 |
| Parameter | Plot |
|---|---|
| CZT HV Monitor |  |
| D_VDD | 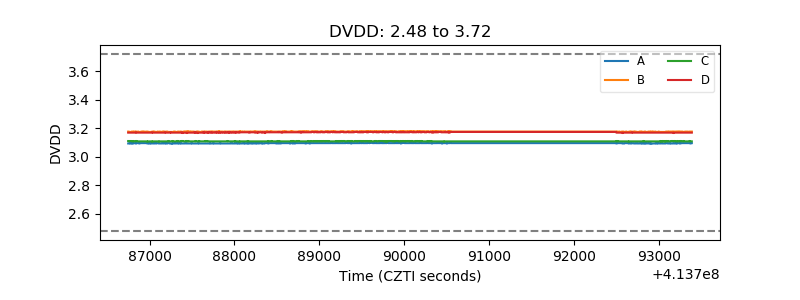 |
| Temperature 1 | 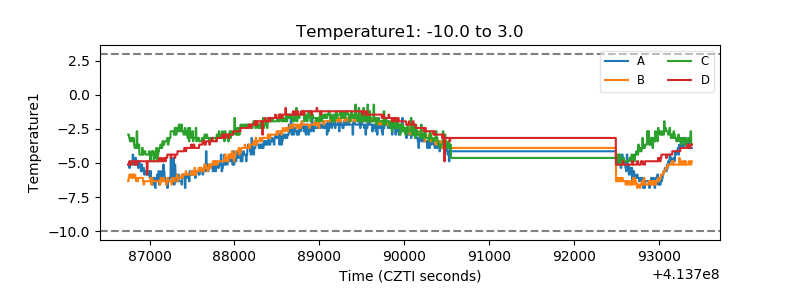 |
| Veto HV Monitor | 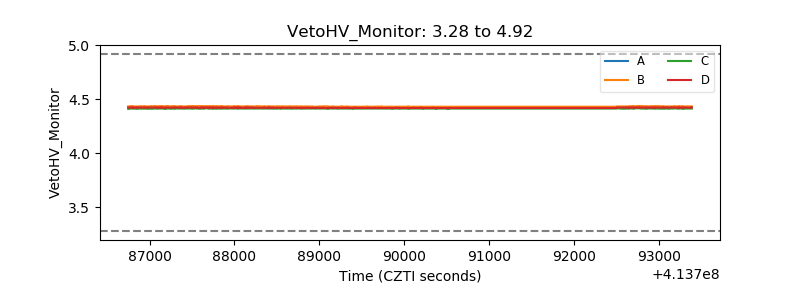 |
| Veto LLD |  |
| Alpha Counter | 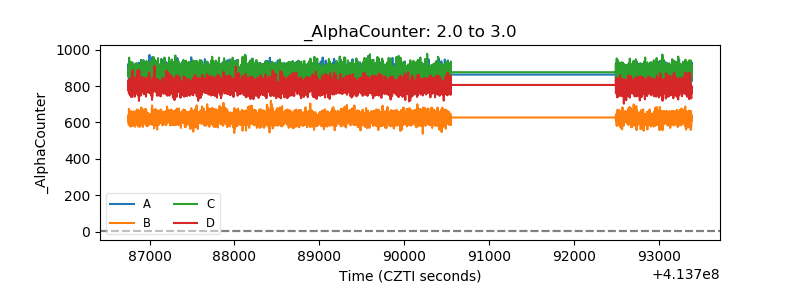 |
| _CPM_Rate | 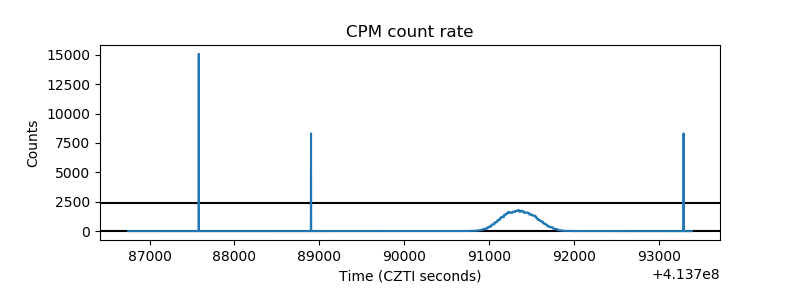 |
| CZT Counter | 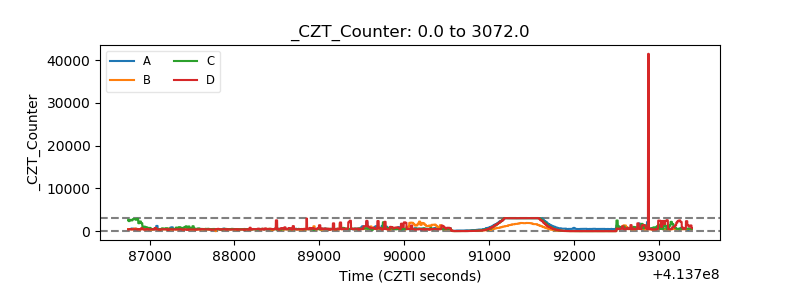 |
| +2.5 Volts monitor | 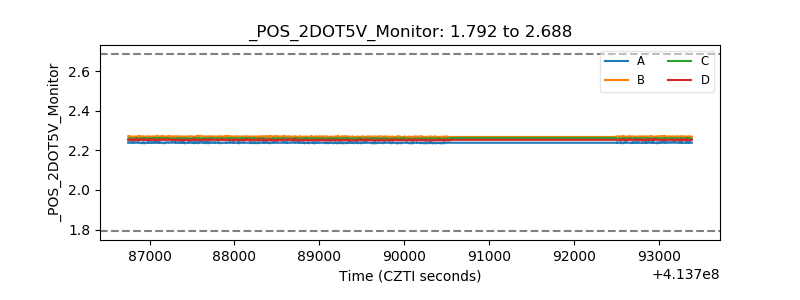 |
| +5 Volts monitor | 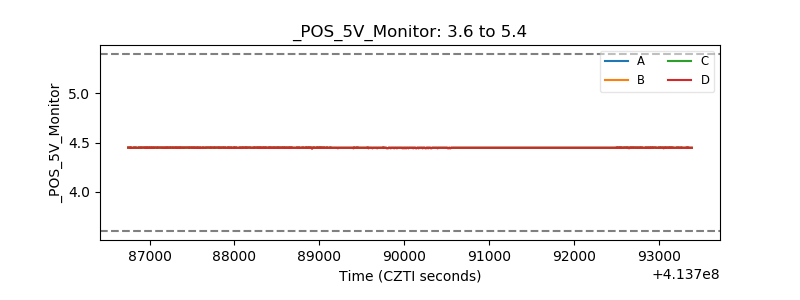 |
| _ROLL_ROT | 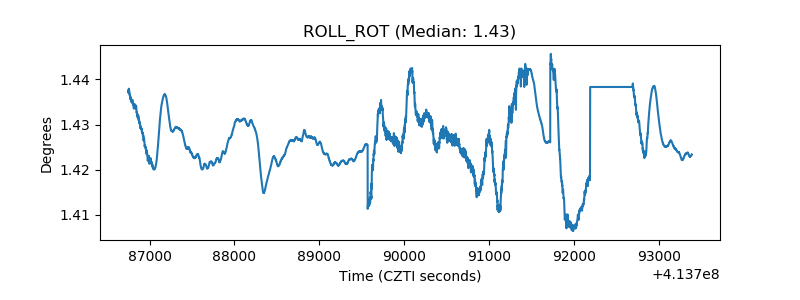 |
| _Roll_DEC | 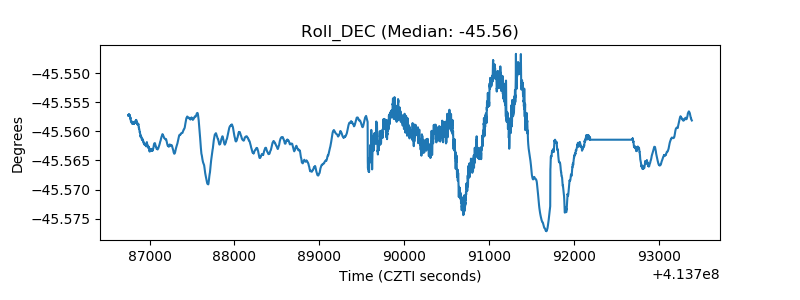 |
| _Roll_RA |  |
| Veto Counter | 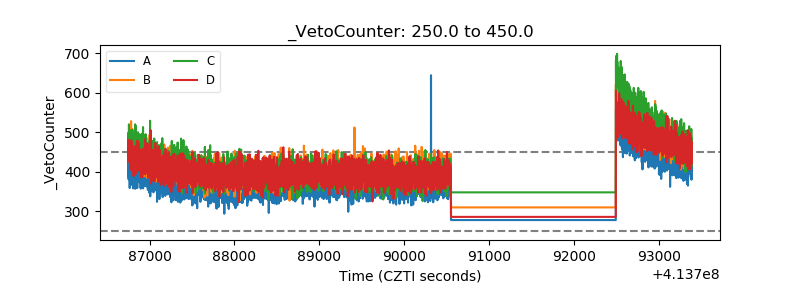 |