| Param | Original file | Final file |
|---|---|---|
| Filename | modeM0/AS1A12_032T02_9000005500_39866cztM0_level2.fits | modeM0/AS1A12_032T02_9000005500_39866cztM0_level2_quad_clean.evt |
| Size (bytes) | 191,874,240 | 44,331,840 |
| Size | 183.0 MB | 42.3 MB |
| Events in quadrant A | 2,234,182 | 264,470 |
| Events in quadrant B | 1,391,298 | 316,368 |
| Events in quadrant C | 1,493,586 | 306,023 |
| Events in quadrant D | 1,777,156 | 266,825 |
| Mode M9 | |||
|---|---|---|---|
| Quadrant | BADHDUFLAG | Total packets | Discarded packets |
| A | 0 | 12 | 3 |
| B | 0 | 13 | 6 |
| C | 0 | 16 | 8 |
| D | 0 | 16 | 7 |
| Mode SS | |||
|---|---|---|---|
| Quadrant | BADHDUFLAG | Total packets | Discarded packets |
| A | 0 | 93 | 33 |
| B | 0 | 92 | 33 |
| C | 0 | 90 | 34 |
| D | 0 | 89 | 31 |
| Mode M0 | |||
|---|---|---|---|
| Quadrant | BADHDUFLAG | Total packets | Discarded packets |
| A | 0 | 14189 | 6005 |
| B | 0 | 9542 | 3763 |
| C | 0 | 10416 | 4508 |
| D | 0 | 12591 | 5602 |
| Quadrant | Total seconds | Saturated seconds | Saturation percentage |
|---|---|---|---|
| A | 2560 | 285 | 11.132812% |
| B | 2667 | 15 | 0.562430% |
| C | 2645 | 7 | 0.264650% |
| D | 2589 | 100 | 3.862495% |
Noise dominated data is calculated using 1-second bins in cleaned event files. If a bin has >2000 counts, and if more than 50% of those come from <1% of pixels, then it is considered to be noise-dominated and hence unusable.
| Quadrant | # 1 sec bins | Bins with >0 counts | Bins with >2000 counts | High rate bins dominated by noise | Noise dominated (total time) | Noise dominated (detector-on time) | Marked lightcurve |
|---|---|---|---|---|---|---|---|
| A | 6973 | 2960 | 231 | 231 | 3.31% | 7.80% | 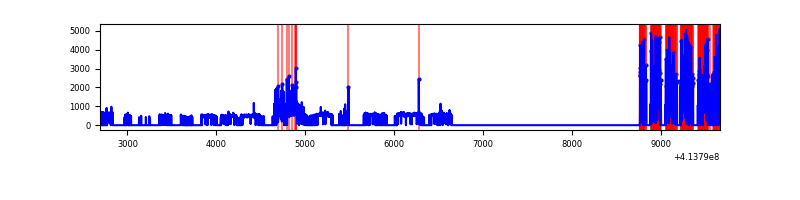 |
| B | 6975 | 3078 | 4 | 4 | 0.06% | 0.13% | 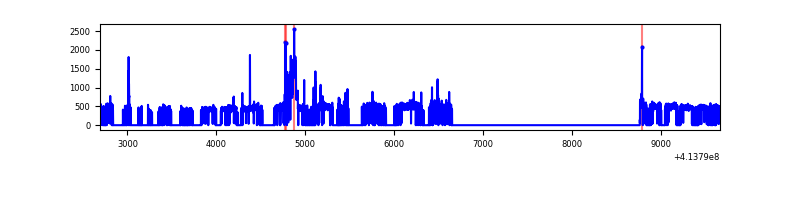 |
| C | 6975 | 3008 | 4 | 4 | 0.06% | 0.13% | 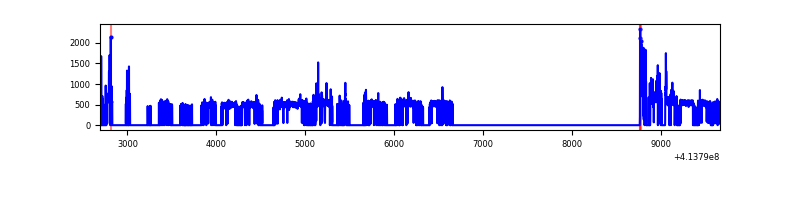 |
| D | 6974 | 2991 | 80 | 80 | 1.15% | 2.67% | 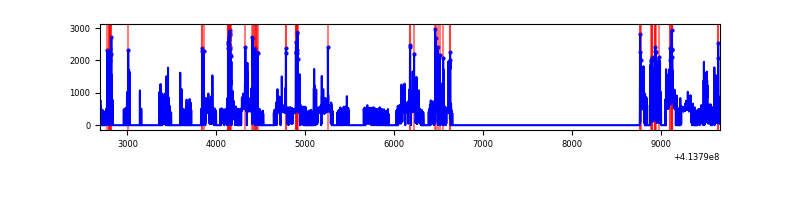 |
Top three noisy pixels from each quadrant. If the there are fewer than three noisy pixels in the level2.evt file, extra rows are filled as -1
| Pixel properties | Quadrant properties | ||||||
|---|---|---|---|---|---|---|---|
| Quadrant | DetID | PixID | Counts | Sigma | Mean | Median | Sigma |
| A | 6 | 10 | 764519 | 13011.96 | 284 | 279 | 58.7 |
| A | 10 | 83 | 200804 | 3414.14 | 284 | 279 | 58.7 |
| A | 13 | 248 | 118579 | 2014.18 | 284 | 279 | 58.7 |
| B | 4 | 170 | 96020 | 1601.96 | 310 | 303 | 59.7 |
| B | 5 | 255 | 18820 | 309.91 | 310 | 303 | 59.7 |
| B | 0 | 230 | 11754 | 191.65 | 310 | 303 | 59.7 |
| C | 15 | 214 | 111352 | 1550.0 | 306 | 309 | 71.6 |
| C | 9 | 187 | 102173 | 1421.88 | 306 | 309 | 71.6 |
| C | 1 | 16 | 54383 | 754.8 | 306 | 309 | 71.6 |
| D | 12 | 227 | 266361 | 3655.63 | 297 | 289 | 72.8 |
| D | 13 | 249 | 129448 | 1774.55 | 297 | 289 | 72.8 |
| D | 2 | 249 | 91180 | 1248.77 | 297 | 289 | 72.8 |
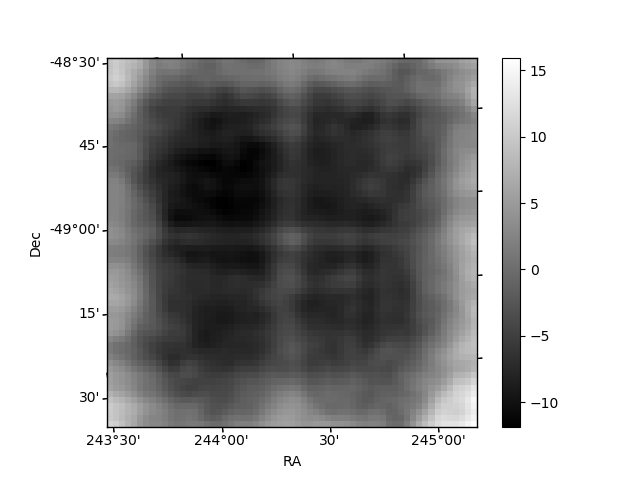
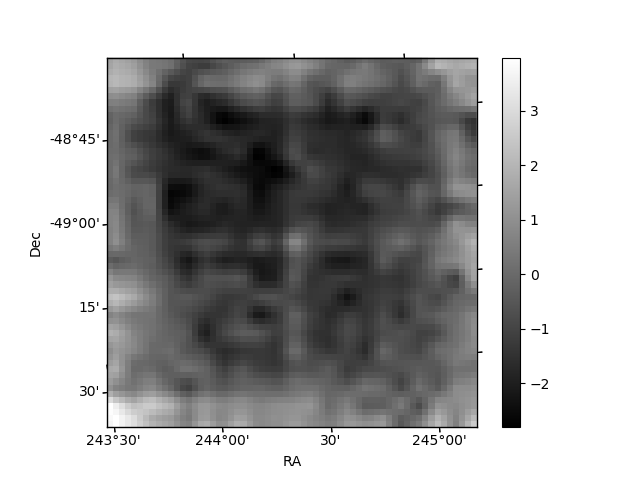
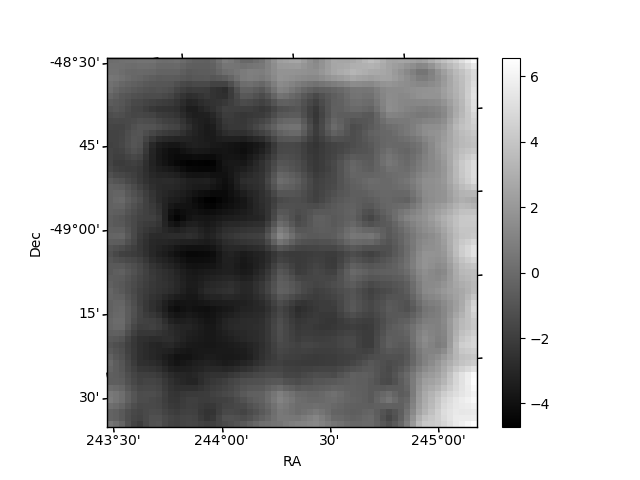
Histogram calculated using DETX and DETY for each event in the final _common_clean file
| Quadrant A | 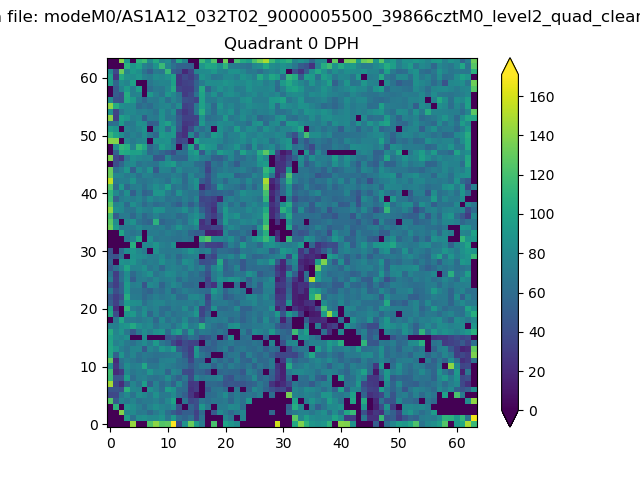 |
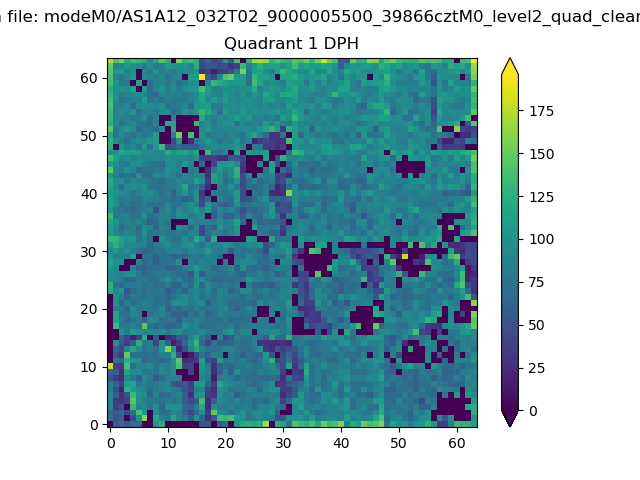 |
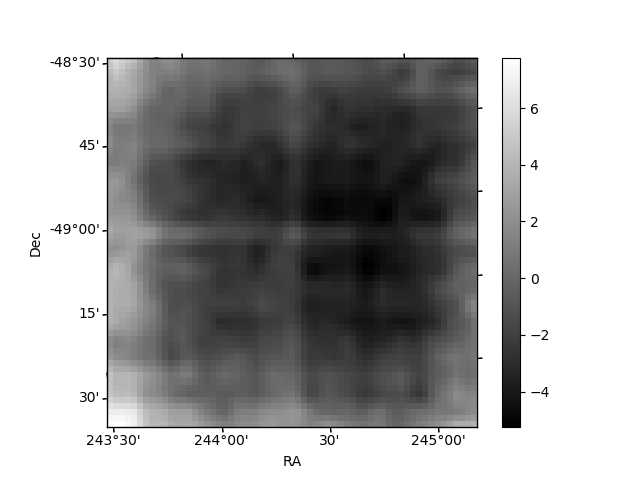
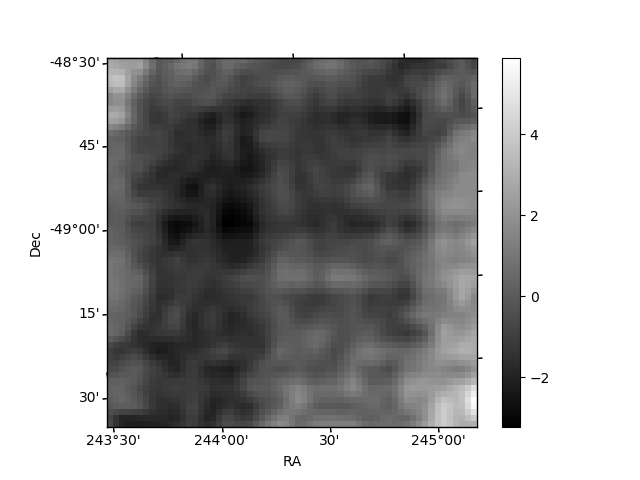
Quadrant B |
|---|---|---|---|
| Quadrant D | 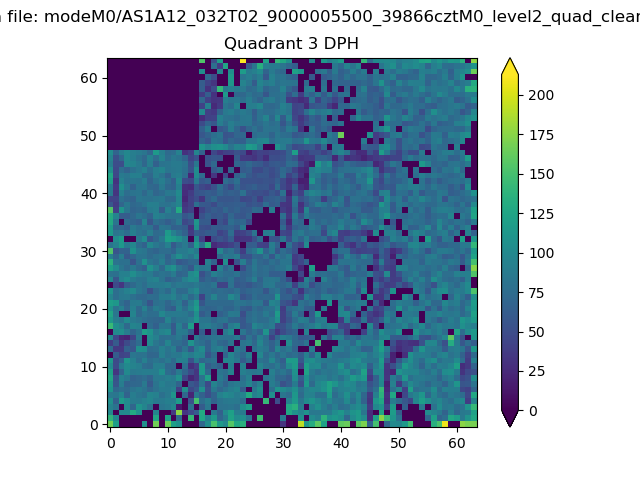 |
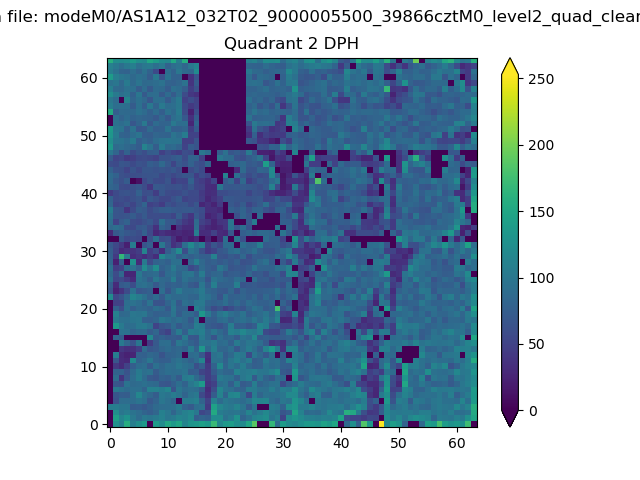 |
Quadrant C |
| Plot type | Count rate plots | Images |
|---|---|---|
| Comparison with Poisson distribution Blue bars denote a histogram of data divided into 1 sec bins. Red curve is a Poisson curve with rate = median count rate of data. |
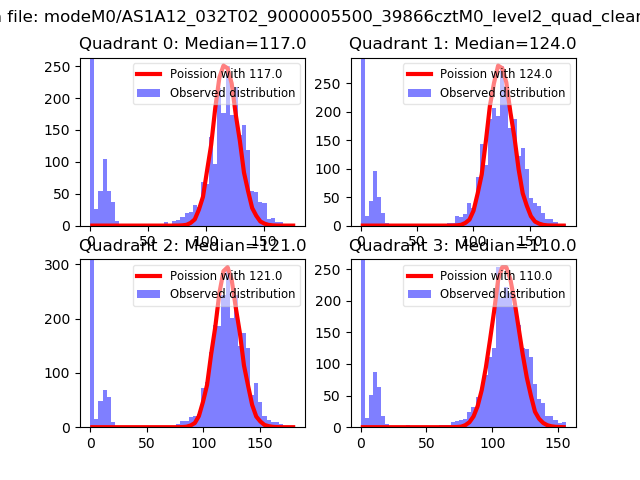 |
 |
| Quadrant-wise count rates Data is divided into 100 sec bins |
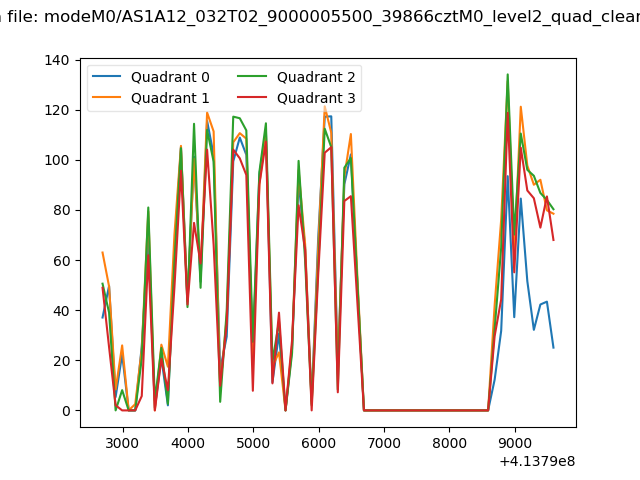 |
|
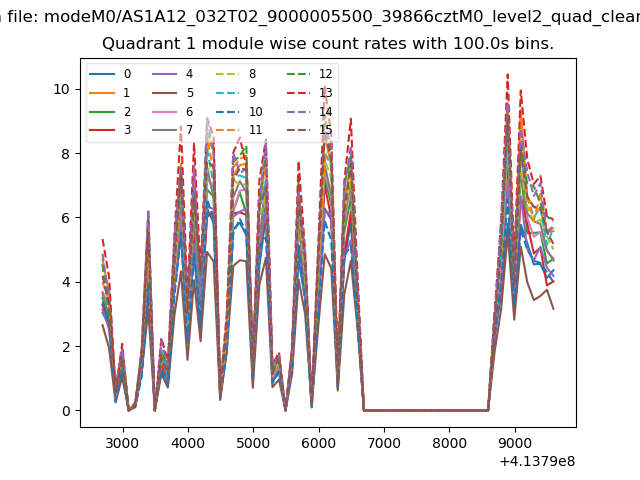
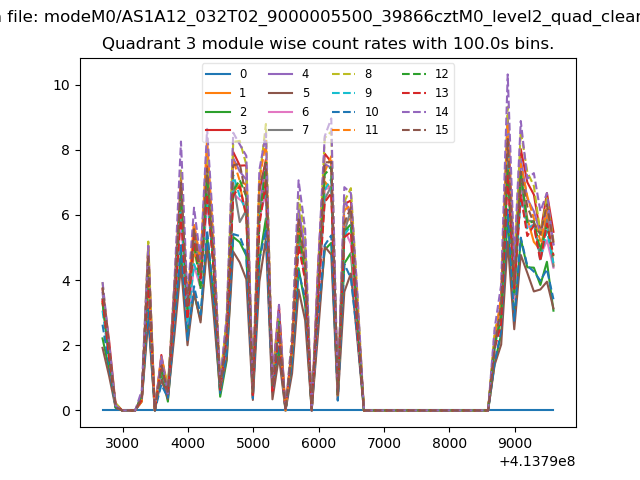
| Module-wise count rates for Quadrant A Data is divided into 100 sec bins |
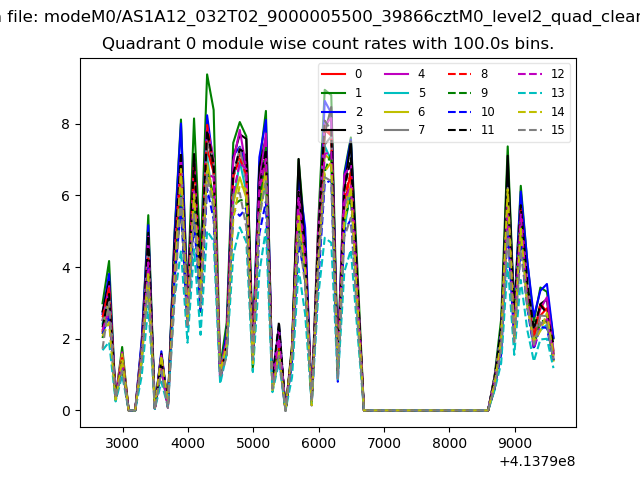 |
 |
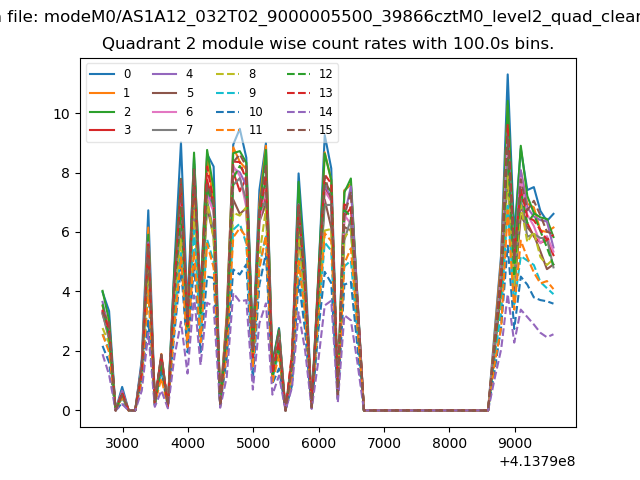
| Module-wise count rates for Quadrant B Data is divided into 100 sec bins |
 |
 |
| Module-wise count rates for Quadrant C Data is divided into 100 sec bins |
 |
 |
| Module-wise count rates for Quadrant D Data is divided into 100 sec bins |
 |
 |
| Parameter | Plot |
|---|---|
| CZT HV Monitor | 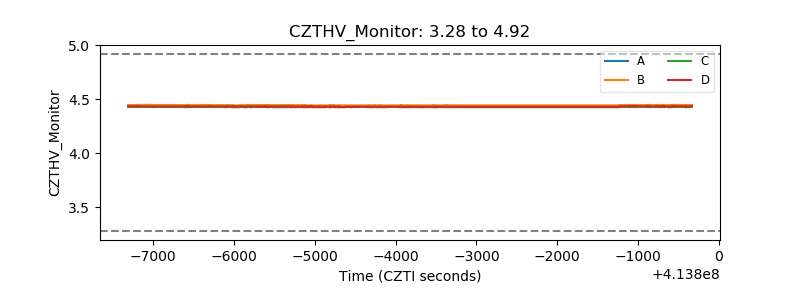 |
| D_VDD | 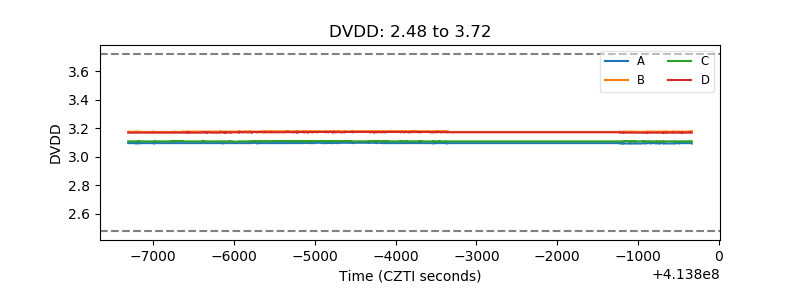 |
| Temperature 1 | 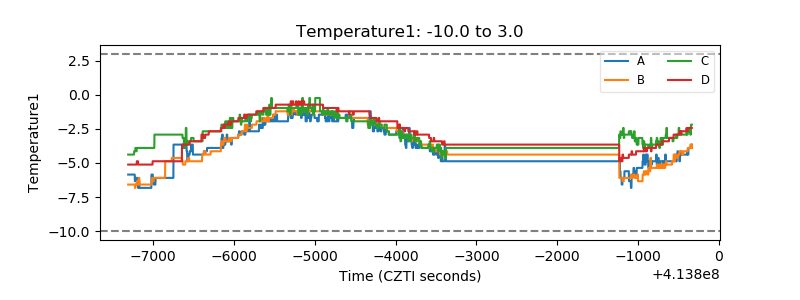 |
| Veto HV Monitor | 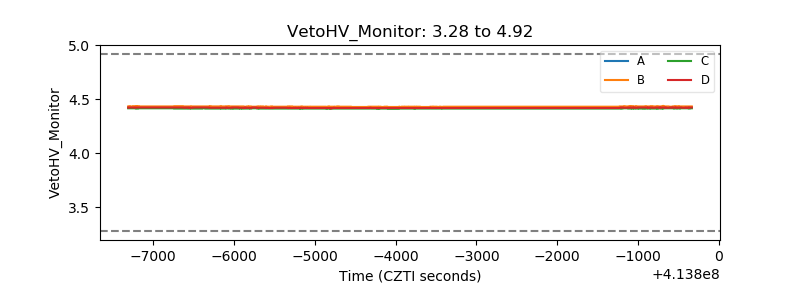 |
| Veto LLD | 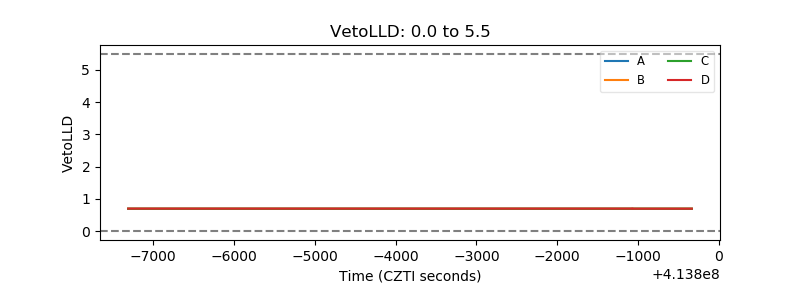 |
| Alpha Counter | 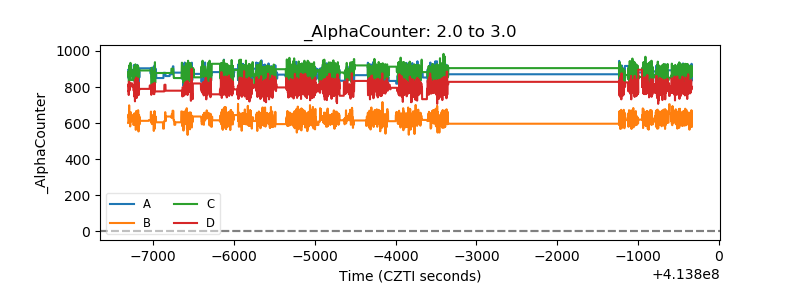 |
| _CPM_Rate | 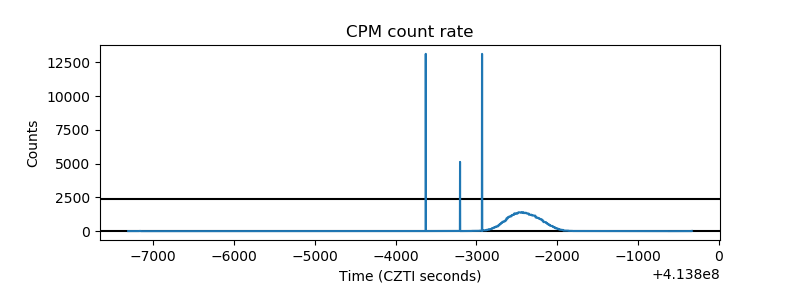 |
| CZT Counter | 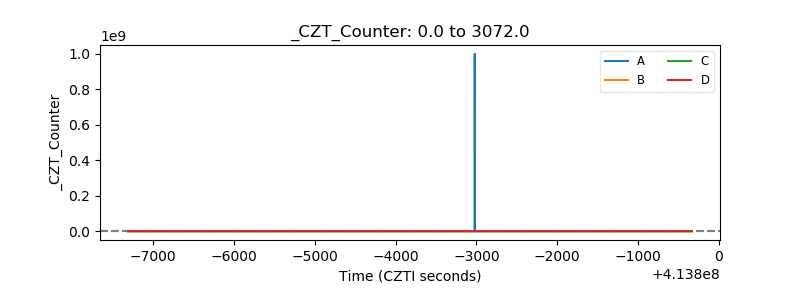 |
| +2.5 Volts monitor | 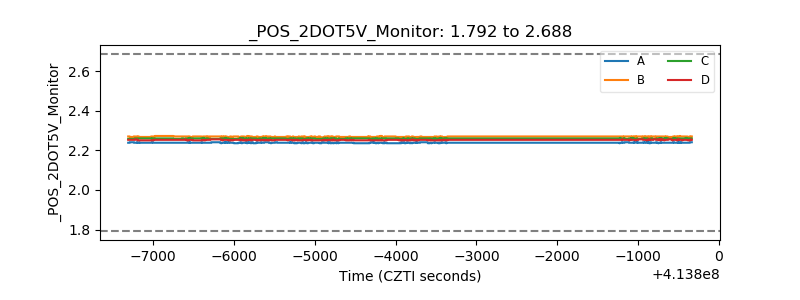 |
| +5 Volts monitor | 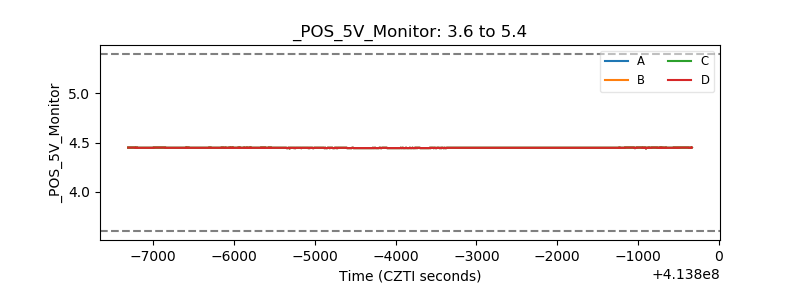 |
| _ROLL_ROT | 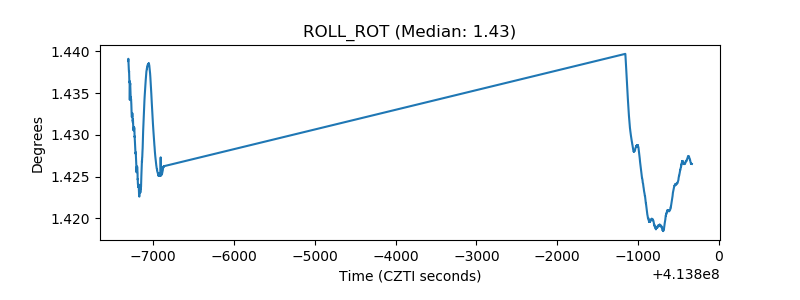 |
| _Roll_DEC | 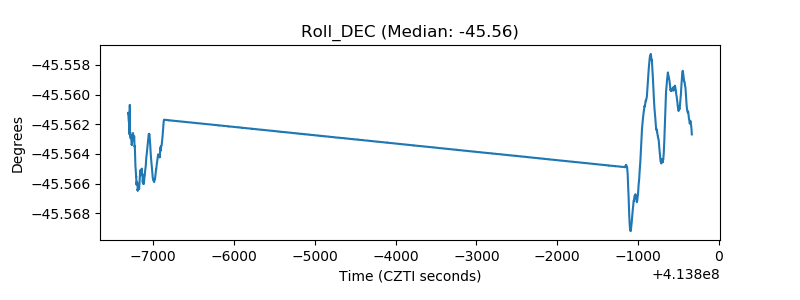 |
| _Roll_RA | 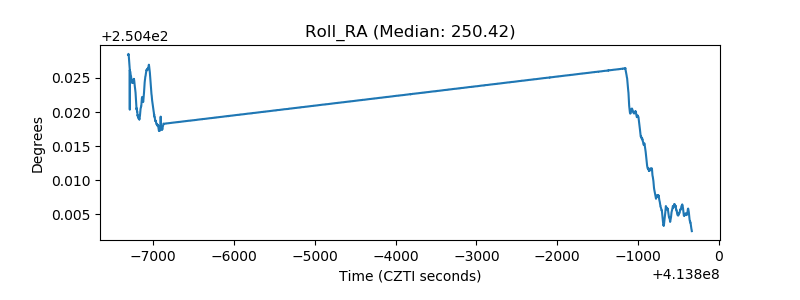 |
| Veto Counter | 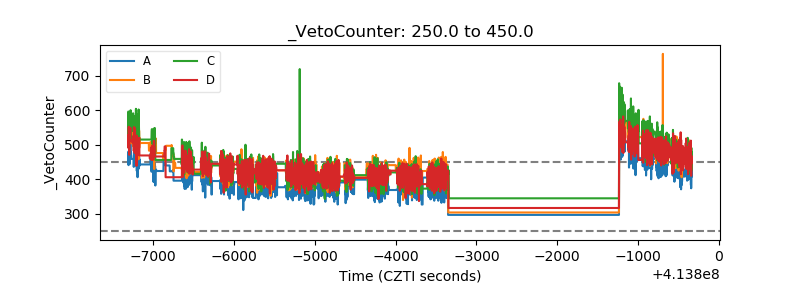 |