| Param | Original file | Final file |
|---|---|---|
| Filename | modeM0/AS1A12_032T02_9000005500_39868cztM0_level2.fits | modeM0/AS1A12_032T02_9000005500_39868cztM0_level2_quad_clean.evt |
| Size (bytes) | 475,565,760 | 78,295,680 |
| Size | 453.5 MB | 74.7 MB |
| Events in quadrant A | 7,138,875 | 418,518 |
| Events in quadrant B | 3,683,277 | 563,940 |
| Events in quadrant C | 2,482,864 | 565,377 |
| Events in quadrant D | 3,928,600 | 487,788 |
| Mode M9 | |||
|---|---|---|---|
| Quadrant | BADHDUFLAG | Total packets | Discarded packets |
| A | 0 | 23 | 0 |
| B | 0 | 23 | 0 |
| C | 0 | 23 | 0 |
| D | 0 | 24 | 0 |
| Mode SS | |||
|---|---|---|---|
| Quadrant | BADHDUFLAG | Total packets | Discarded packets |
| A | 0 | 98 | 0 |
| B | 0 | 98 | 0 |
| C | 0 | 98 | 0 |
| D | 0 | 98 | 0 |
| Mode M0 | |||
|---|---|---|---|
| Quadrant | BADHDUFLAG | Total packets | Discarded packets |
| A | 0 | 24502 | 3 |
| B | 0 | 14147 | 2 |
| C | 0 | 9987 | 2 |
| D | 0 | 14797 | 2 |
| Quadrant | Total seconds | Saturated seconds | Saturation percentage |
|---|---|---|---|
| A | 4769 | 1624 | 34.053261% |
| B | 4769 | 212 | 4.445376% |
| C | 4769 | 11 | 0.230656% |
| D | 4769 | 363 | 7.611659% |
Noise dominated data is calculated using 1-second bins in cleaned event files. If a bin has >2000 counts, and if more than 50% of those come from <1% of pixels, then it is considered to be noise-dominated and hence unusable.
| Quadrant | # 1 sec bins | Bins with >0 counts | Bins with >2000 counts | High rate bins dominated by noise | Noise dominated (total time) | Noise dominated (detector-on time) | Marked lightcurve |
|---|---|---|---|---|---|---|---|
| A | 6922 | 4770 | 1316 | 1316 | 19.01% | 27.59% | 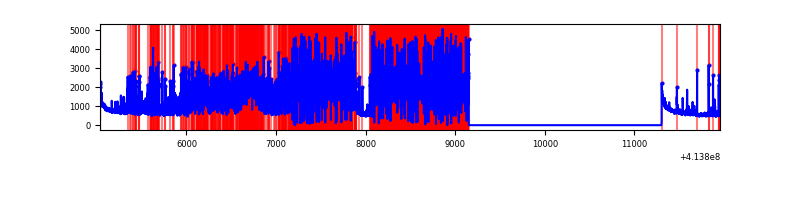 |
| B | 6922 | 4770 | 134 | 134 | 1.94% | 2.81% | 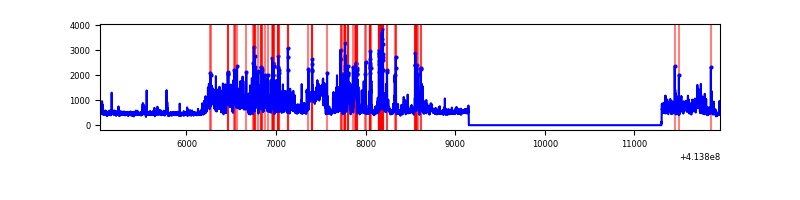 |
| C | 6922 | 4770 | 7 | 7 | 0.10% | 0.15% | 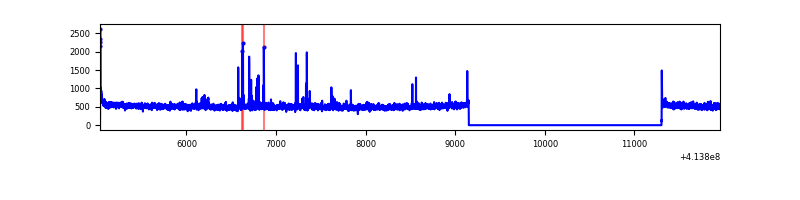 |
| D | 6922 | 4770 | 328 | 328 | 4.74% | 6.88% | 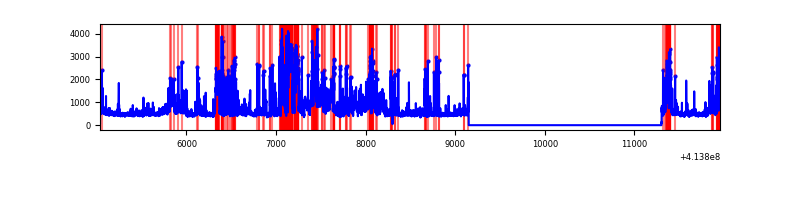 |
Top three noisy pixels from each quadrant. If the there are fewer than three noisy pixels in the level2.evt file, extra rows are filled as -1
| Pixel properties | Quadrant properties | ||||||
|---|---|---|---|---|---|---|---|
| Quadrant | DetID | PixID | Counts | Sigma | Mean | Median | Sigma |
| A | 6 | 10 | 4306144 | 44620.4 | 473 | 465 | 96.5 |
| A | 10 | 83 | 435428 | 4507.59 | 473 | 465 | 96.5 |
| A | 13 | 248 | 382833 | 3962.54 | 473 | 465 | 96.5 |
| B | 4 | 170 | 374428 | 3678.9 | 536 | 522 | 101.6 |
| B | 5 | 172 | 364334 | 3579.59 | 536 | 522 | 101.6 |
| B | 0 | 229 | 196158 | 1924.89 | 536 | 522 | 101.6 |
| C | 15 | 214 | 209072 | 1673.56 | 537 | 542 | 124.6 |
| C | 1 | 16 | 75986 | 605.47 | 537 | 542 | 124.6 |
| C | 14 | 254 | 36867 | 291.52 | 537 | 542 | 124.6 |
| D | 12 | 227 | 1013395 | 7956.09 | 522 | 508 | 127.3 |
| D | 2 | 249 | 224061 | 1755.98 | 522 | 508 | 127.3 |
| D | 13 | 249 | 222286 | 1742.04 | 522 | 508 | 127.3 |
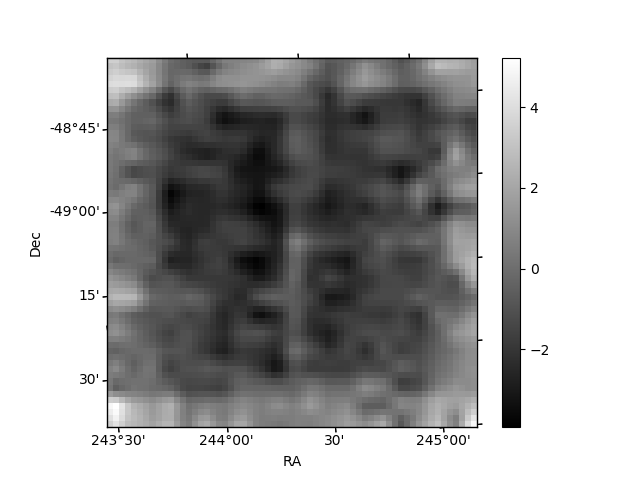
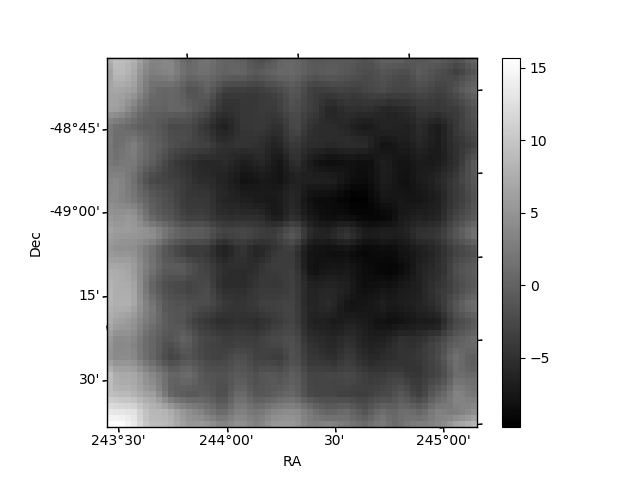
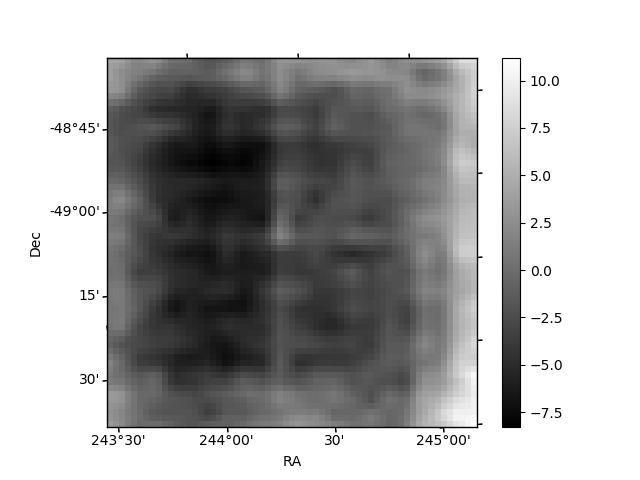
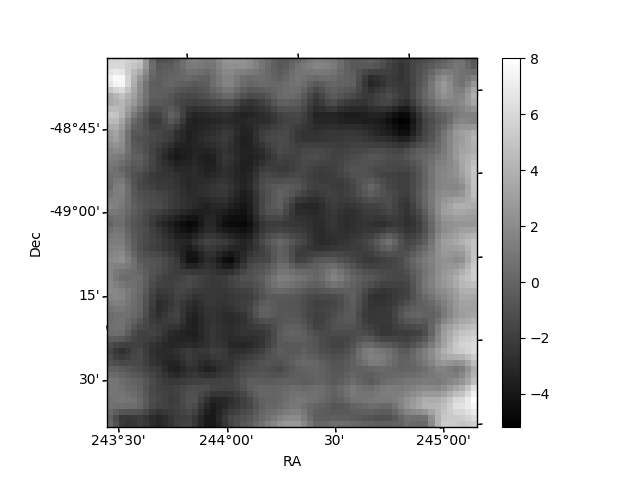
Histogram calculated using DETX and DETY for each event in the final _common_clean file
| Quadrant A | 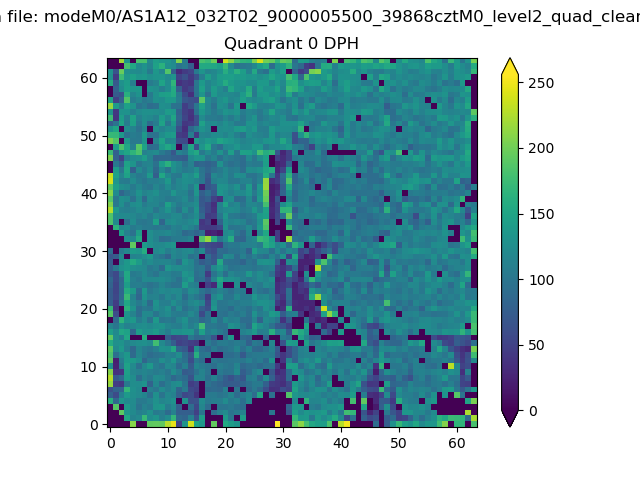 |
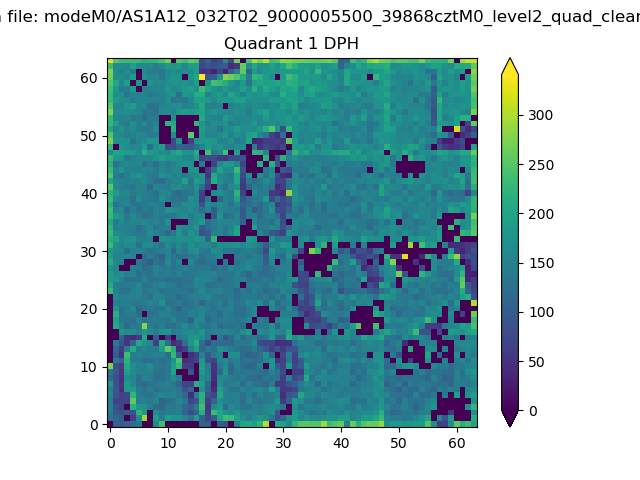 |
Quadrant B |
|---|---|---|---|
| Quadrant D | 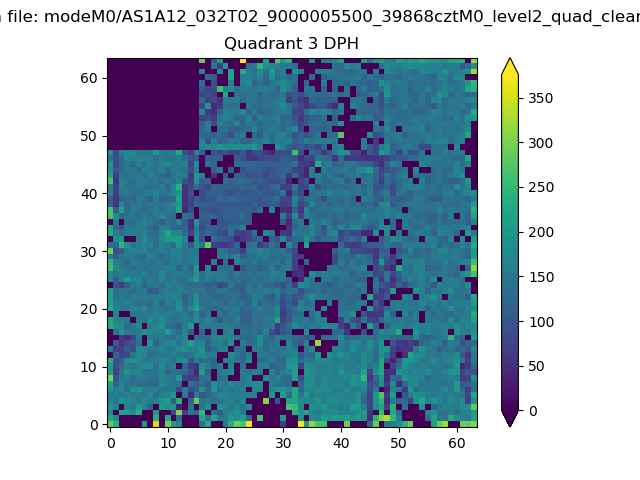 |
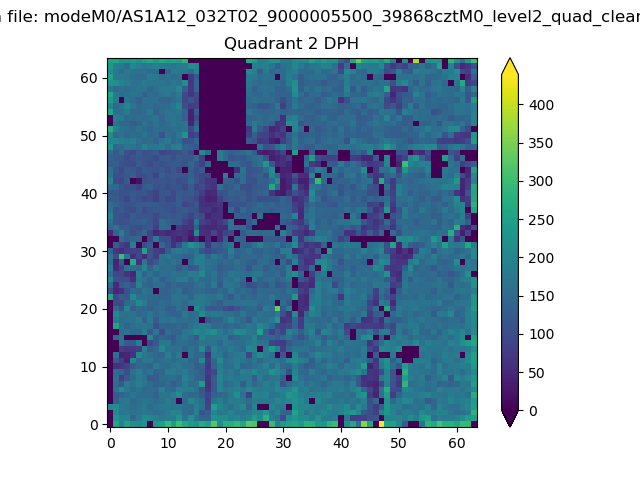 |
Quadrant C |
| Plot type | Count rate plots | Images |
|---|---|---|
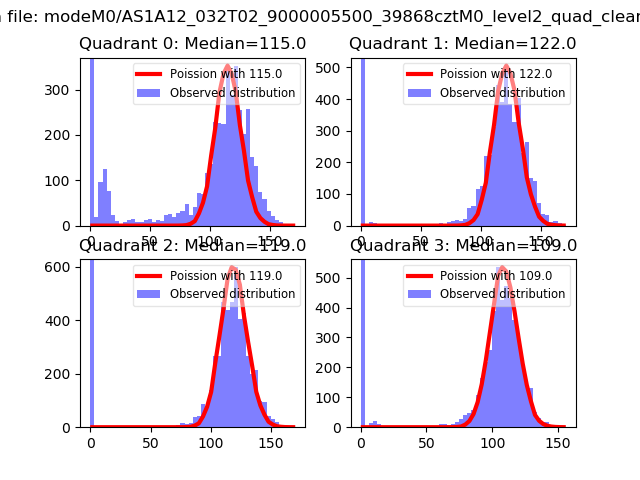
| Comparison with Poisson distribution Blue bars denote a histogram of data divided into 1 sec bins. Red curve is a Poisson curve with rate = median count rate of data. |
 |
 |
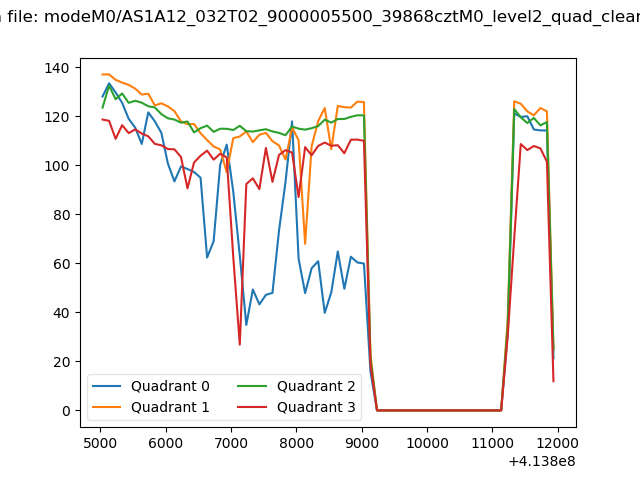
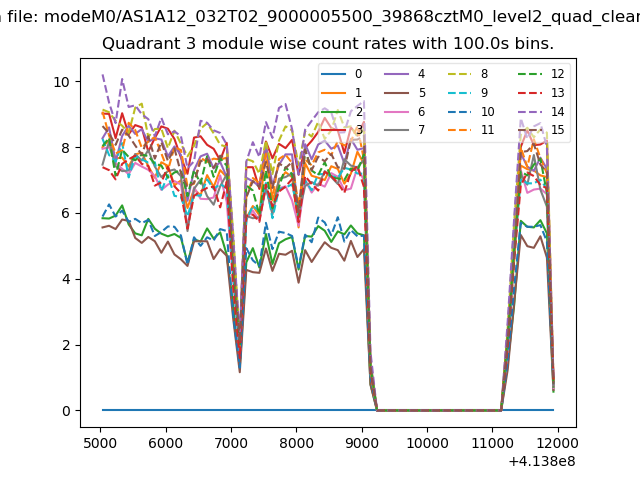
| Quadrant-wise count rates Data is divided into 100 sec bins |
 |
|
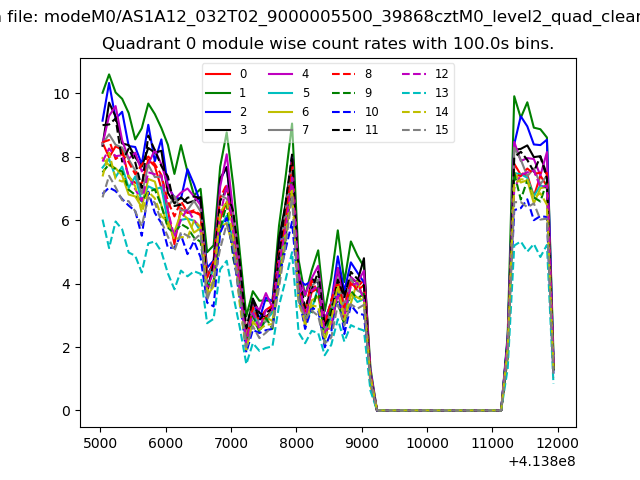
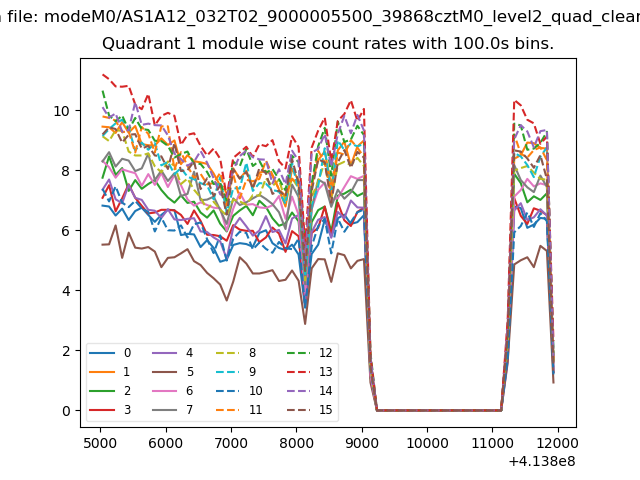
| Module-wise count rates for Quadrant A Data is divided into 100 sec bins |
 |
 |
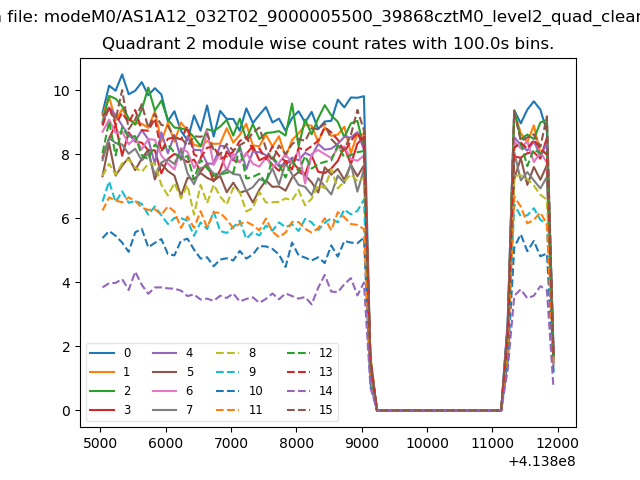
| Module-wise count rates for Quadrant B Data is divided into 100 sec bins |
 |
 |
| Module-wise count rates for Quadrant C Data is divided into 100 sec bins |
 |
 |
| Module-wise count rates for Quadrant D Data is divided into 100 sec bins |
 |
 |
| Parameter | Plot |
|---|---|
| CZT HV Monitor |  |
| D_VDD | 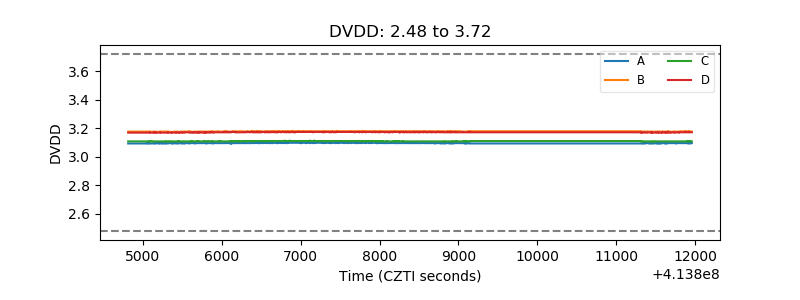 |
| Temperature 1 |  |
| Veto HV Monitor | 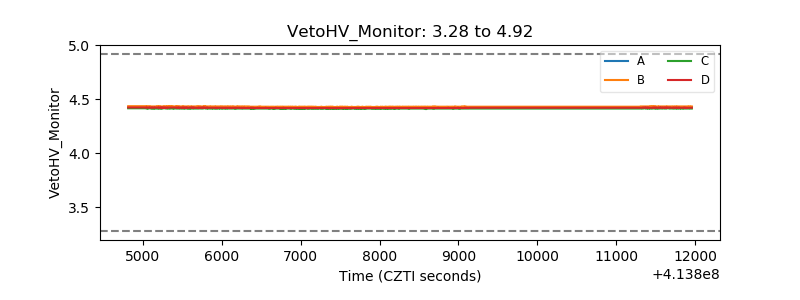 |
| Veto LLD | 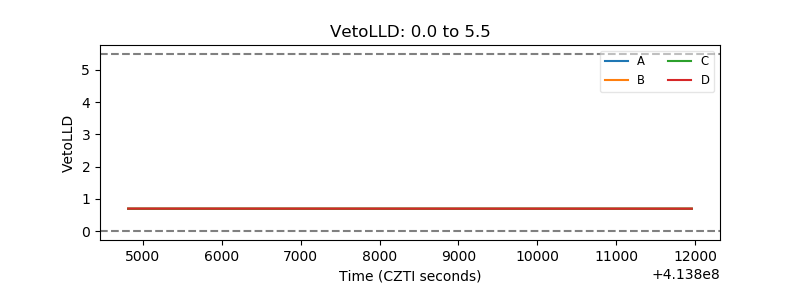 |
| Alpha Counter | 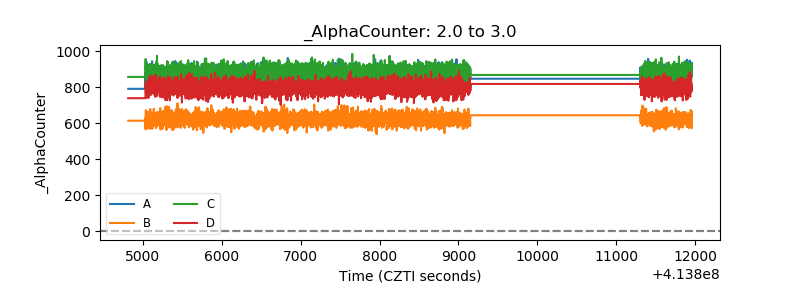 |
| _CPM_Rate | 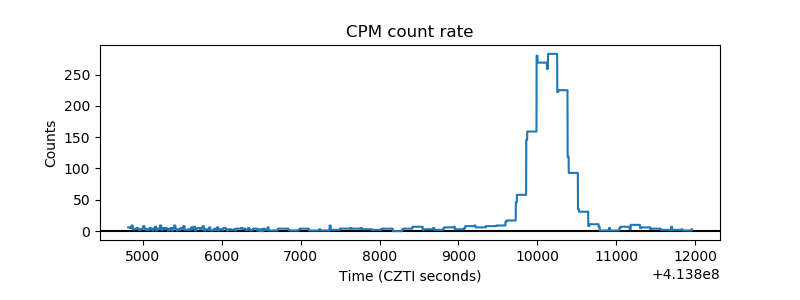 |
| CZT Counter |  |
| +2.5 Volts monitor | 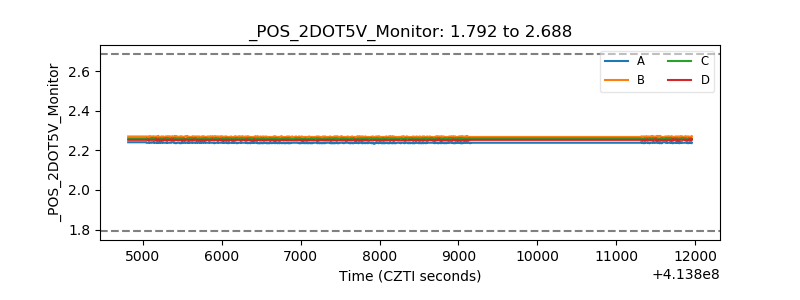 |
| +5 Volts monitor |  |
| _ROLL_ROT | 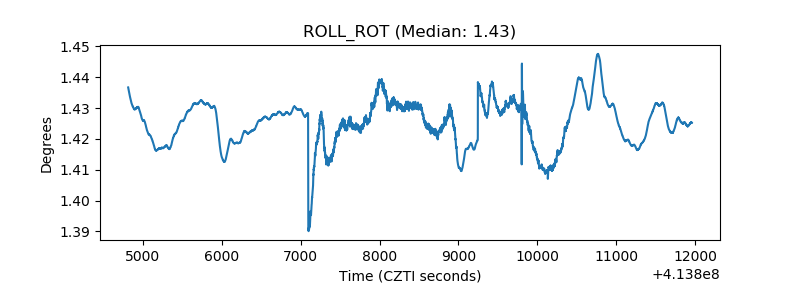 |
| _Roll_DEC | 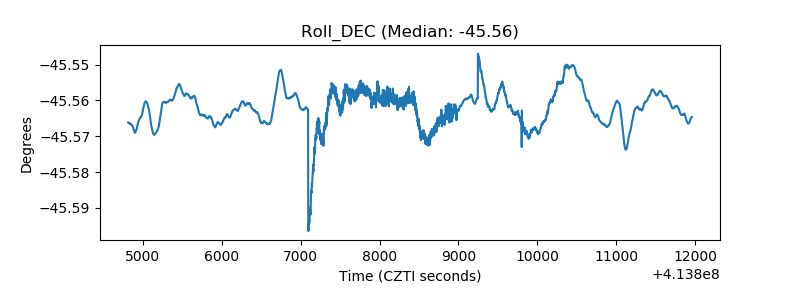 |
| _Roll_RA | 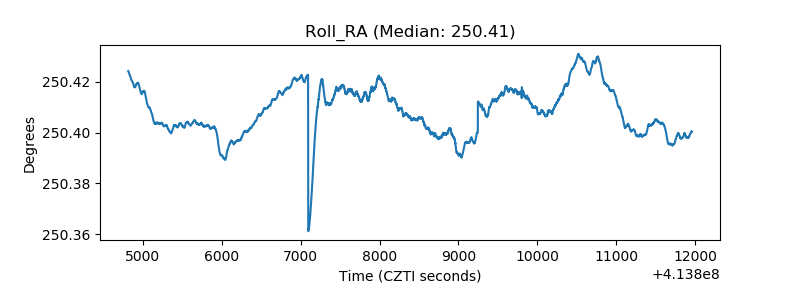 |
| Veto Counter | 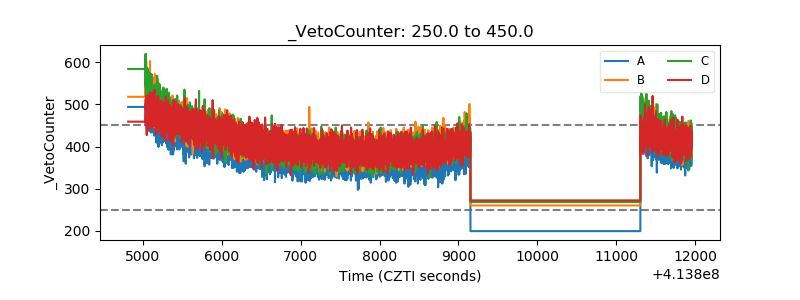 |