| Param | Original file | Final file |
|---|---|---|
| Filename | modeM0/AS1A12_032T02_9000005500_39869cztM0_level2.fits | modeM0/AS1A12_032T02_9000005500_39869cztM0_level2_quad_clean.evt |
| Size (bytes) | 440,406,720 | 88,070,400 |
| Size | 420.0 MB | 84.0 MB |
| Events in quadrant A | 3,480,823 | 600,314 |
| Events in quadrant B | 4,792,776 | 583,366 |
| Events in quadrant C | 2,935,826 | 602,047 |
| Events in quadrant D | 4,675,308 | 504,251 |
| Mode M9 | |||
|---|---|---|---|
| Quadrant | BADHDUFLAG | Total packets | Discarded packets |
| A | 0 | 26 | 0 |
| B | 0 | 26 | 0 |
| C | 0 | 26 | 0 |
| D | 0 | 27 | 0 |
| Mode SS | |||
|---|---|---|---|
| Quadrant | BADHDUFLAG | Total packets | Discarded packets |
| A | 0 | 110 | 0 |
| B | 0 | 110 | 0 |
| C | 0 | 110 | 0 |
| D | 0 | 110 | 0 |
| Mode M0 | |||
|---|---|---|---|
| Quadrant | BADHDUFLAG | Total packets | Discarded packets |
| A | 0 | 13595 | 6 |
| B | 0 | 17937 | 2 |
| C | 0 | 11929 | 2 |
| D | 0 | 17522 | 2 |
| Quadrant | Total seconds | Saturated seconds | Saturation percentage |
|---|---|---|---|
| A | 5376 | 106 | 1.971726% |
| B | 5377 | 448 | 8.331784% |
| C | 5377 | 61 | 1.134462% |
| D | 5377 | 627 | 11.660777% |
Noise dominated data is calculated using 1-second bins in cleaned event files. If a bin has >2000 counts, and if more than 50% of those come from <1% of pixels, then it is considered to be noise-dominated and hence unusable.
| Quadrant | # 1 sec bins | Bins with >0 counts | Bins with >2000 counts | High rate bins dominated by noise | Noise dominated (total time) | Noise dominated (detector-on time) | Marked lightcurve |
|---|---|---|---|---|---|---|---|
| A | 7379 | 5378 | 72 | 72 | 0.98% | 1.34% | 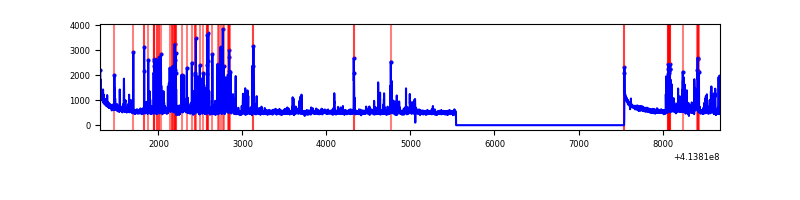 |
| B | 7379 | 5378 | 356 | 356 | 4.82% | 6.62% | 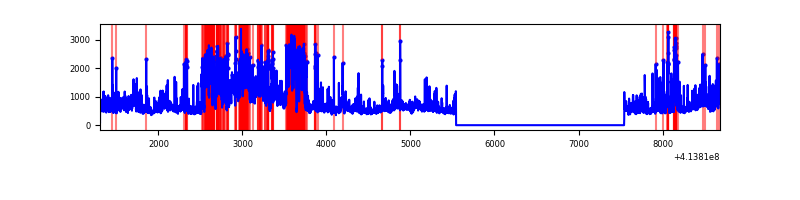 |
| C | 7379 | 5378 | 62 | 62 | 0.84% | 1.15% | 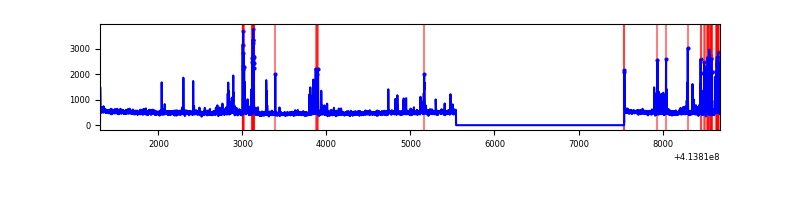 |
| D | 7379 | 5378 | 526 | 526 | 7.13% | 9.78% | 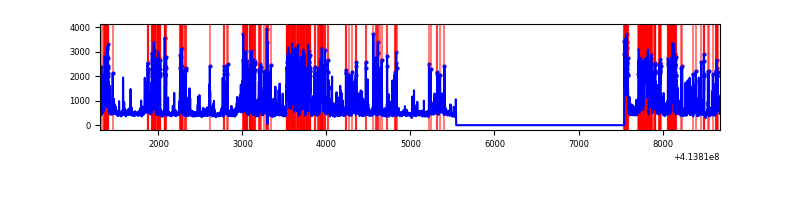 |
Top three noisy pixels from each quadrant. If the there are fewer than three noisy pixels in the level2.evt file, extra rows are filled as -1
| Pixel properties | Quadrant properties | ||||||
|---|---|---|---|---|---|---|---|
| Quadrant | DetID | PixID | Counts | Sigma | Mean | Median | Sigma |
| A | 10 | 83 | 530875 | 4302.58 | 599 | 587 | 123.2 |
| A | 6 | 10 | 205045 | 1658.91 | 599 | 587 | 123.2 |
| A | 14 | 250 | 188813 | 1527.2 | 599 | 587 | 123.2 |
| B | 4 | 171 | 774634 | 6862.13 | 583 | 567 | 112.8 |
| B | 4 | 170 | 418585 | 3705.75 | 583 | 567 | 112.8 |
| B | 0 | 183 | 395204 | 3498.47 | 583 | 567 | 112.8 |
| C | 14 | 254 | 237381 | 1743.08 | 584 | 586 | 135.8 |
| C | 15 | 214 | 230413 | 1691.79 | 584 | 586 | 135.8 |
| C | 9 | 187 | 132863 | 973.71 | 584 | 586 | 135.8 |
| D | 12 | 233 | 749478 | 5319.03 | 565 | 549 | 140.8 |
| D | 13 | 171 | 743961 | 5279.85 | 565 | 549 | 140.8 |
| D | 13 | 249 | 313024 | 2219.26 | 565 | 549 | 140.8 |
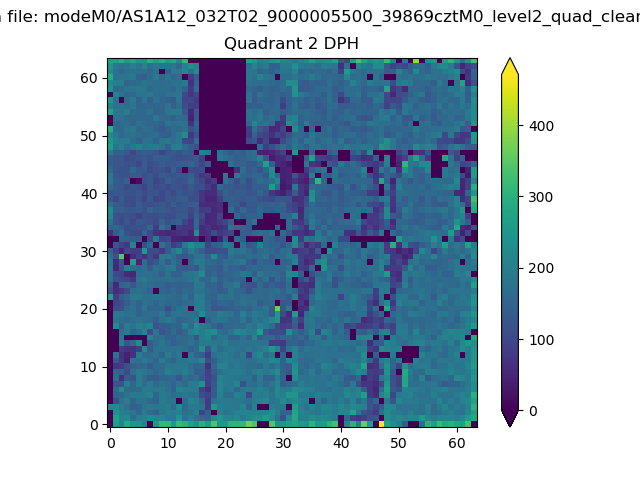
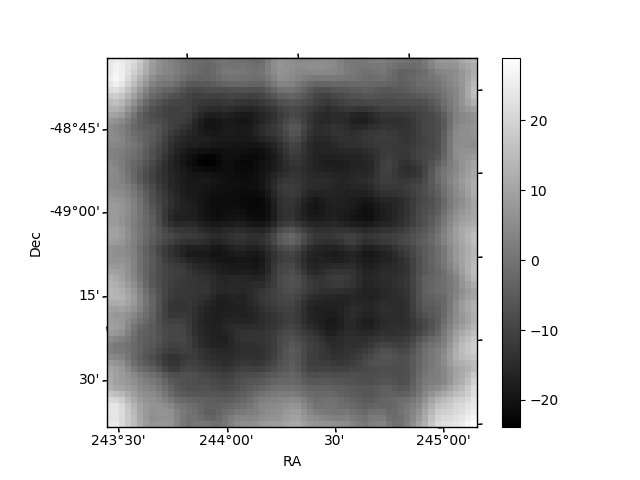
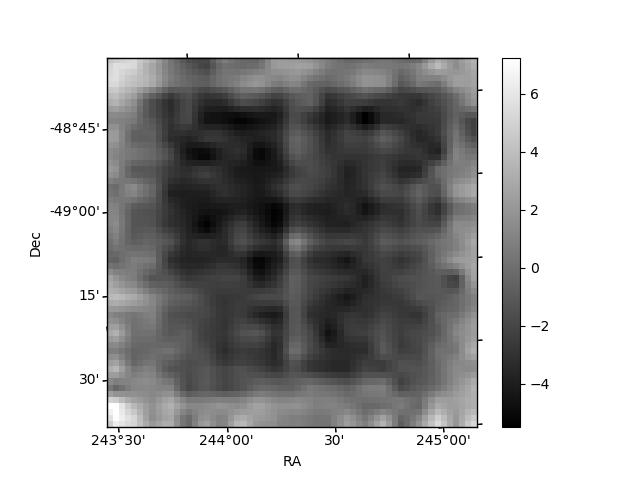
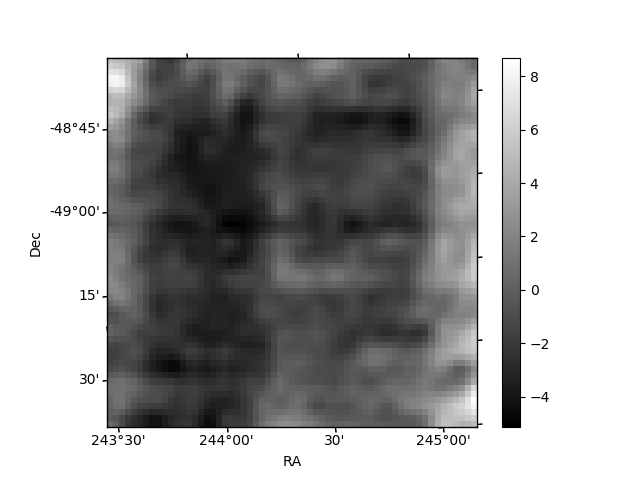
Histogram calculated using DETX and DETY for each event in the final _common_clean file
| Quadrant A | 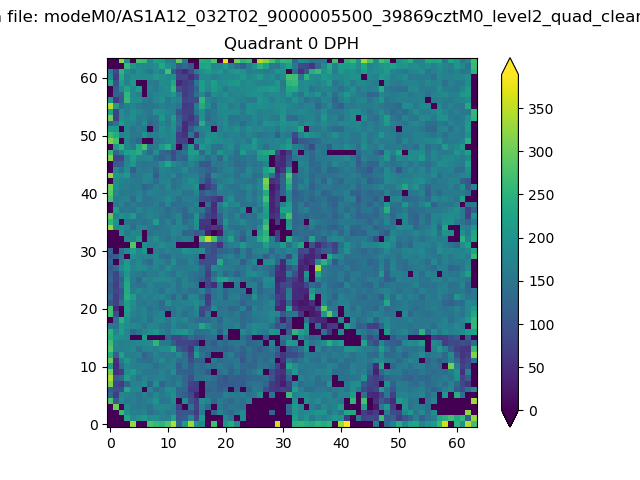 |
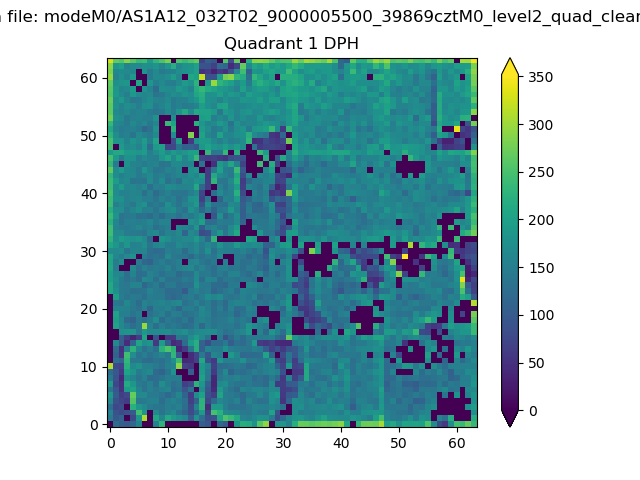 |
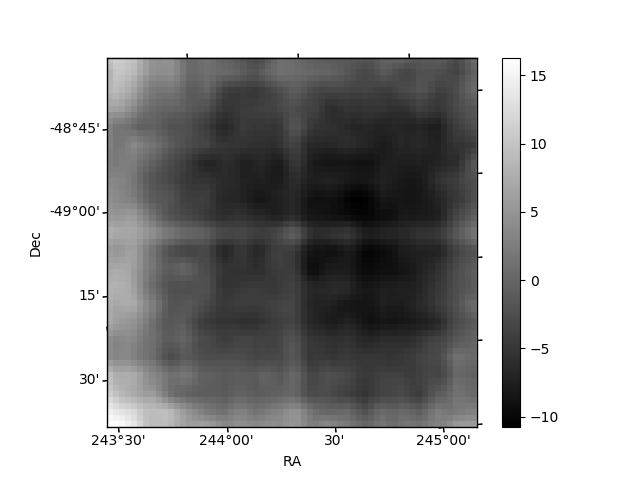
Quadrant B |
|---|---|---|---|
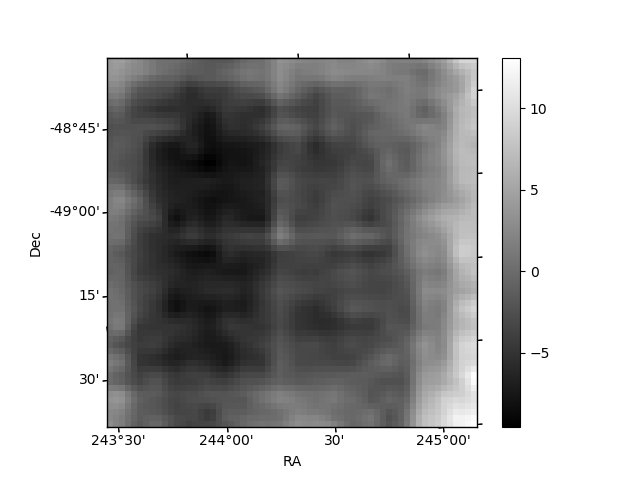
| Quadrant D | 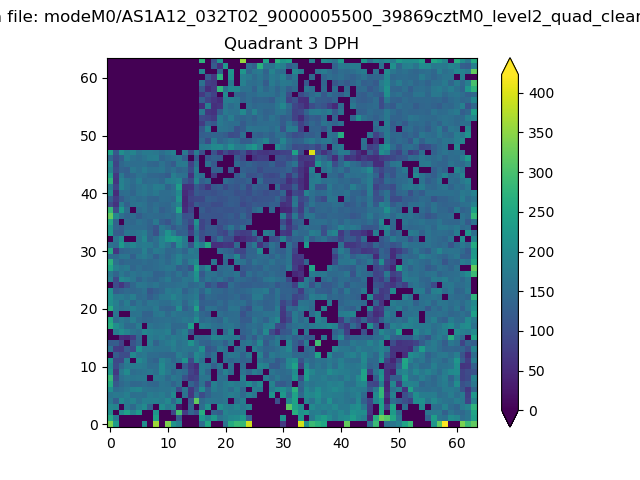 |
 |
Quadrant C |
| Plot type | Count rate plots | Images |
|---|---|---|
| Comparison with Poisson distribution Blue bars denote a histogram of data divided into 1 sec bins. Red curve is a Poisson curve with rate = median count rate of data. |
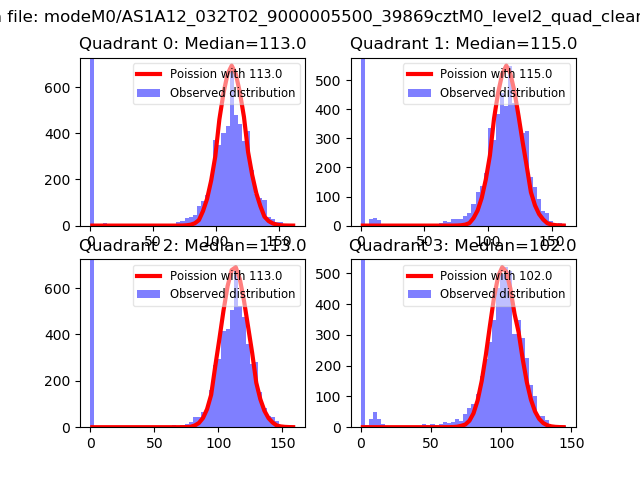 |
 |
| Quadrant-wise count rates Data is divided into 100 sec bins |
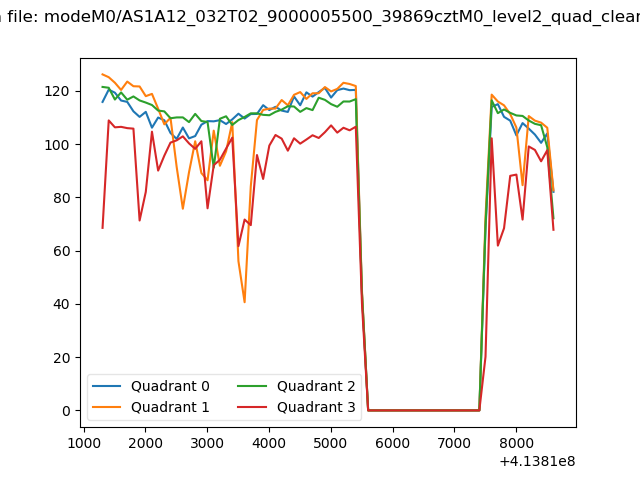 |
|
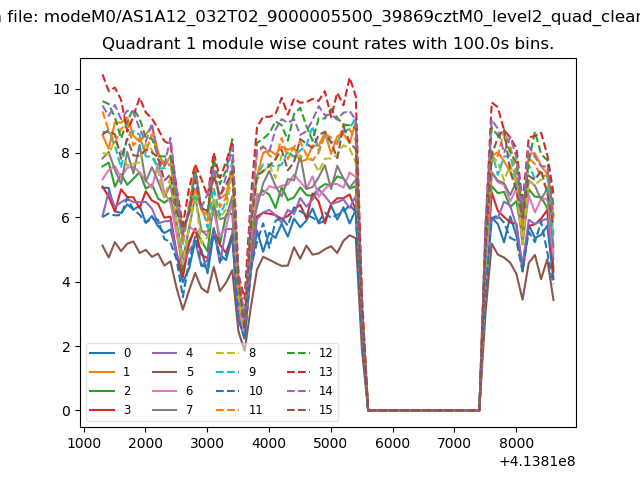
| Module-wise count rates for Quadrant A Data is divided into 100 sec bins |
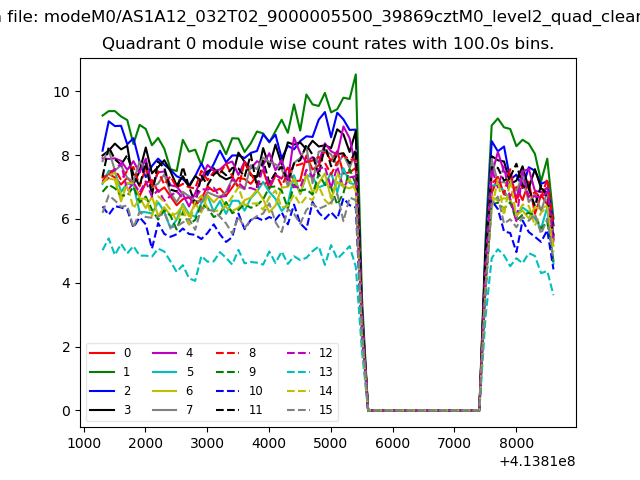 |
 |
| Module-wise count rates for Quadrant B Data is divided into 100 sec bins |
 |
 |
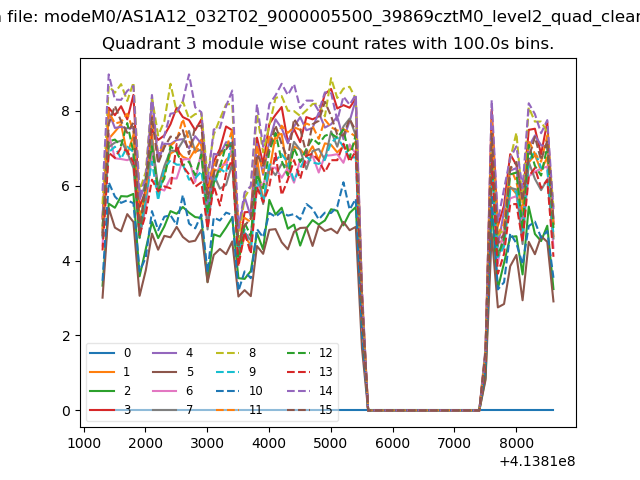
| Module-wise count rates for Quadrant C Data is divided into 100 sec bins |
 |
 |
| Module-wise count rates for Quadrant D Data is divided into 100 sec bins |
 |
 |
| Parameter | Plot |
|---|---|
| CZT HV Monitor | 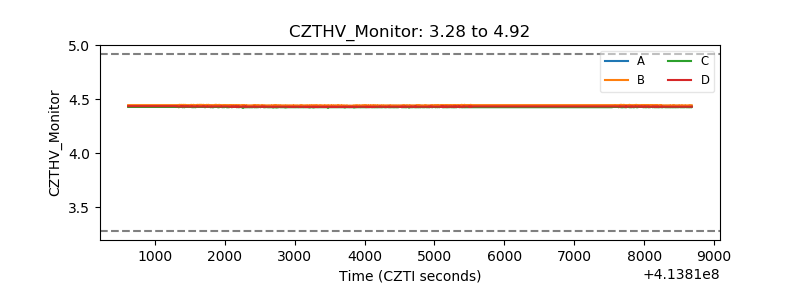 |
| D_VDD | 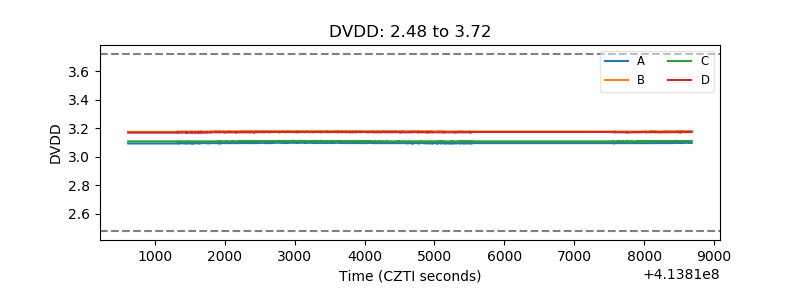 |
| Temperature 1 | 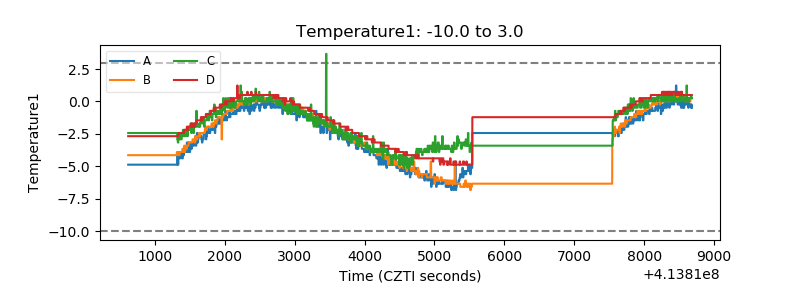 |
| Veto HV Monitor | 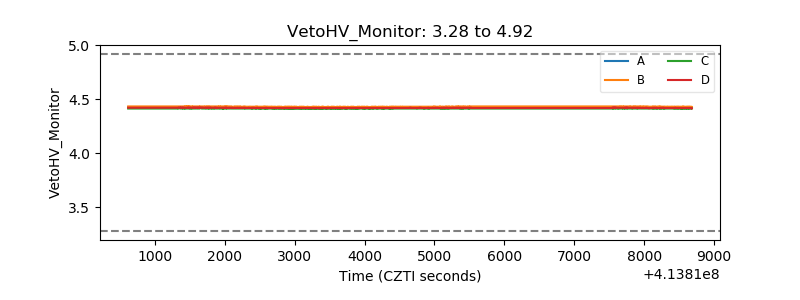 |
| Veto LLD |  |
| Alpha Counter | 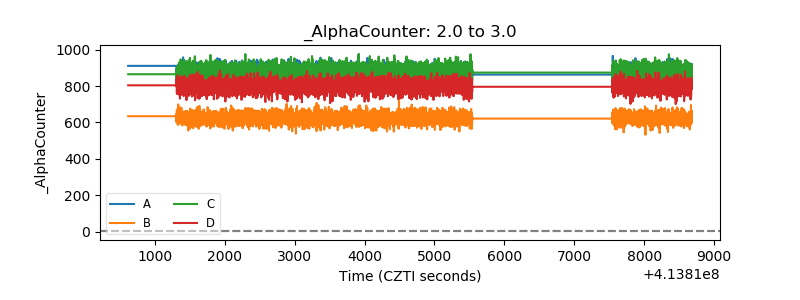 |
| _CPM_Rate | 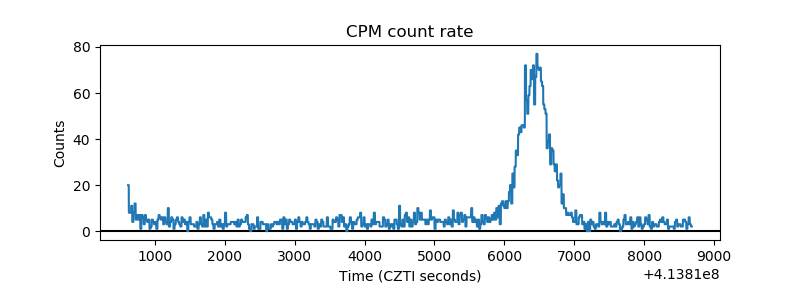 |
| CZT Counter | 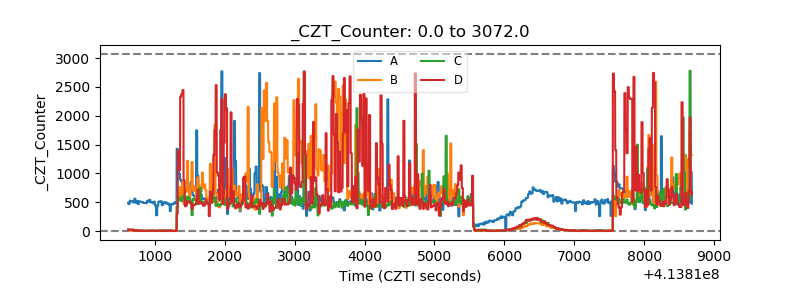 |
| +2.5 Volts monitor |  |
| +5 Volts monitor | 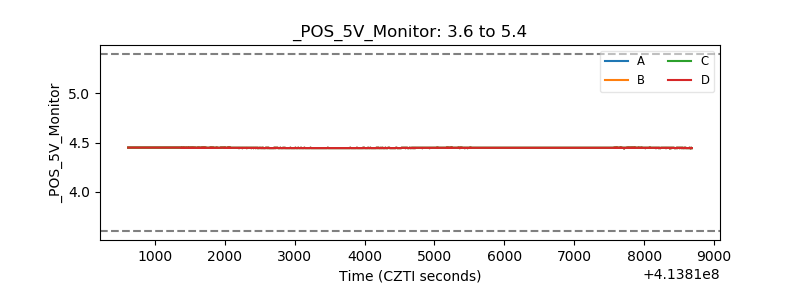 |
| _ROLL_ROT | 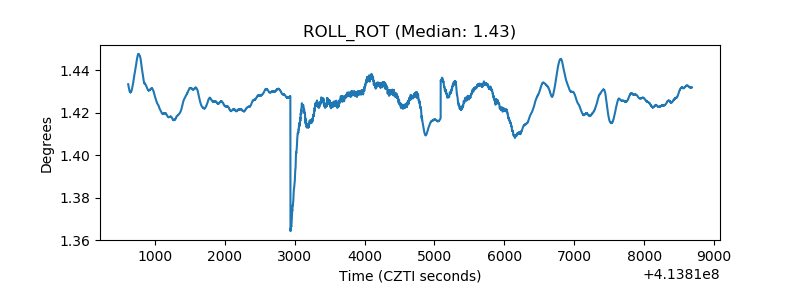 |
| _Roll_DEC | 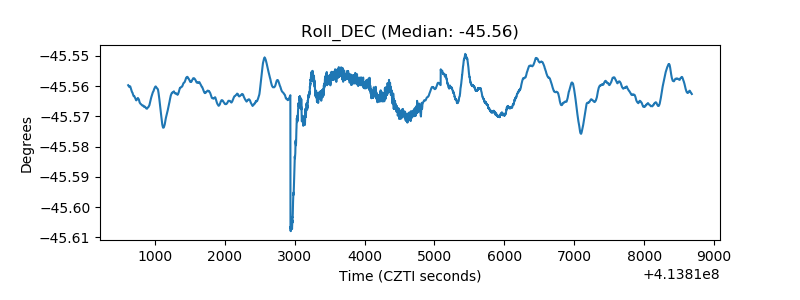 |
| _Roll_RA | 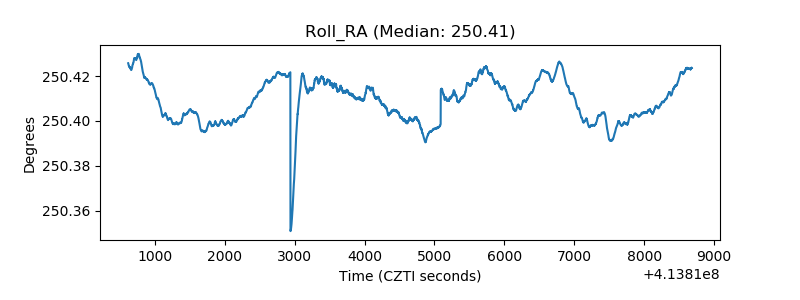 |
| Veto Counter | 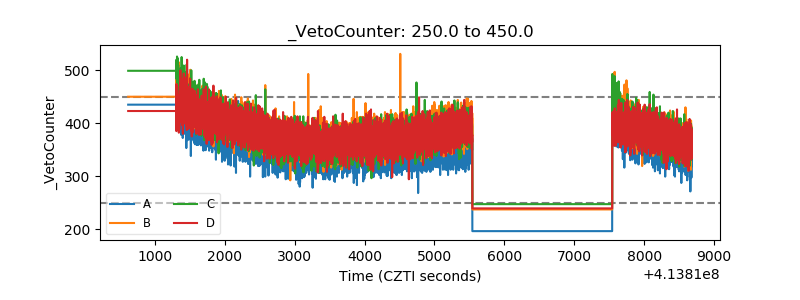 |