| Param | Original file | Final file |
|---|---|---|
| Filename | modeM0/AS1A12_032T02_9000005500_39870cztM0_level2.fits | modeM0/AS1A12_032T02_9000005500_39870cztM0_level2_quad_clean.evt |
| Size (bytes) | 494,760,960 | 89,078,400 |
| Size | 471.8 MB | 85.0 MB |
| Events in quadrant A | 4,401,370 | 573,779 |
| Events in quadrant B | 5,513,734 | 583,377 |
| Events in quadrant C | 3,574,295 | 604,159 |
| Events in quadrant D | 4,386,036 | 540,307 |
| Mode M9 | |||
|---|---|---|---|
| Quadrant | BADHDUFLAG | Total packets | Discarded packets |
| A | 0 | 24 | 0 |
| B | 0 | 24 | 0 |
| C | 0 | 24 | 0 |
| D | 0 | 25 | 0 |
| Mode SS | |||
|---|---|---|---|
| Quadrant | BADHDUFLAG | Total packets | Discarded packets |
| A | 0 | 114 | 0 |
| B | 0 | 114 | 0 |
| C | 0 | 114 | 0 |
| D | 0 | 114 | 0 |
| Mode M0 | |||
|---|---|---|---|
| Quadrant | BADHDUFLAG | Total packets | Discarded packets |
| A | 0 | 16587 | 3 |
| B | 0 | 20211 | 2 |
| C | 0 | 14138 | 2 |
| D | 0 | 16932 | 2 |
| Quadrant | Total seconds | Saturated seconds | Saturation percentage |
|---|---|---|---|
| A | 5655 | 522 | 9.230769% |
| B | 5655 | 616 | 10.893015% |
| C | 5655 | 188 | 3.324492% |
| D | 5655 | 415 | 7.338638% |
Noise dominated data is calculated using 1-second bins in cleaned event files. If a bin has >2000 counts, and if more than 50% of those come from <1% of pixels, then it is considered to be noise-dominated and hence unusable.
| Quadrant | # 1 sec bins | Bins with >0 counts | Bins with >2000 counts | High rate bins dominated by noise | Noise dominated (total time) | Noise dominated (detector-on time) | Marked lightcurve |
|---|---|---|---|---|---|---|---|
| A | 7357 | 5655 | 420 | 420 | 5.71% | 7.43% | 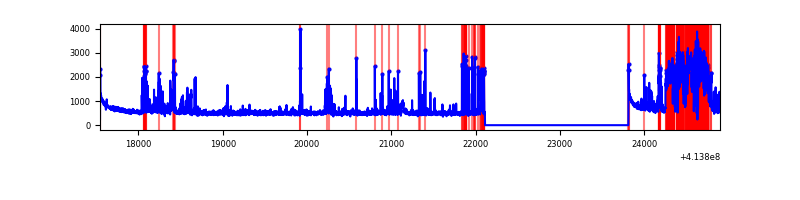 |
| B | 7357 | 5655 | 453 | 453 | 6.16% | 8.01% | 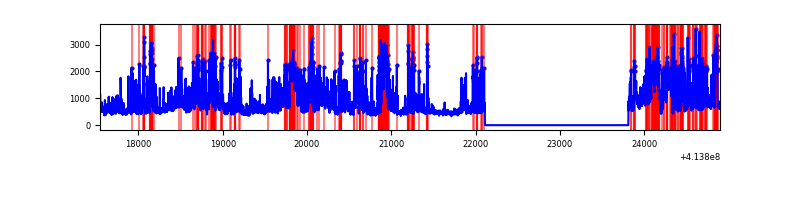 |
| C | 7357 | 5655 | 181 | 181 | 2.46% | 3.20% | 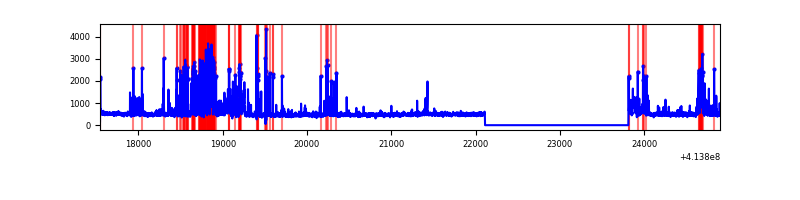 |
| D | 7357 | 5655 | 385 | 385 | 5.23% | 6.81% | 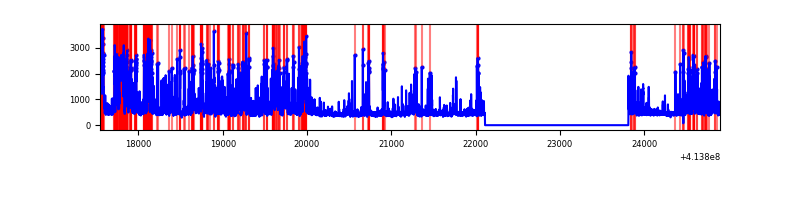 |
Top three noisy pixels from each quadrant. If the there are fewer than three noisy pixels in the level2.evt file, extra rows are filled as -1
| Pixel properties | Quadrant properties | ||||||
|---|---|---|---|---|---|---|---|
| Quadrant | DetID | PixID | Counts | Sigma | Mean | Median | Sigma |
| A | 14 | 250 | 1065188 | 8756.11 | 589 | 577 | 121.6 |
| A | 10 | 83 | 544124 | 4470.51 | 589 | 577 | 121.6 |
| A | 13 | 248 | 251277 | 2061.93 | 589 | 577 | 121.6 |
| B | 4 | 171 | 743893 | 6450.01 | 596 | 578 | 115.2 |
| B | 0 | 183 | 716846 | 6215.31 | 596 | 578 | 115.2 |
| B | 15 | 32 | 366672 | 3176.73 | 596 | 578 | 115.2 |
| C | 9 | 187 | 649409 | 4632.31 | 598 | 601 | 140.1 |
| C | 15 | 214 | 241698 | 1721.36 | 598 | 601 | 140.1 |
| C | 14 | 254 | 199726 | 1421.7 | 598 | 601 | 140.1 |
| D | 13 | 171 | 731954 | 5003.81 | 592 | 575 | 146.2 |
| D | 12 | 233 | 699856 | 4784.2 | 592 | 575 | 146.2 |
| D | 2 | 250 | 199904 | 1363.73 | 592 | 575 | 146.2 |
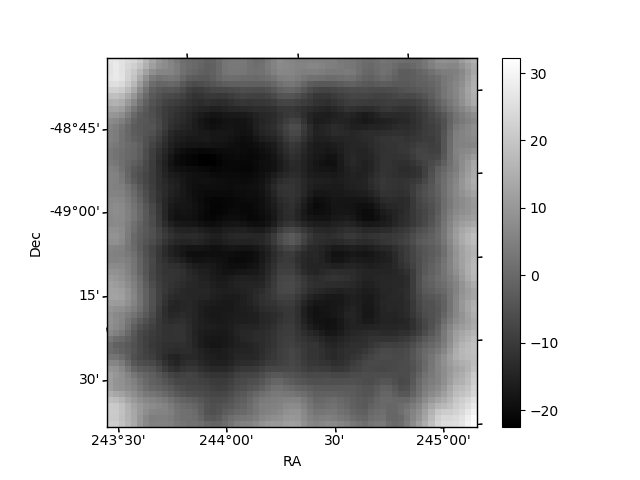
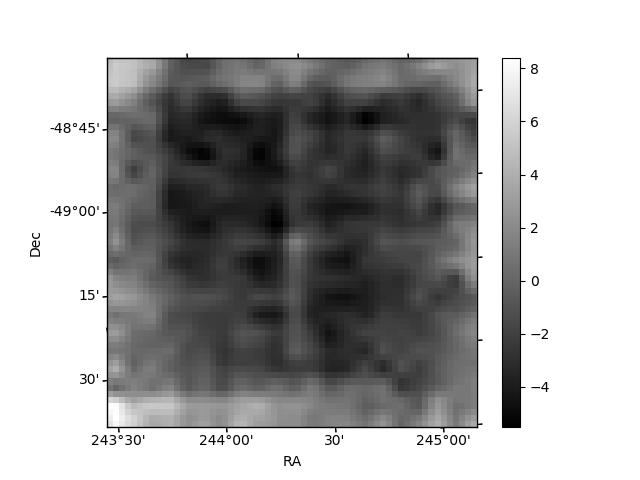
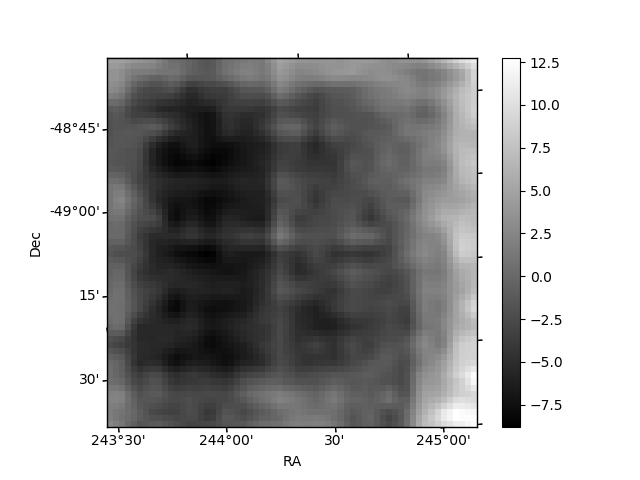
Histogram calculated using DETX and DETY for each event in the final _common_clean file
| Quadrant A | 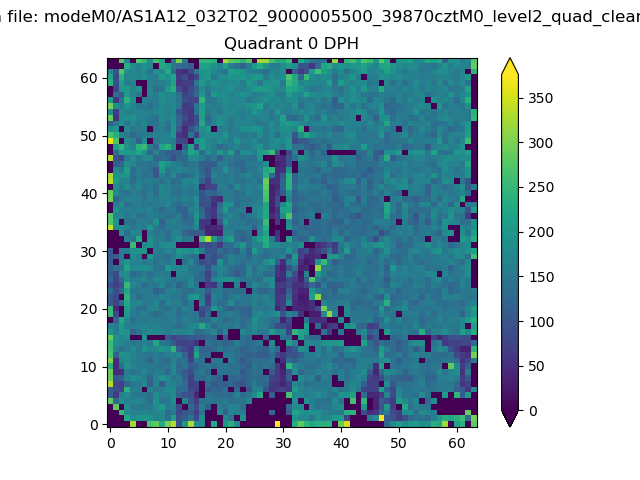 |
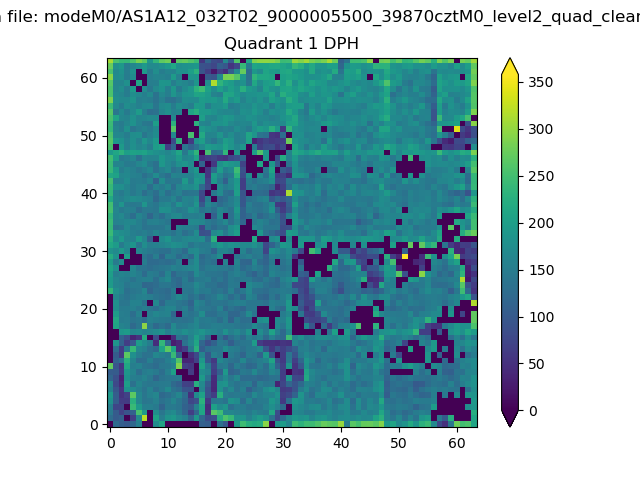 |
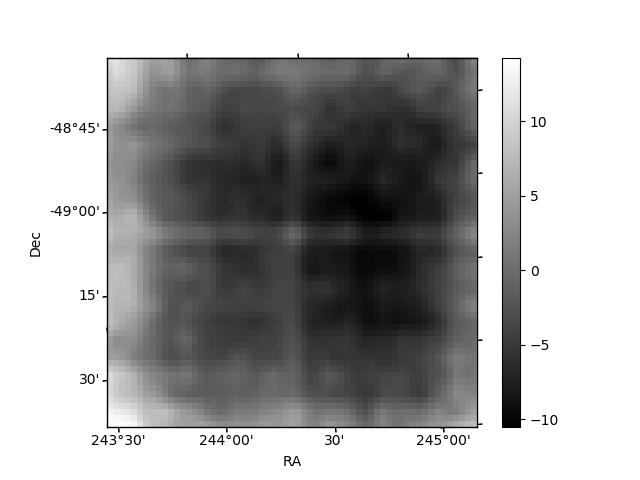
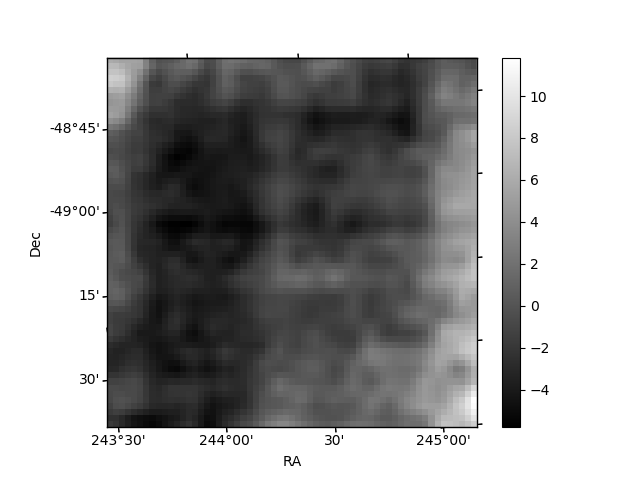
Quadrant B |
|---|---|---|---|
| Quadrant D | 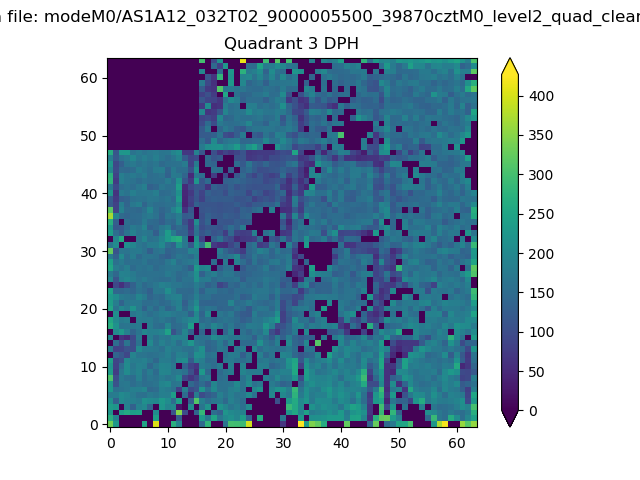 |
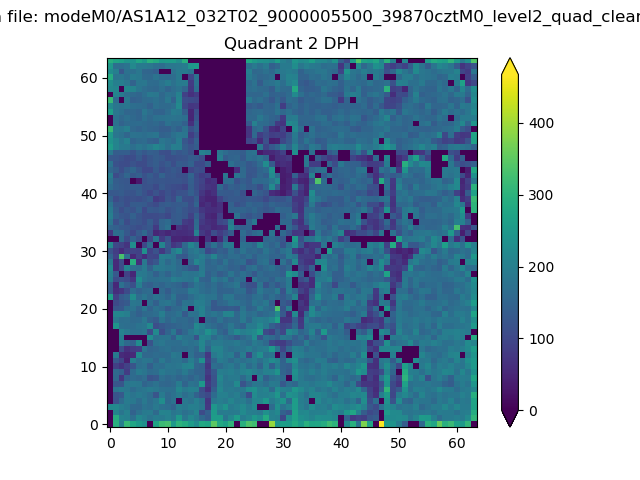 |
Quadrant C |
| Plot type | Count rate plots | Images |
|---|---|---|
| Comparison with Poisson distribution Blue bars denote a histogram of data divided into 1 sec bins. Red curve is a Poisson curve with rate = median count rate of data. |
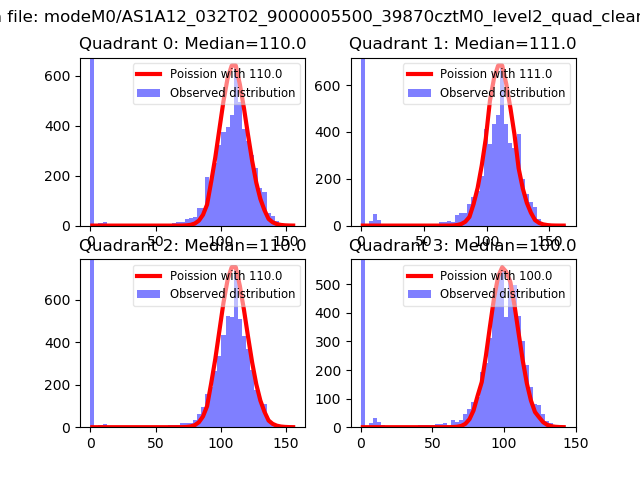 |
 |
| Quadrant-wise count rates Data is divided into 100 sec bins |
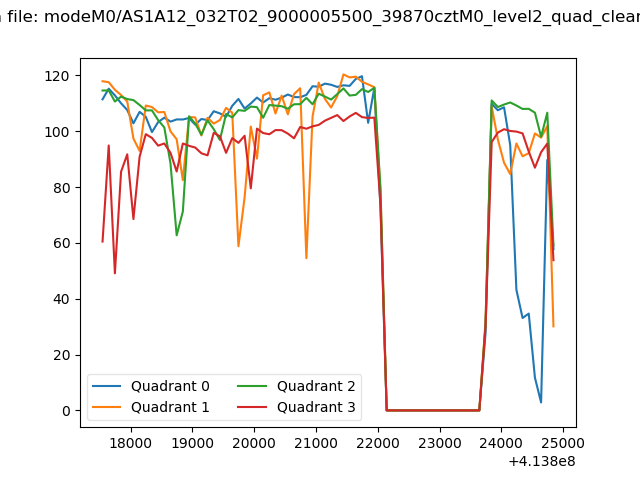 |
|
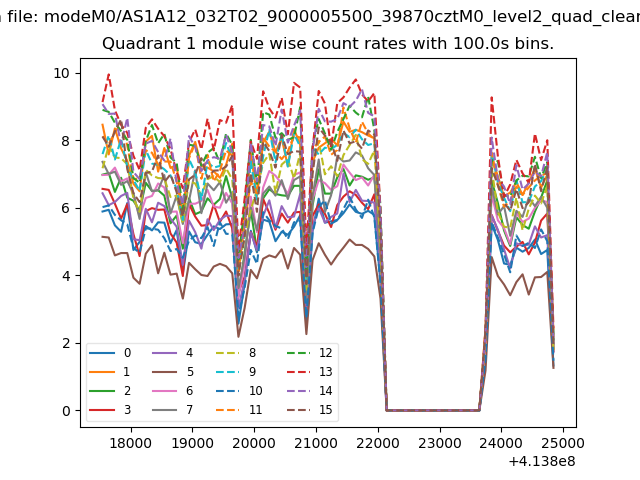
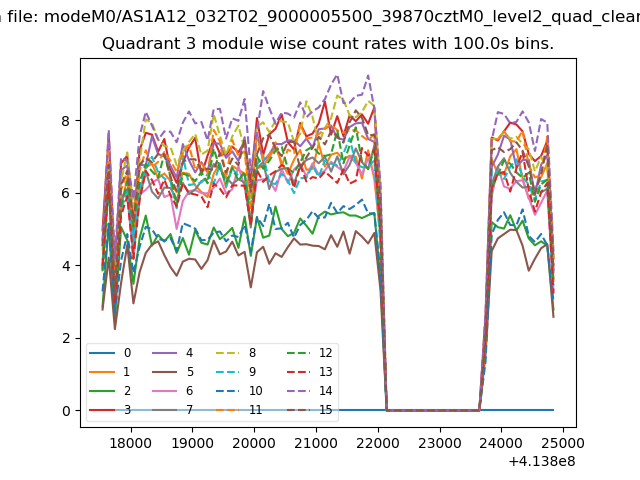
| Module-wise count rates for Quadrant A Data is divided into 100 sec bins |
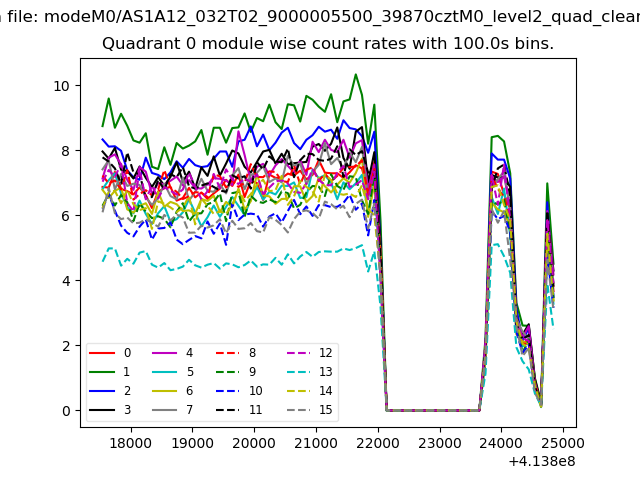 |
 |
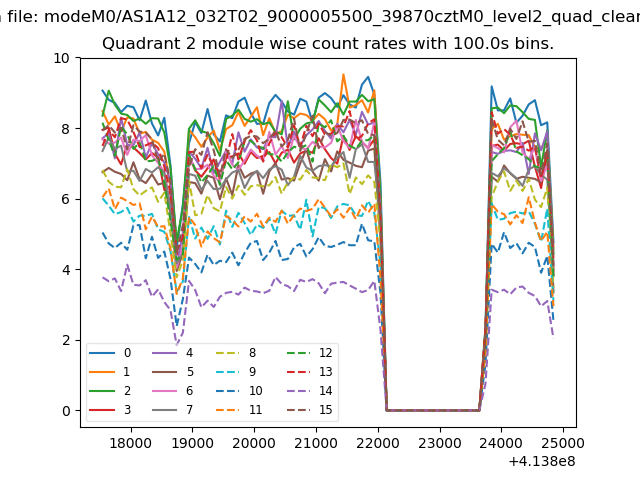
| Module-wise count rates for Quadrant B Data is divided into 100 sec bins |
 |
 |
| Module-wise count rates for Quadrant C Data is divided into 100 sec bins |
 |
 |
| Module-wise count rates for Quadrant D Data is divided into 100 sec bins |
 |
 |
| Parameter | Plot |
|---|---|
| CZT HV Monitor | 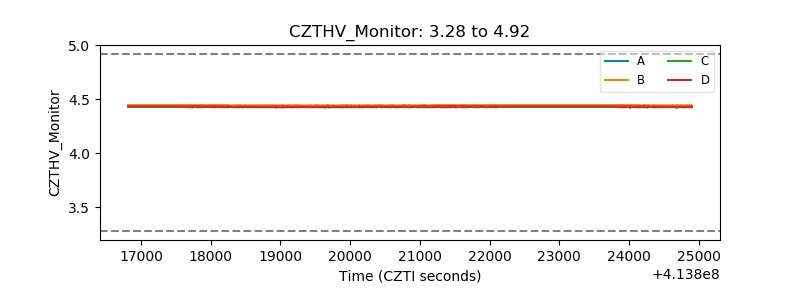 |
| D_VDD | 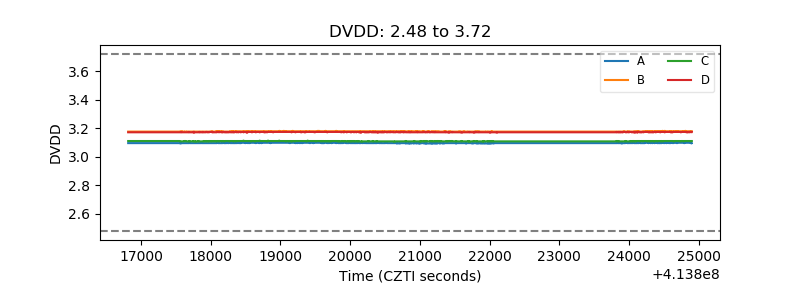 |
| Temperature 1 |  |
| Veto HV Monitor | 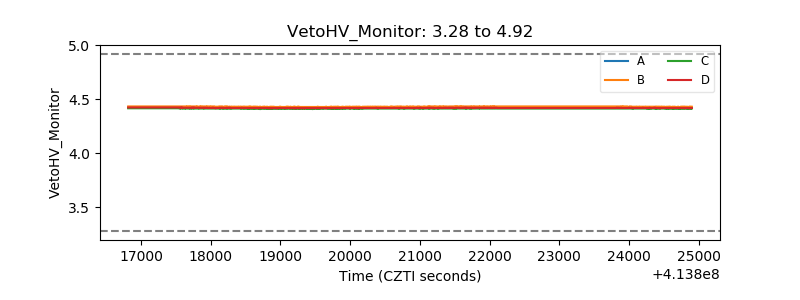 |
| Veto LLD | 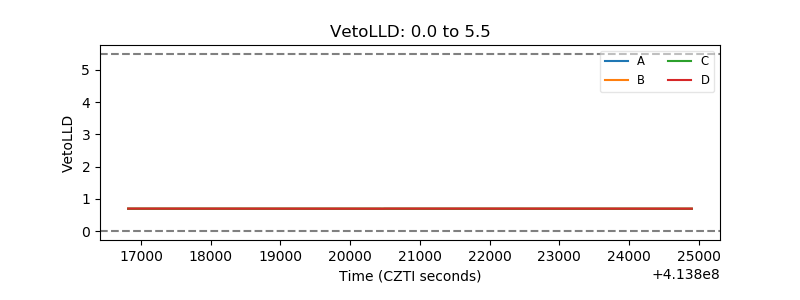 |
| Alpha Counter | 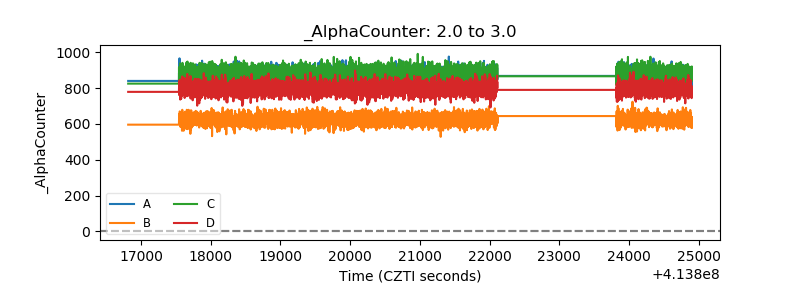 |
| _CPM_Rate | 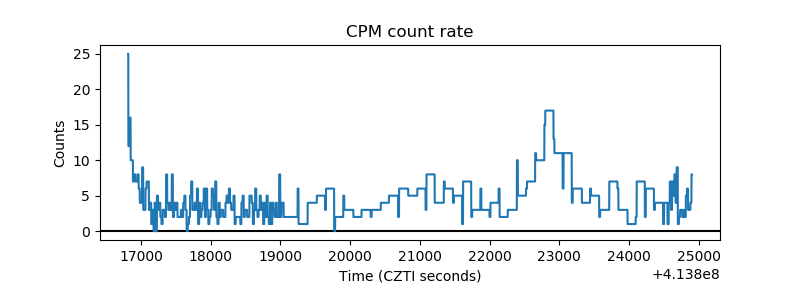 |
| CZT Counter | 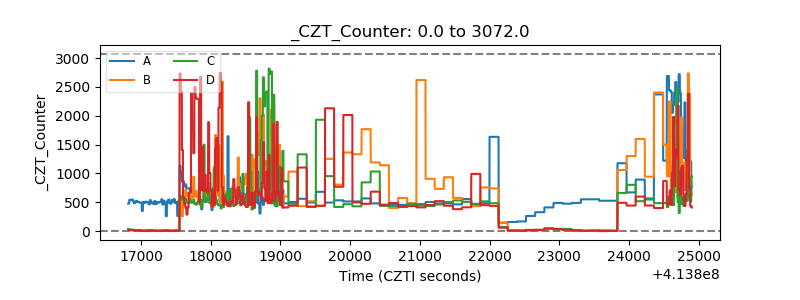 |
| +2.5 Volts monitor | 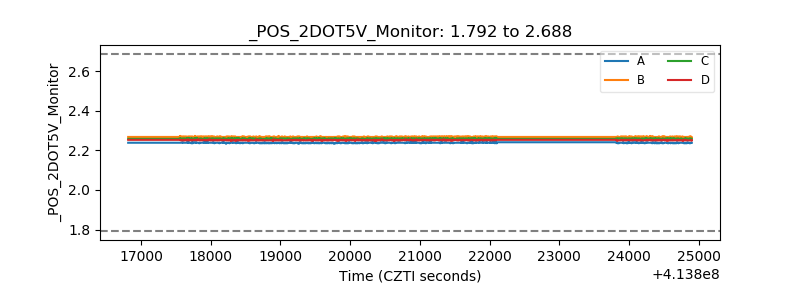 |
| +5 Volts monitor | 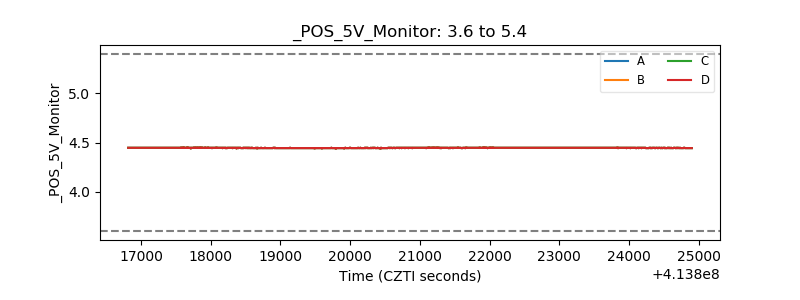 |
| _ROLL_ROT | 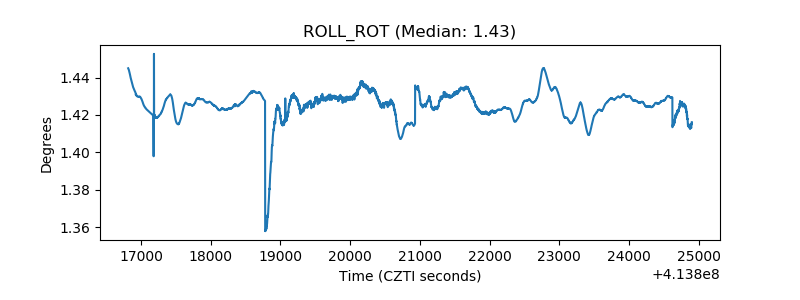 |
| _Roll_DEC | 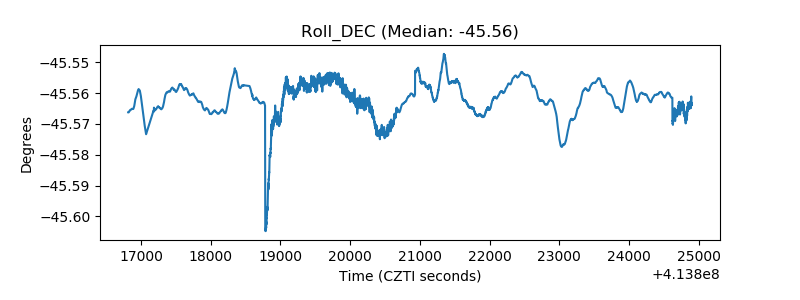 |
| _Roll_RA | 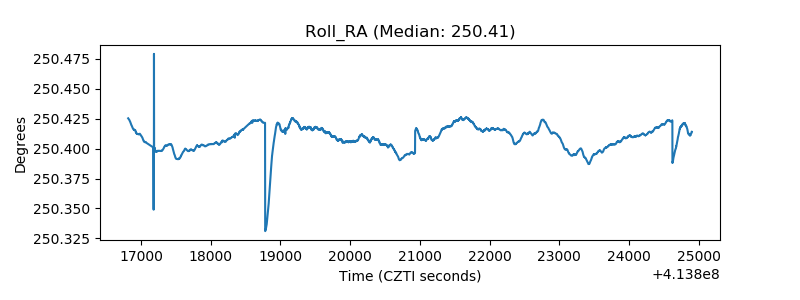 |
| Veto Counter | 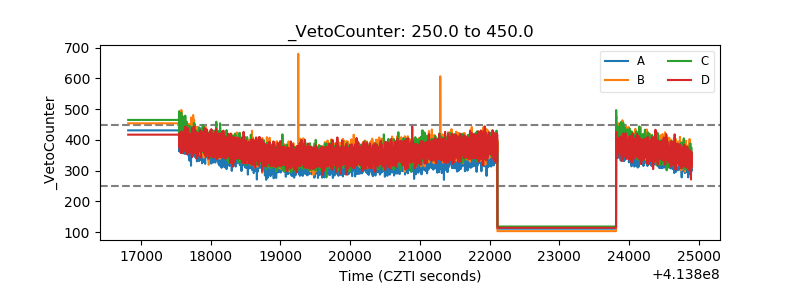 |