| Param | Original file | Final file |
|---|---|---|
| Filename | modeM0/AS1A12_032T02_9000005500_39871cztM0_level2.fits | modeM0/AS1A12_032T02_9000005500_39871cztM0_level2_quad_clean.evt |
| Size (bytes) | 426,864,960 | 90,489,600 |
| Size | 407.1 MB | 86.3 MB |
| Events in quadrant A | 4,419,386 | 563,052 |
| Events in quadrant B | 4,302,459 | 609,136 |
| Events in quadrant C | 3,028,631 | 613,116 |
| Events in quadrant D | 3,610,273 | 558,068 |
| Mode M9 | |||
|---|---|---|---|
| Quadrant | BADHDUFLAG | Total packets | Discarded packets |
| A | 0 | 14 | 0 |
| B | 0 | 14 | 0 |
| C | 0 | 14 | 0 |
| D | 0 | 14 | 0 |
| Mode SS | |||
|---|---|---|---|
| Quadrant | BADHDUFLAG | Total packets | Discarded packets |
| A | 0 | 116 | 0 |
| B | 0 | 116 | 0 |
| C | 0 | 116 | 0 |
| D | 0 | 116 | 0 |
| Mode M0 | |||
|---|---|---|---|
| Quadrant | BADHDUFLAG | Total packets | Discarded packets |
| A | 0 | 16674 | 2 |
| B | 0 | 16658 | 1 |
| C | 0 | 12518 | 1 |
| D | 0 | 14637 | 1 |
| Quadrant | Total seconds | Saturated seconds | Saturation percentage |
|---|---|---|---|
| A | 5665 | 552 | 9.744042% |
| B | 5665 | 303 | 5.348632% |
| C | 5665 | 41 | 0.723742% |
| D | 5665 | 164 | 2.894969% |
Noise dominated data is calculated using 1-second bins in cleaned event files. If a bin has >2000 counts, and if more than 50% of those come from <1% of pixels, then it is considered to be noise-dominated and hence unusable.
| Quadrant | # 1 sec bins | Bins with >0 counts | Bins with >2000 counts | High rate bins dominated by noise | Noise dominated (total time) | Noise dominated (detector-on time) | Marked lightcurve |
|---|---|---|---|---|---|---|---|
| A | 7068 | 5666 | 449 | 449 | 6.35% | 7.92% | 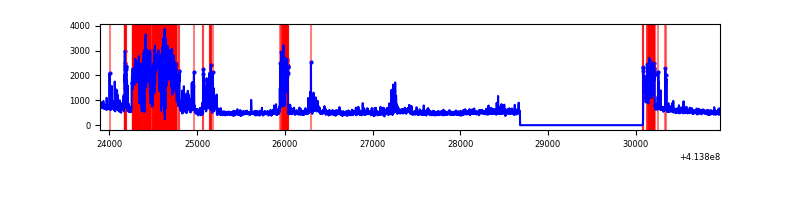 |
| B | 7068 | 5666 | 201 | 201 | 2.84% | 3.55% | 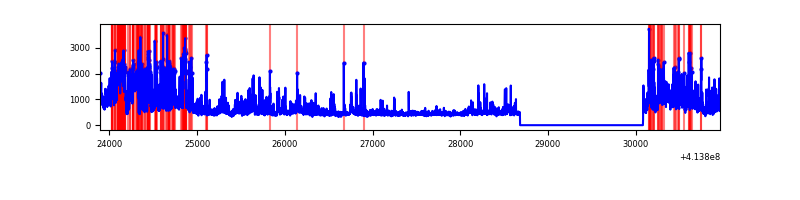 |
| C | 7068 | 5666 | 38 | 38 | 0.54% | 0.67% | 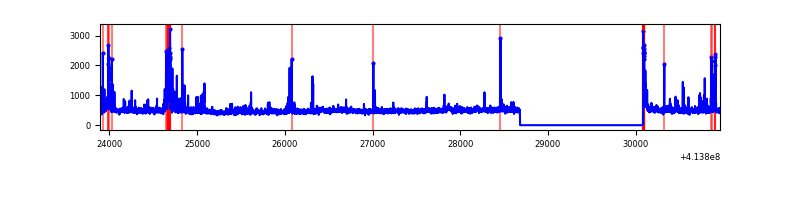 |
| D | 7068 | 5666 | 157 | 157 | 2.22% | 2.77% | 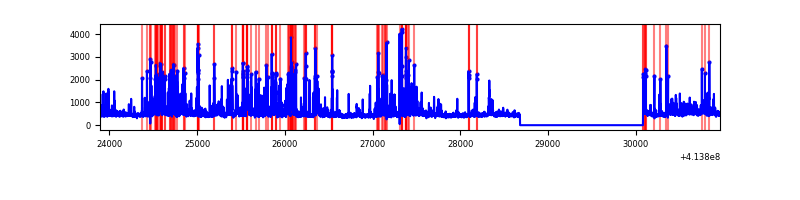 |
Top three noisy pixels from each quadrant. If the there are fewer than three noisy pixels in the level2.evt file, extra rows are filled as -1
| Pixel properties | Quadrant properties | ||||||
|---|---|---|---|---|---|---|---|
| Quadrant | DetID | PixID | Counts | Sigma | Mean | Median | Sigma |
| A | 14 | 250 | 960391 | 7914.22 | 587 | 574 | 121.3 |
| A | 10 | 83 | 497461 | 4097.11 | 587 | 574 | 121.3 |
| A | 13 | 248 | 463126 | 3814.0 | 587 | 574 | 121.3 |
| B | 15 | 32 | 358659 | 3084.11 | 606 | 591 | 116.1 |
| B | 0 | 183 | 352096 | 3027.58 | 606 | 591 | 116.1 |
| B | 4 | 141 | 259966 | 2234.05 | 606 | 591 | 116.1 |
| C | 15 | 214 | 239420 | 1680.58 | 603 | 605 | 142.1 |
| C | 9 | 187 | 225607 | 1583.38 | 603 | 605 | 142.1 |
| C | 14 | 254 | 139222 | 975.47 | 603 | 605 | 142.1 |
| D | 13 | 171 | 471096 | 3189.84 | 599 | 581 | 147.5 |
| D | 13 | 249 | 136916 | 924.28 | 599 | 581 | 147.5 |
| D | 2 | 153 | 110168 | 742.94 | 599 | 581 | 147.5 |
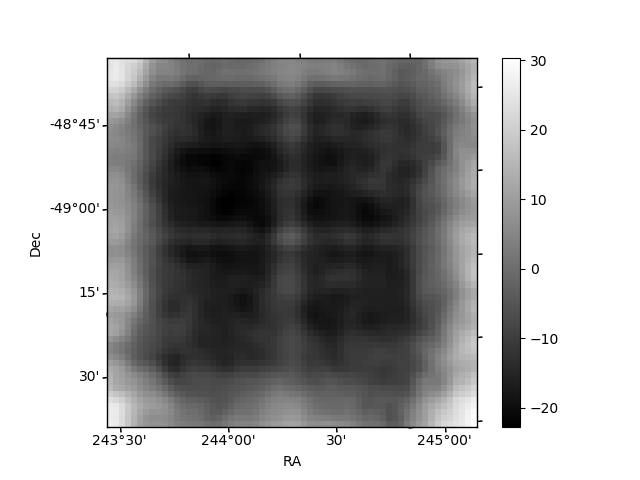
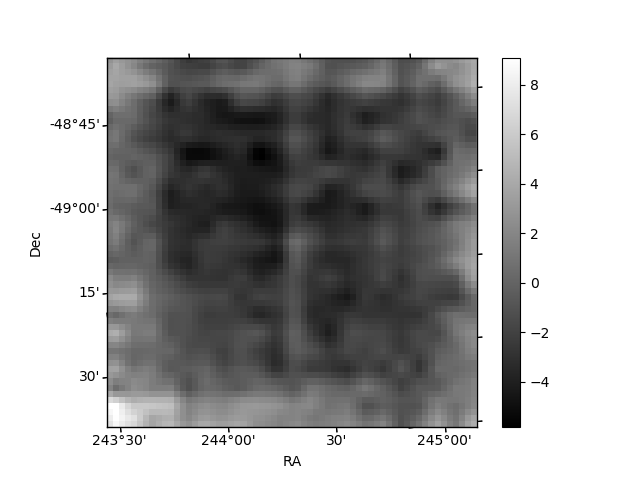
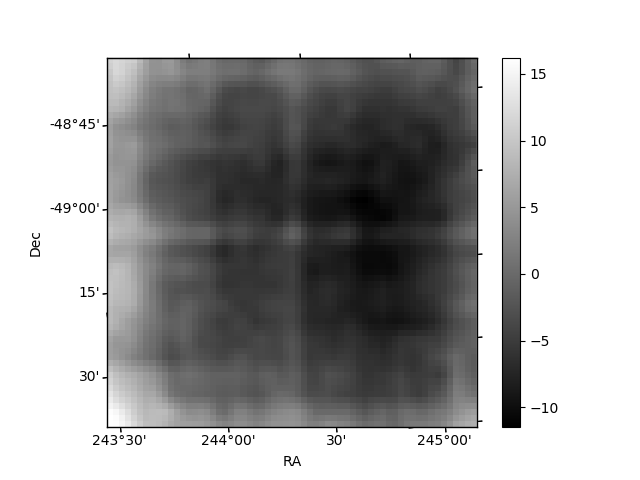
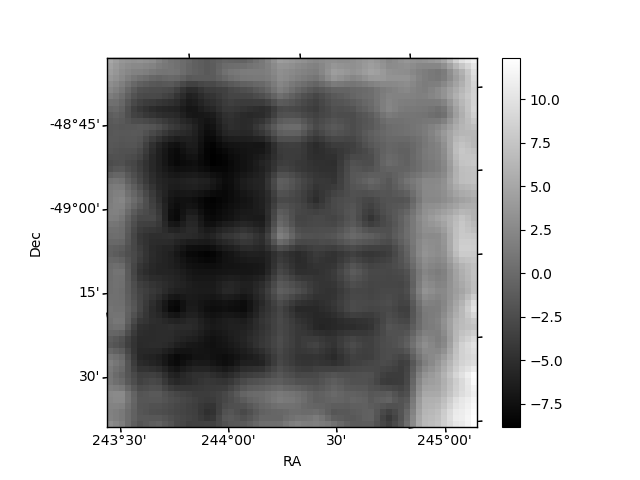
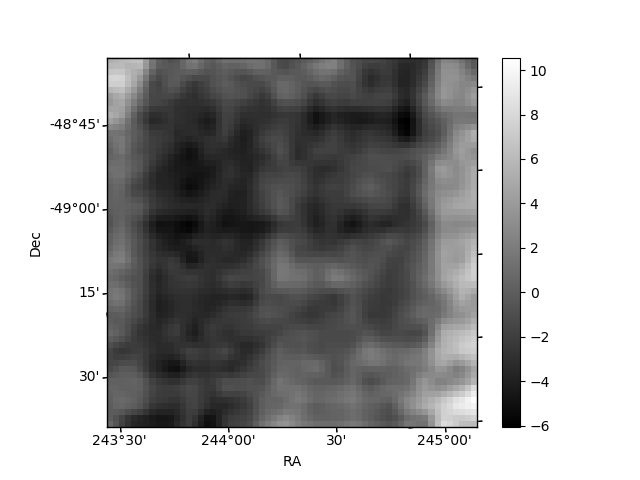
Histogram calculated using DETX and DETY for each event in the final _common_clean file
| Quadrant A | 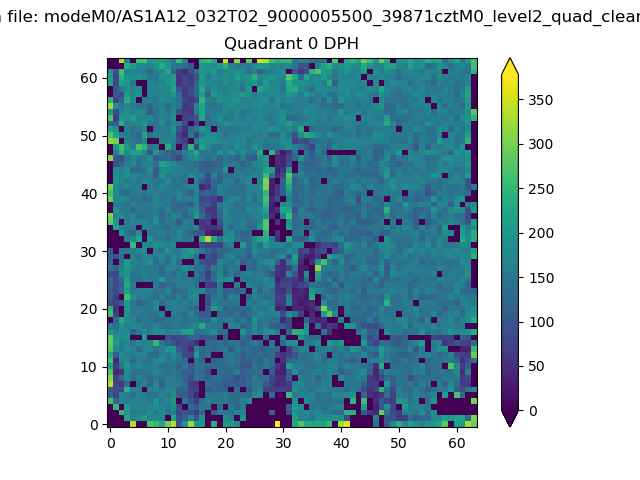 |
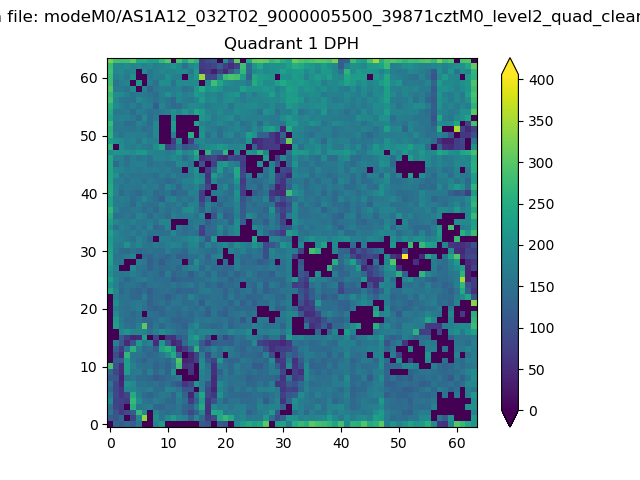 |
Quadrant B |
|---|---|---|---|
| Quadrant D | 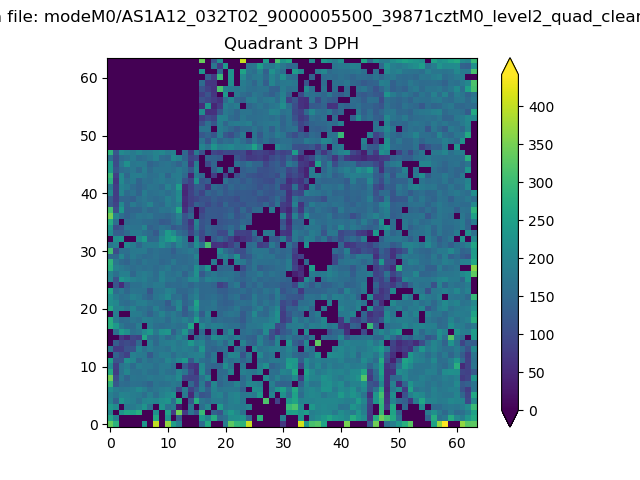 |
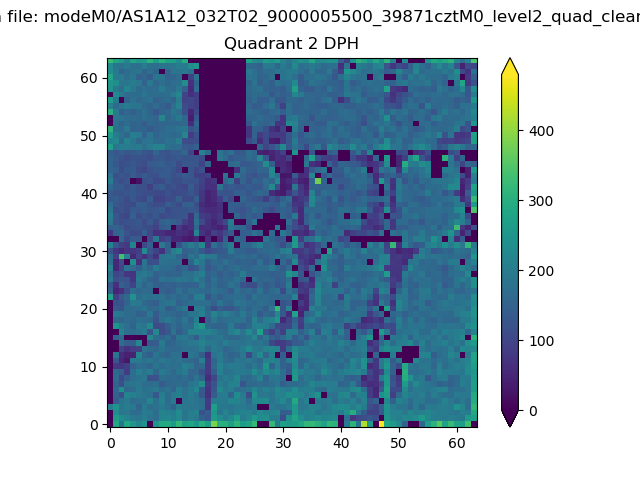 |
Quadrant C |
| Plot type | Count rate plots | Images |
|---|---|---|
| Comparison with Poisson distribution Blue bars denote a histogram of data divided into 1 sec bins. Red curve is a Poisson curve with rate = median count rate of data. |
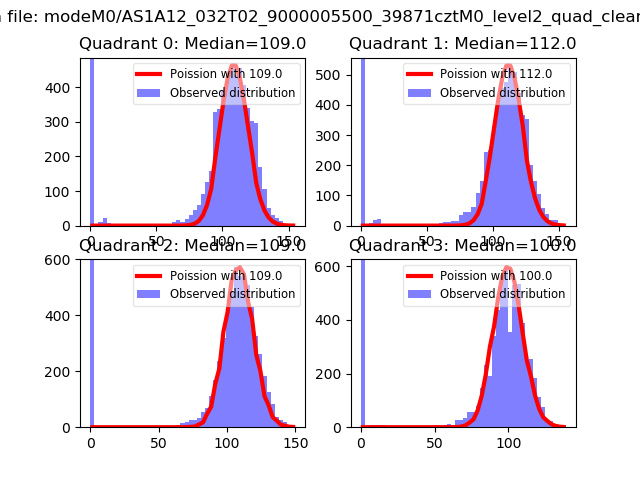 |
 |
| Quadrant-wise count rates Data is divided into 100 sec bins |
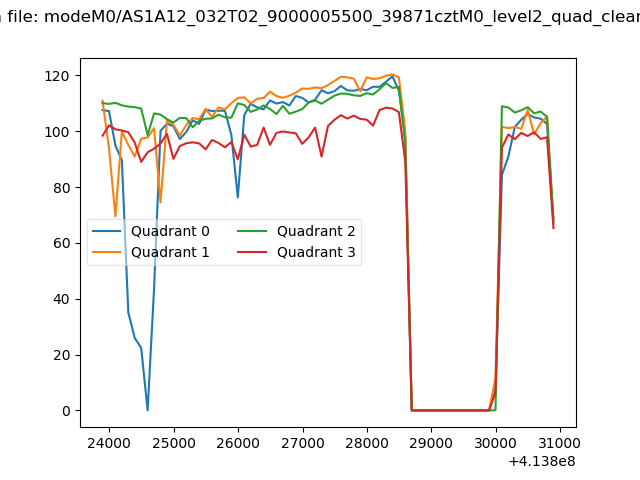 |
|
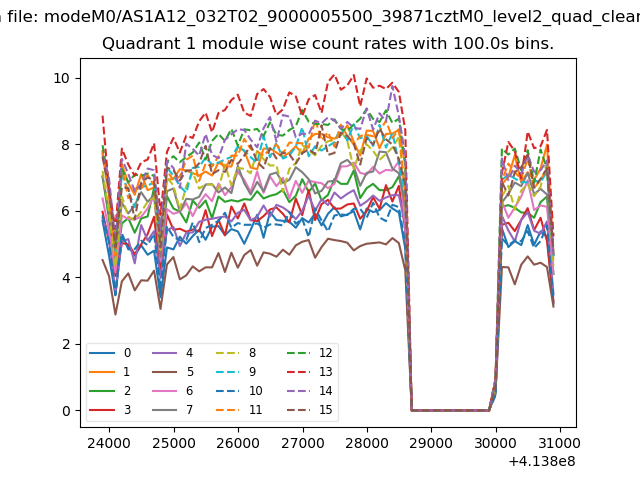
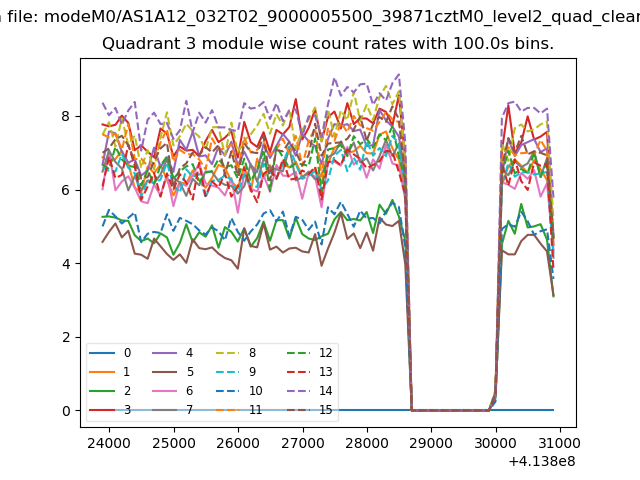
| Module-wise count rates for Quadrant A Data is divided into 100 sec bins |
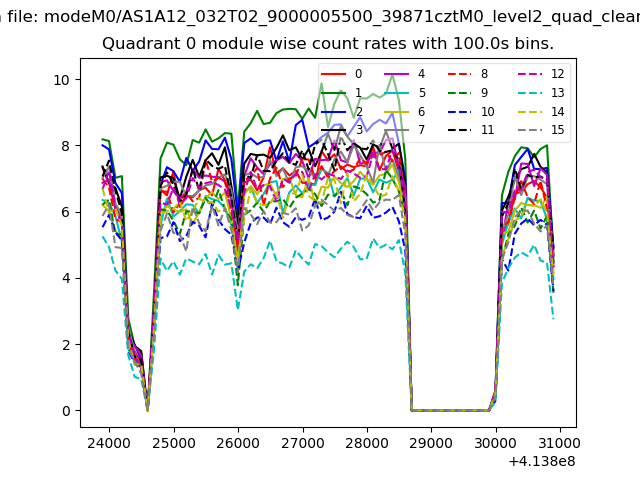 |
 |
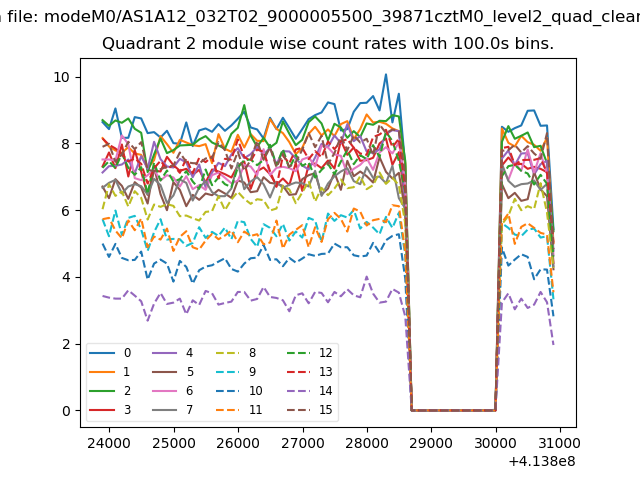
| Module-wise count rates for Quadrant B Data is divided into 100 sec bins |
 |
 |
| Module-wise count rates for Quadrant C Data is divided into 100 sec bins |
 |
 |
| Module-wise count rates for Quadrant D Data is divided into 100 sec bins |
 |
 |
| Parameter | Plot |
|---|---|
| CZT HV Monitor |  |
| D_VDD | 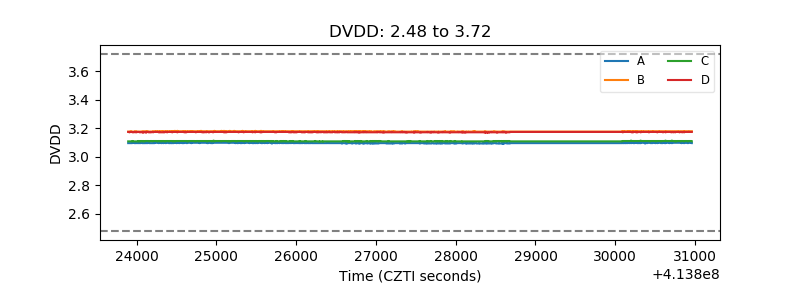 |
| Temperature 1 | 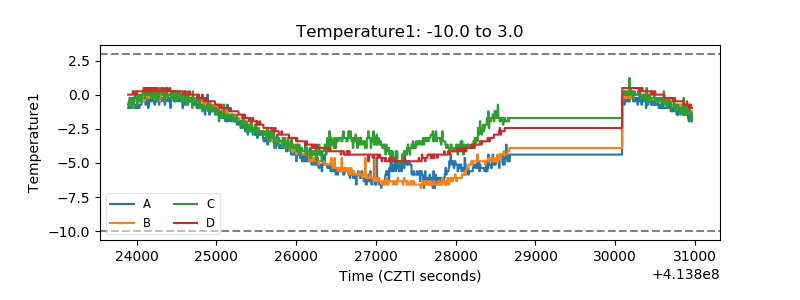 |
| Veto HV Monitor | 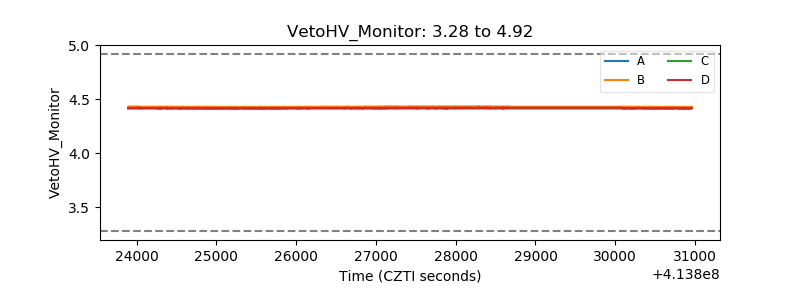 |
| Veto LLD | 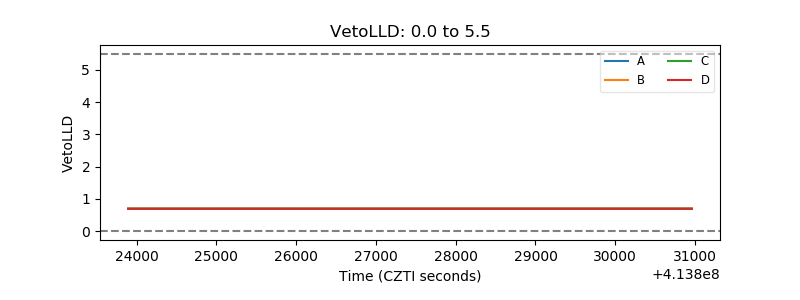 |
| Alpha Counter | 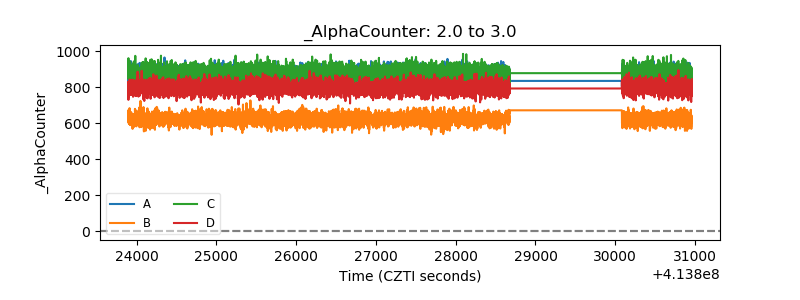 |
| _CPM_Rate | 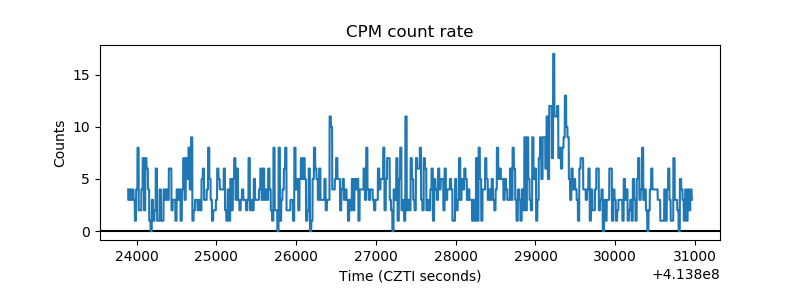 |
| CZT Counter | 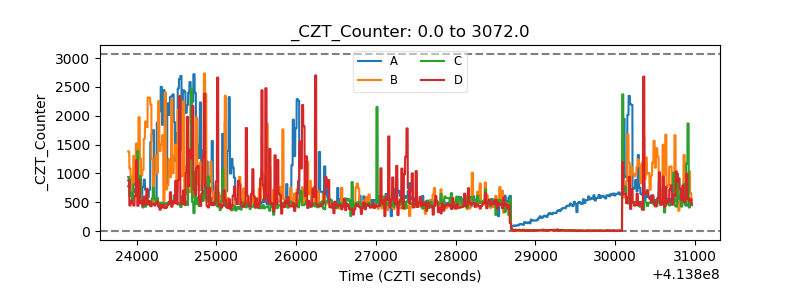 |
| +2.5 Volts monitor | 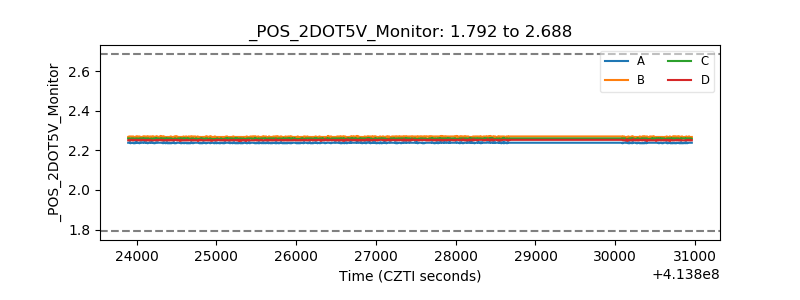 |
| +5 Volts monitor | 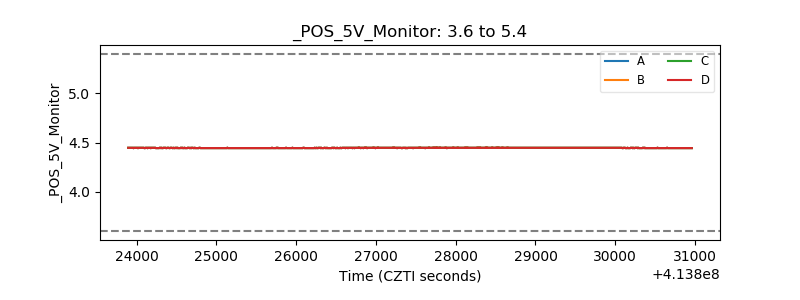 |
| _ROLL_ROT | 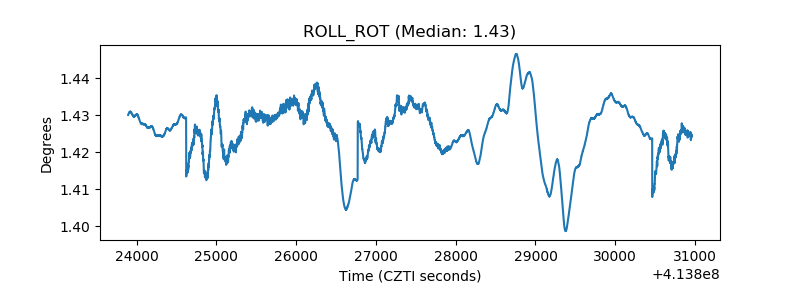 |
| _Roll_DEC | 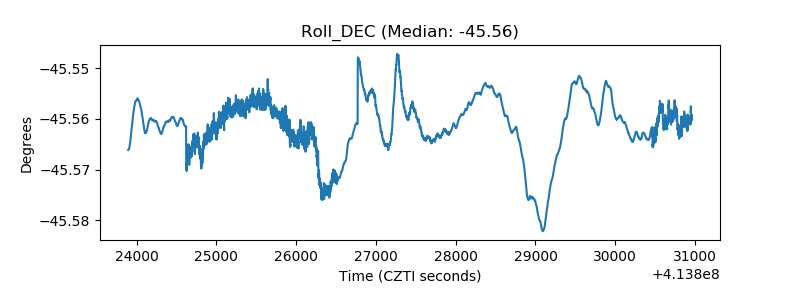 |
| _Roll_RA | 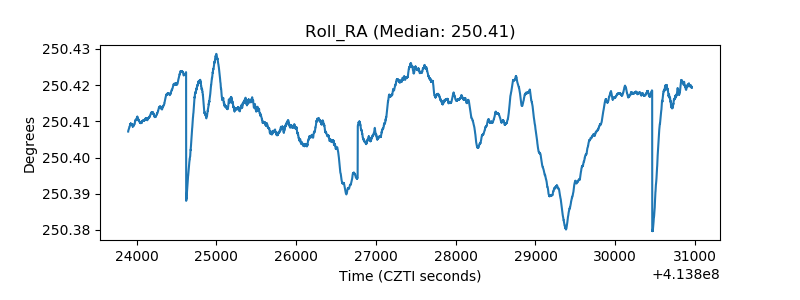 |
| Veto Counter | 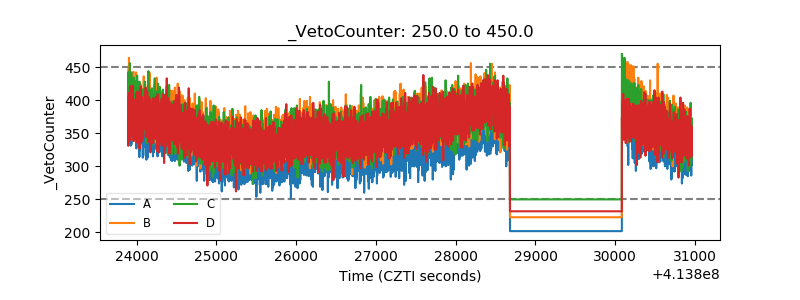 |