| Param | Original file | Final file |
|---|---|---|
| Filename | modeM0/AS1A12_032T02_9000005500_39872cztM0_level2.fits | modeM0/AS1A12_032T02_9000005500_39872cztM0_level2_quad_clean.evt |
| Size (bytes) | 397,713,600 | 96,408,000 |
| Size | 379.3 MB | 91.9 MB |
| Events in quadrant A | 3,457,919 | 643,650 |
| Events in quadrant B | 3,681,933 | 651,080 |
| Events in quadrant C | 3,004,339 | 638,812 |
| Events in quadrant D | 4,117,058 | 571,254 |
| Mode M9 | |||
|---|---|---|---|
| Quadrant | BADHDUFLAG | Total packets | Discarded packets |
| A | 0 | 27 | 0 |
| B | 0 | 27 | 0 |
| C | 0 | 27 | 0 |
| D | 0 | 27 | 0 |
| Mode SS | |||
|---|---|---|---|
| Quadrant | BADHDUFLAG | Total packets | Discarded packets |
| A | 0 | 122 | 0 |
| B | 0 | 122 | 0 |
| C | 0 | 122 | 0 |
| D | 0 | 122 | 0 |
| Mode M0 | |||
|---|---|---|---|
| Quadrant | BADHDUFLAG | Total packets | Discarded packets |
| A | 0 | 13868 | 3 |
| B | 0 | 14985 | 2 |
| C | 0 | 12627 | 2 |
| D | 0 | 16303 | 2 |
| Quadrant | Total seconds | Saturated seconds | Saturation percentage |
|---|---|---|---|
| A | 5928 | 81 | 1.366397% |
| B | 5928 | 119 | 2.007422% |
| C | 5928 | 30 | 0.506073% |
| D | 5928 | 262 | 4.419703% |
Noise dominated data is calculated using 1-second bins in cleaned event files. If a bin has >2000 counts, and if more than 50% of those come from <1% of pixels, then it is considered to be noise-dominated and hence unusable.
| Quadrant | # 1 sec bins | Bins with >0 counts | Bins with >2000 counts | High rate bins dominated by noise | Noise dominated (total time) | Noise dominated (detector-on time) | Marked lightcurve |
|---|---|---|---|---|---|---|---|
| A | 8644 | 5930 | 62 | 62 | 0.72% | 1.05% | 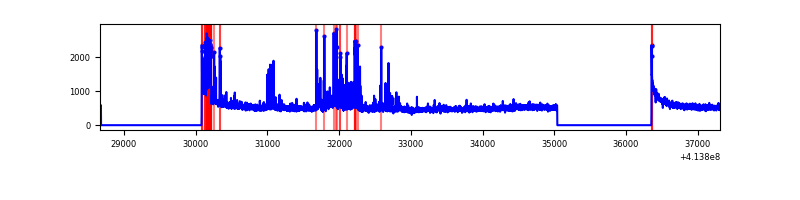 |
| B | 8644 | 5930 | 55 | 55 | 0.64% | 0.93% | 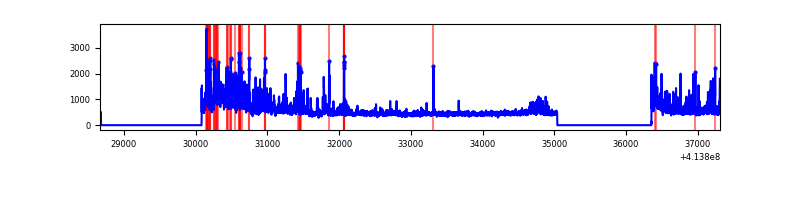 |
| C | 8644 | 5930 | 26 | 26 | 0.30% | 0.44% | 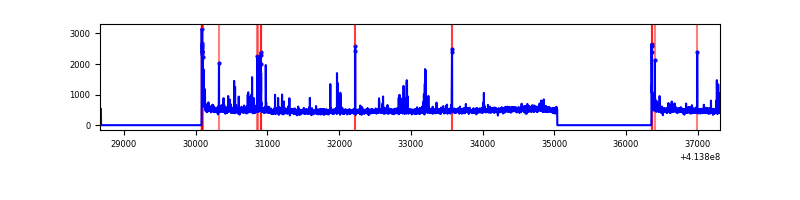 |
| D | 8644 | 5930 | 222 | 222 | 2.57% | 3.74% | 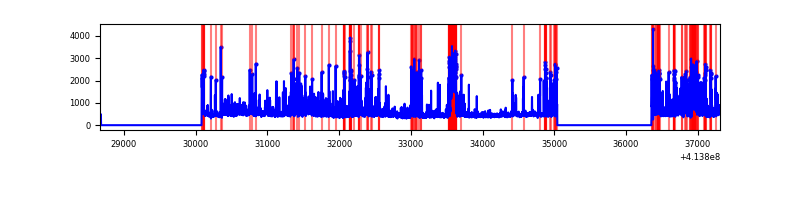 |
Top three noisy pixels from each quadrant. If the there are fewer than three noisy pixels in the level2.evt file, extra rows are filled as -1
| Pixel properties | Quadrant properties | ||||||
|---|---|---|---|---|---|---|---|
| Quadrant | DetID | PixID | Counts | Sigma | Mean | Median | Sigma |
| A | 10 | 83 | 573100 | 4298.11 | 645 | 629 | 133.2 |
| A | 14 | 235 | 159849 | 1195.42 | 645 | 629 | 133.2 |
| A | 9 | 191 | 94451 | 704.42 | 645 | 629 | 133.2 |
| B | 0 | 183 | 263098 | 2095.24 | 643 | 626 | 125.3 |
| B | 0 | 190 | 215471 | 1715.05 | 643 | 626 | 125.3 |
| B | 0 | 245 | 167093 | 1328.86 | 643 | 626 | 125.3 |
| C | 15 | 214 | 250950 | 1681.98 | 632 | 635 | 148.8 |
| C | 9 | 187 | 103921 | 694.03 | 632 | 635 | 148.8 |
| C | 14 | 254 | 74784 | 498.24 | 632 | 635 | 148.8 |
| D | 2 | 250 | 395312 | 2579.17 | 620 | 602 | 153.0 |
| D | 12 | 227 | 251570 | 1639.91 | 620 | 602 | 153.0 |
| D | 13 | 171 | 231340 | 1507.72 | 620 | 602 | 153.0 |
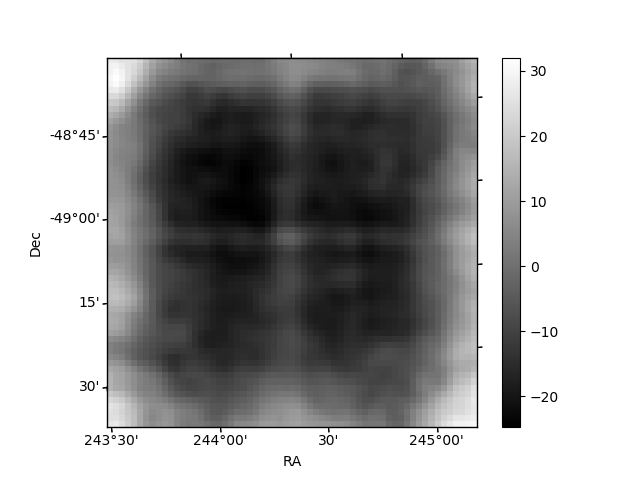
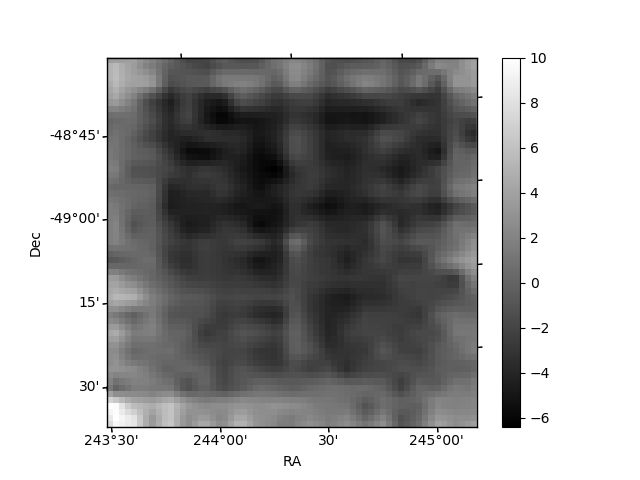
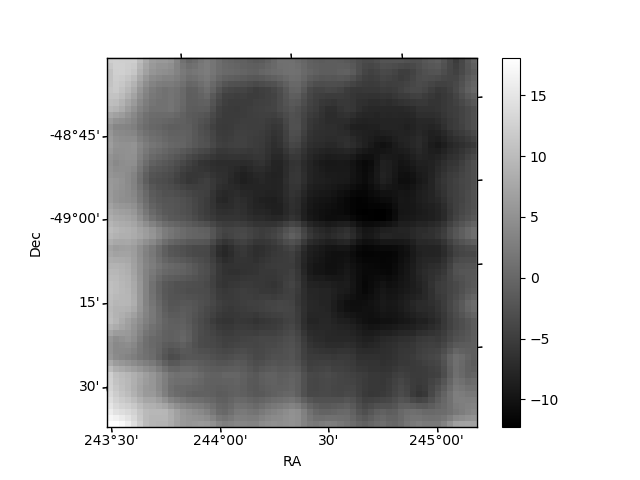
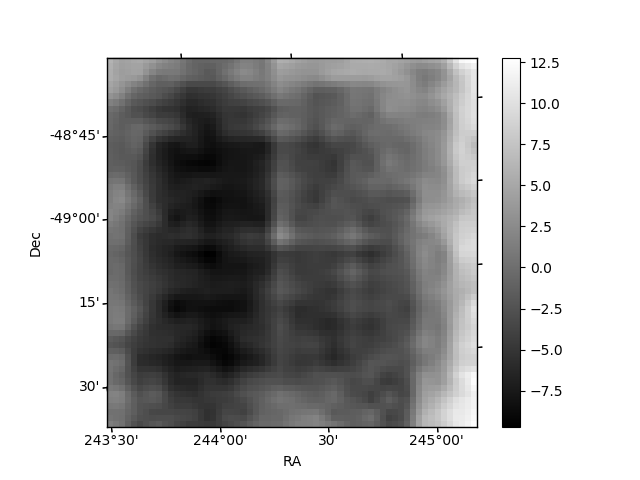
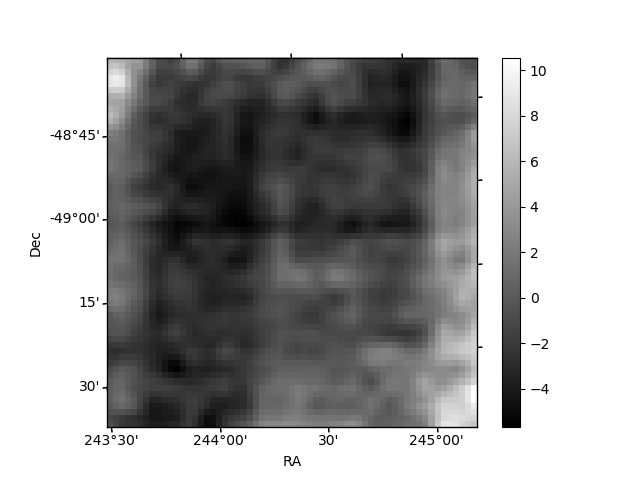
Histogram calculated using DETX and DETY for each event in the final _common_clean file
| Quadrant A | 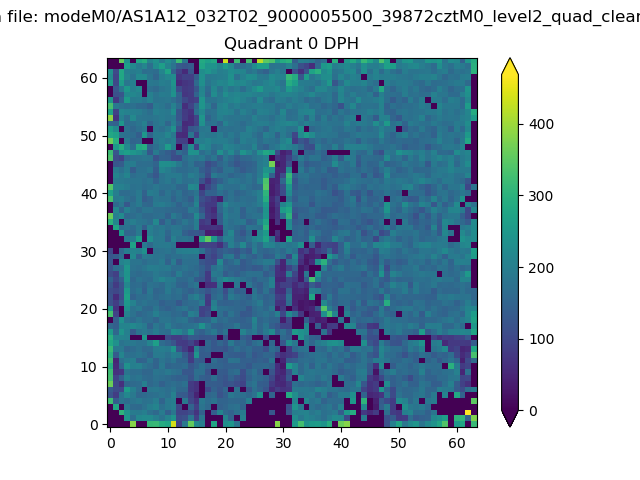 |
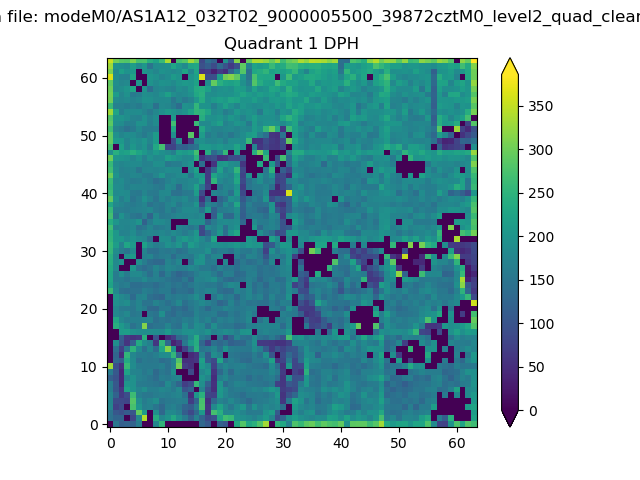 |
Quadrant B |
|---|---|---|---|
| Quadrant D | 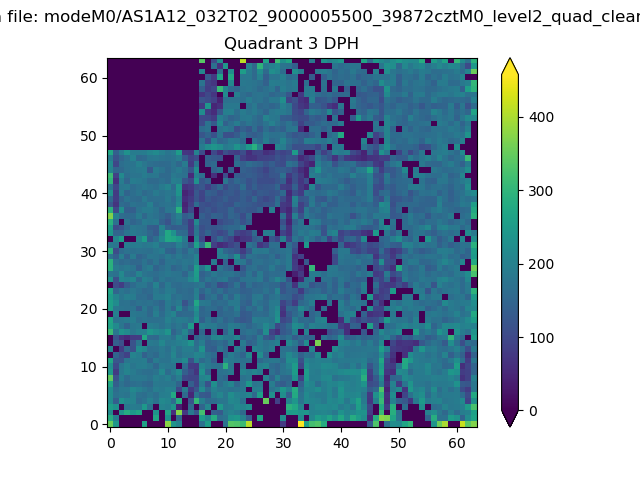 |
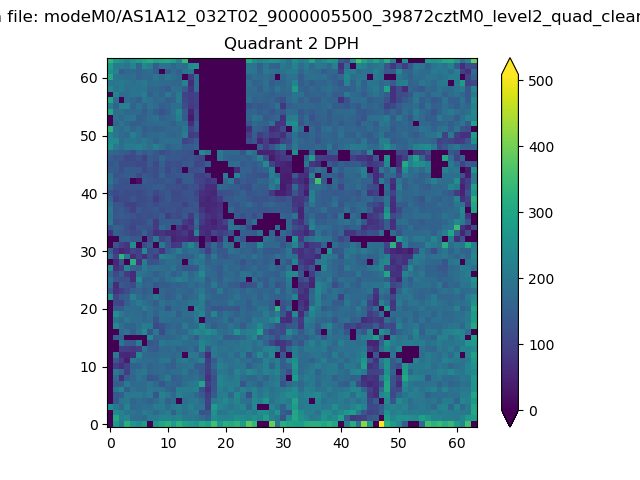 |
Quadrant C |
| Plot type | Count rate plots | Images |
|---|---|---|
| Comparison with Poisson distribution Blue bars denote a histogram of data divided into 1 sec bins. Red curve is a Poisson curve with rate = median count rate of data. |
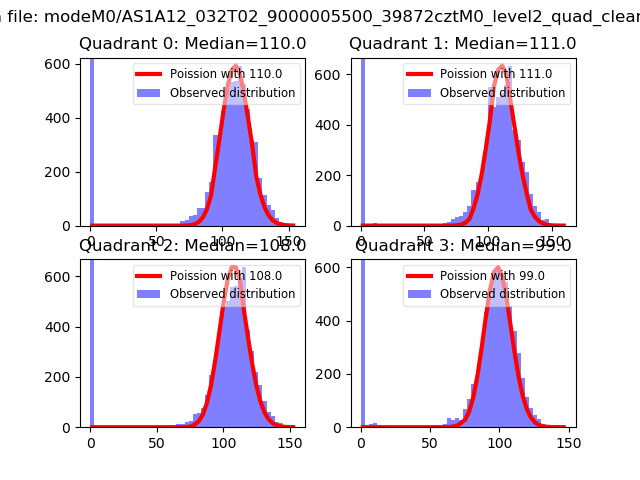 |
 |
| Quadrant-wise count rates Data is divided into 100 sec bins |
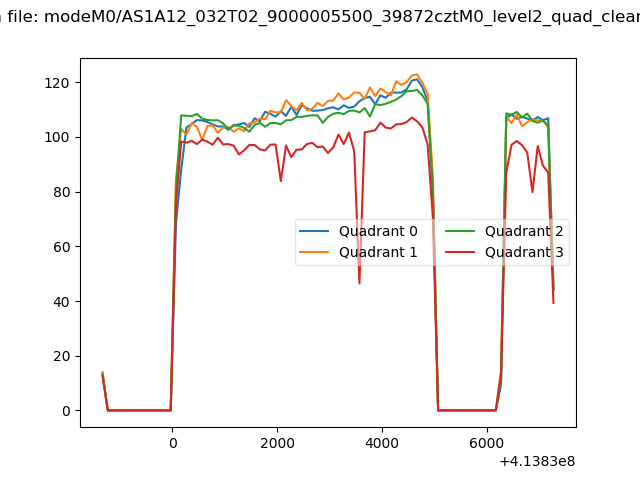 |
|
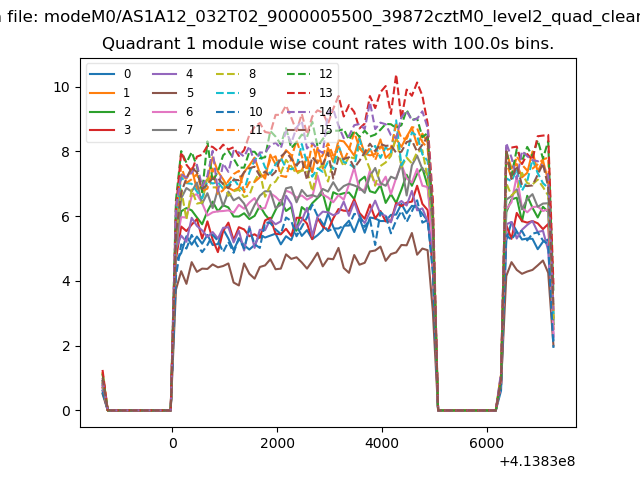
| Module-wise count rates for Quadrant A Data is divided into 100 sec bins |
 |
 |
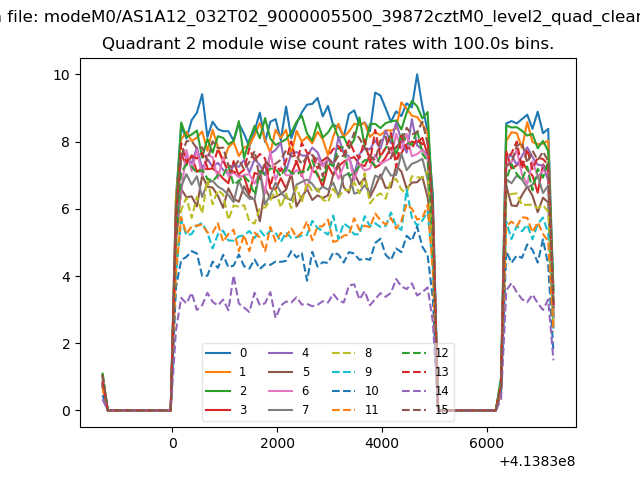
| Module-wise count rates for Quadrant B Data is divided into 100 sec bins |
 |
 |
| Module-wise count rates for Quadrant C Data is divided into 100 sec bins |
 |
 |
| Module-wise count rates for Quadrant D Data is divided into 100 sec bins |
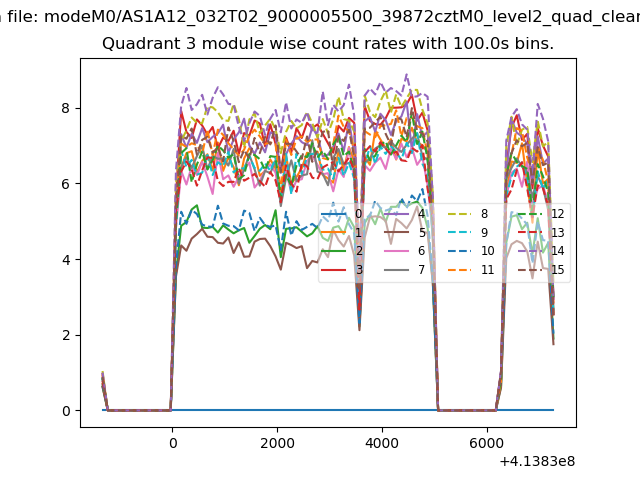 |
 |
| Parameter | Plot |
|---|---|
| CZT HV Monitor |  |
| D_VDD | 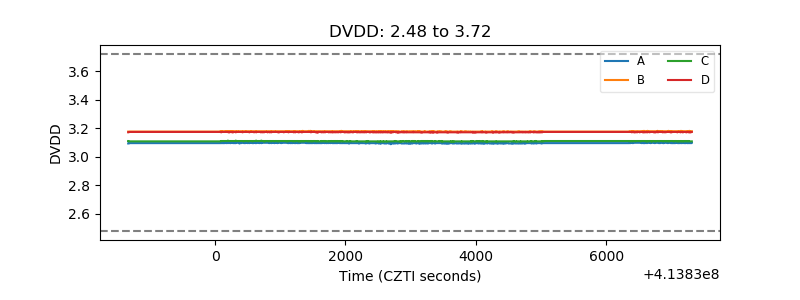 |
| Temperature 1 | 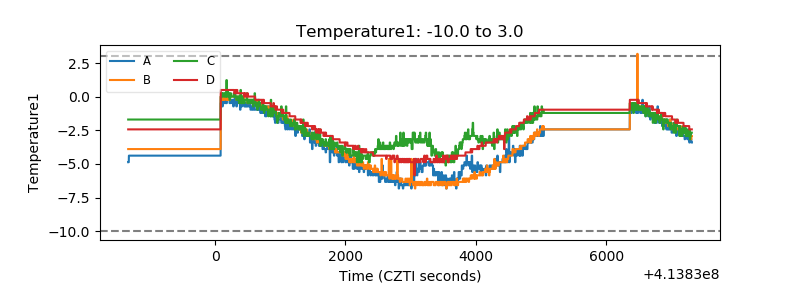 |
| Veto HV Monitor | 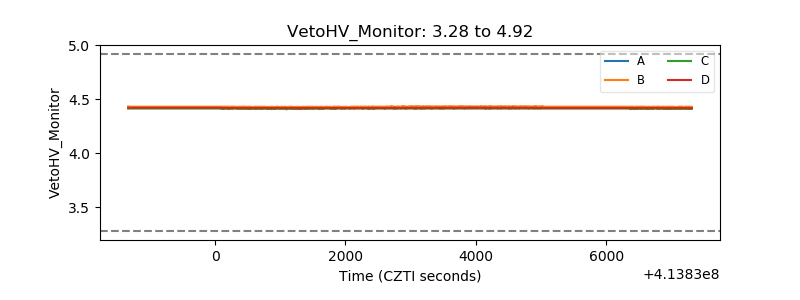 |
| Veto LLD | 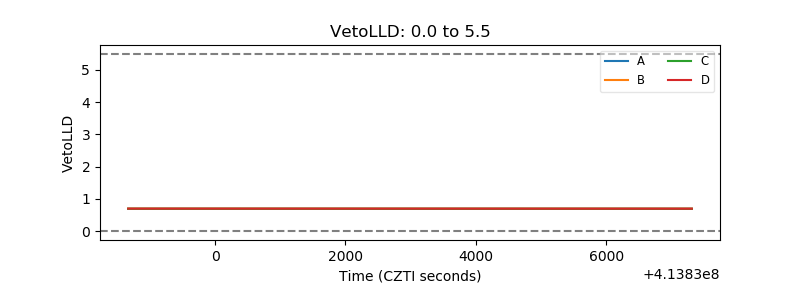 |
| Alpha Counter | 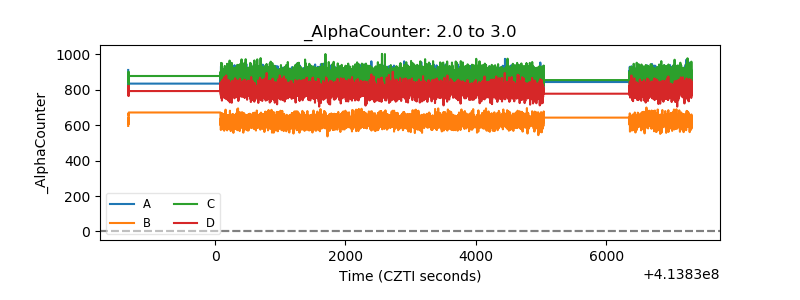 |
| _CPM_Rate | 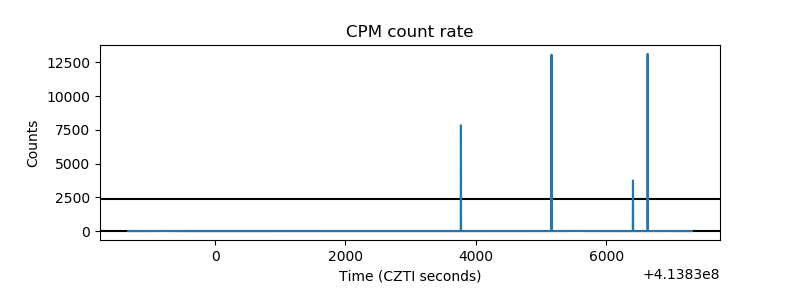 |
| CZT Counter | 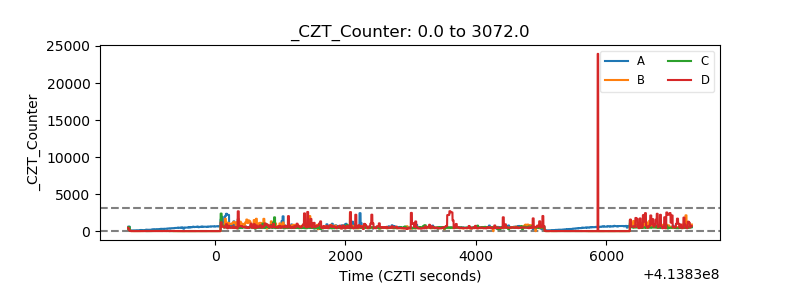 |
| +2.5 Volts monitor | 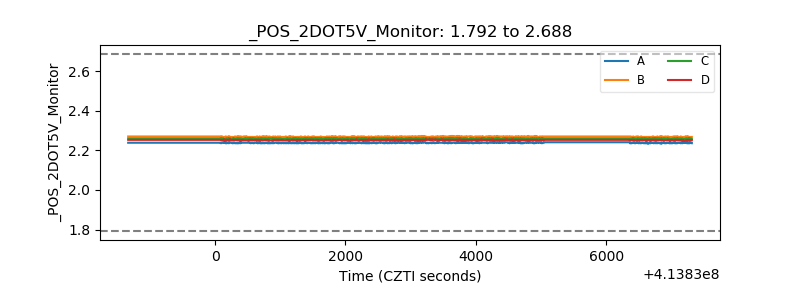 |
| +5 Volts monitor | 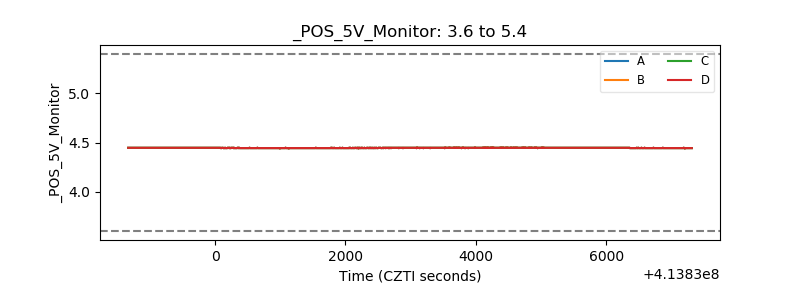 |
| _ROLL_ROT | 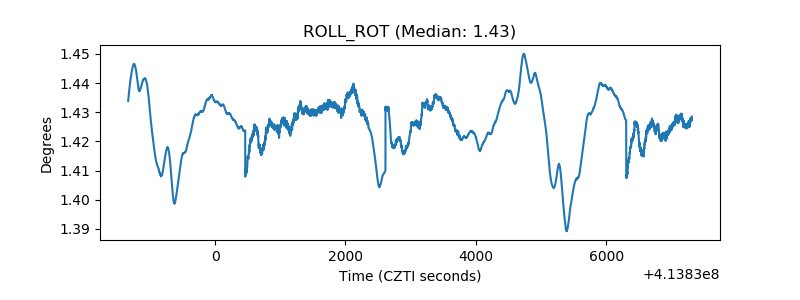 |
| _Roll_DEC | 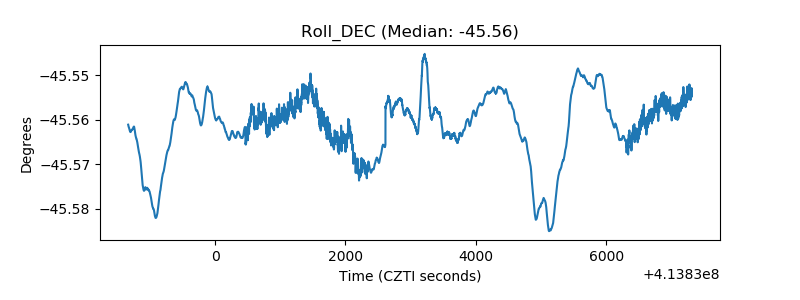 |
| _Roll_RA | 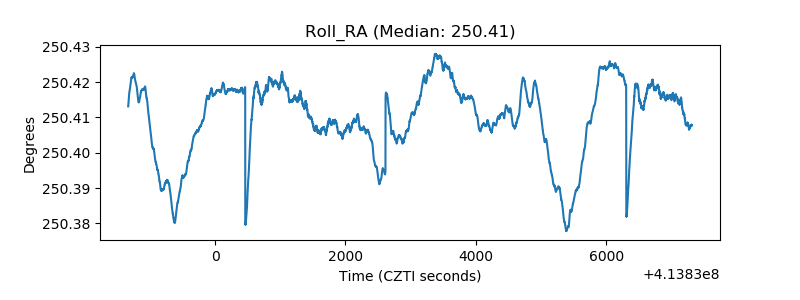 |
| Veto Counter | 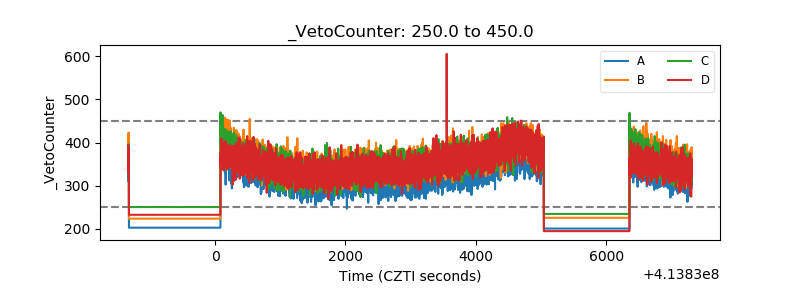 |