| Param | Original file | Final file |
|---|---|---|
| Filename | modeM0/AS1A12_032T02_9000005500_39875cztM0_level2.fits | modeM0/AS1A12_032T02_9000005500_39875cztM0_level2_quad_clean.evt |
| Size (bytes) | 272,067,840 | 70,326,720 |
| Size | 259.5 MB | 67.1 MB |
| Events in quadrant A | 2,265,579 | 474,356 |
| Events in quadrant B | 2,335,737 | 477,345 |
| Events in quadrant C | 2,070,606 | 463,490 |
| Events in quadrant D | 3,061,096 | 409,553 |
| Mode M9 | |||
|---|---|---|---|
| Quadrant | BADHDUFLAG | Total packets | Discarded packets |
| A | 0 | 13 | 0 |
| B | 0 | 13 | 0 |
| C | 0 | 13 | 0 |
| D | 0 | 13 | 0 |
| Mode SS | |||
|---|---|---|---|
| Quadrant | BADHDUFLAG | Total packets | Discarded packets |
| A | 0 | 88 | 0 |
| B | 0 | 88 | 0 |
| C | 0 | 88 | 0 |
| D | 0 | 88 | 0 |
| Mode M0 | |||
|---|---|---|---|
| Quadrant | BADHDUFLAG | Total packets | Discarded packets |
| A | 0 | 9380 | 1 |
| B | 0 | 10030 | 1 |
| C | 0 | 8905 | 1 |
| D | 0 | 12192 | 1 |
| Quadrant | Total seconds | Saturated seconds | Saturation percentage |
|---|---|---|---|
| A | 4330 | 20 | 0.461894% |
| B | 4330 | 61 | 1.408776% |
| C | 4330 | 5 | 0.115473% |
| D | 4330 | 254 | 5.866051% |
Noise dominated data is calculated using 1-second bins in cleaned event files. If a bin has >2000 counts, and if more than 50% of those come from <1% of pixels, then it is considered to be noise-dominated and hence unusable.
| Quadrant | # 1 sec bins | Bins with >0 counts | Bins with >2000 counts | High rate bins dominated by noise | Noise dominated (total time) | Noise dominated (detector-on time) | Marked lightcurve |
|---|---|---|---|---|---|---|---|
| A | 5643 | 4331 | 15 | 15 | 0.27% | 0.35% | 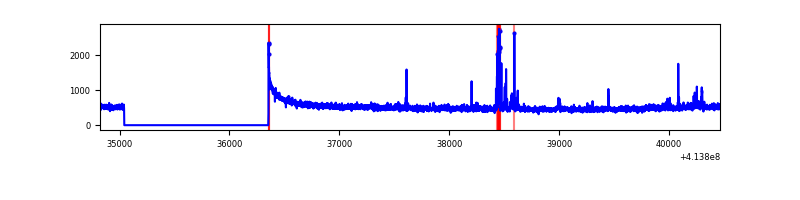 |
| B | 5643 | 4331 | 27 | 27 | 0.48% | 0.62% | 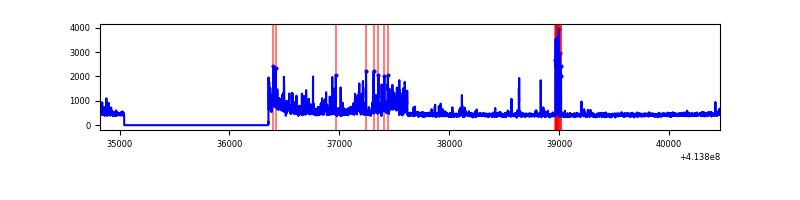 |
| C | 5643 | 4331 | 5 | 5 | 0.09% | 0.12% | 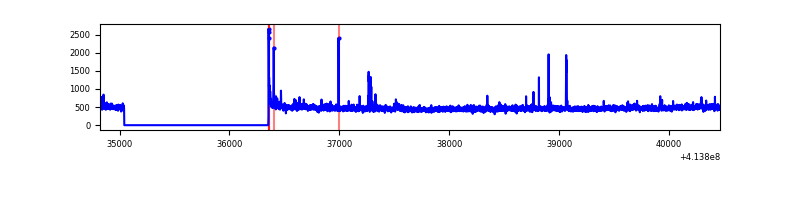 |
| D | 5643 | 4331 | 226 | 226 | 4.00% | 5.22% | 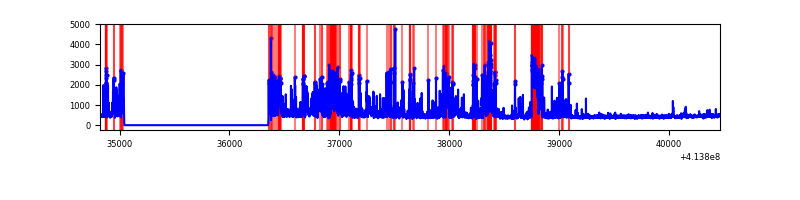 |
Top three noisy pixels from each quadrant. If the there are fewer than three noisy pixels in the level2.evt file, extra rows are filled as -1
| Pixel properties | Quadrant properties | ||||||
|---|---|---|---|---|---|---|---|
| Quadrant | DetID | PixID | Counts | Sigma | Mean | Median | Sigma |
| A | 10 | 83 | 361155 | 3781.27 | 461 | 451 | 95.4 |
| A | 13 | 248 | 56098 | 583.35 | 461 | 451 | 95.4 |
| A | 15 | 223 | 28604 | 295.13 | 461 | 451 | 95.4 |
| B | 0 | 183 | 146428 | 1619.16 | 461 | 448 | 90.2 |
| B | 0 | 245 | 122600 | 1354.86 | 461 | 448 | 90.2 |
| B | 5 | 207 | 62711 | 690.6 | 461 | 448 | 90.2 |
| C | 15 | 214 | 178282 | 1663.31 | 454 | 457 | 106.9 |
| C | 1 | 16 | 32527 | 299.97 | 454 | 457 | 106.9 |
| C | 15 | 208 | 26369 | 242.37 | 454 | 457 | 106.9 |
| D | 12 | 227 | 336604 | 3093.7 | 440 | 427 | 108.7 |
| D | 1 | 47 | 208202 | 1912.07 | 440 | 427 | 108.7 |
| D | 2 | 250 | 196042 | 1800.17 | 440 | 427 | 108.7 |
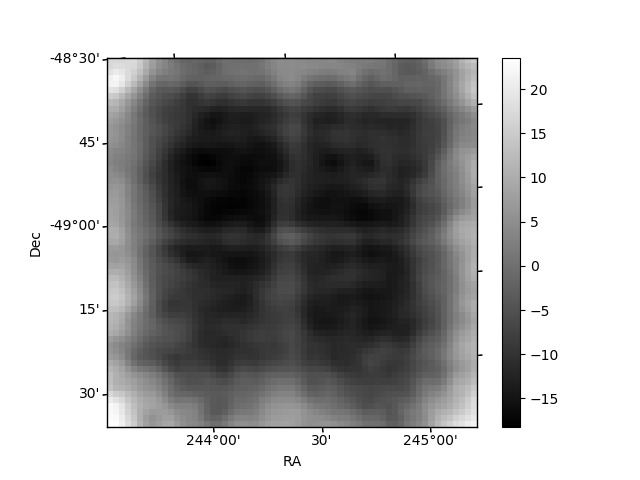
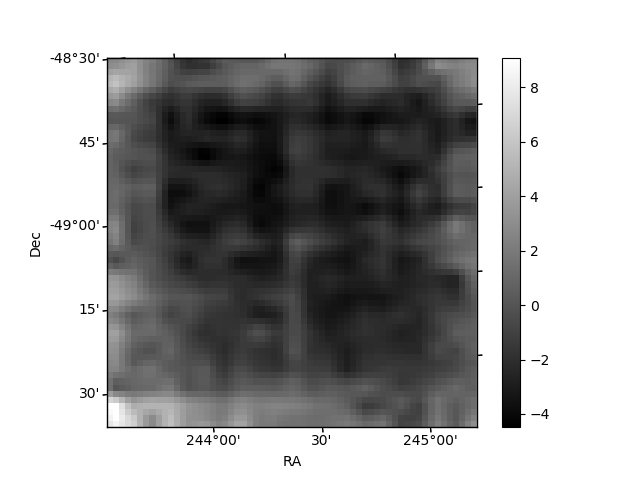
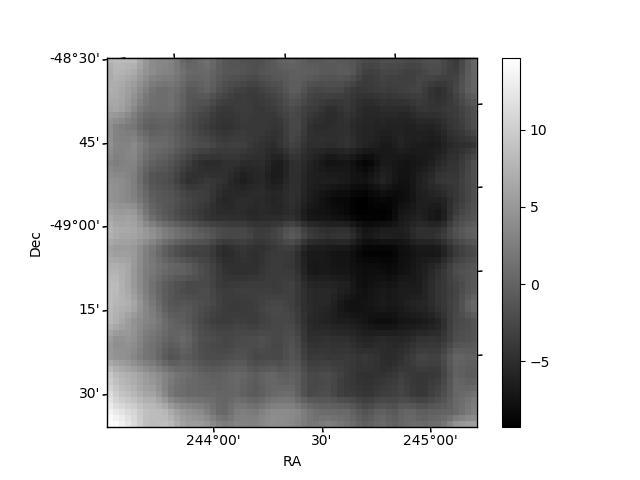
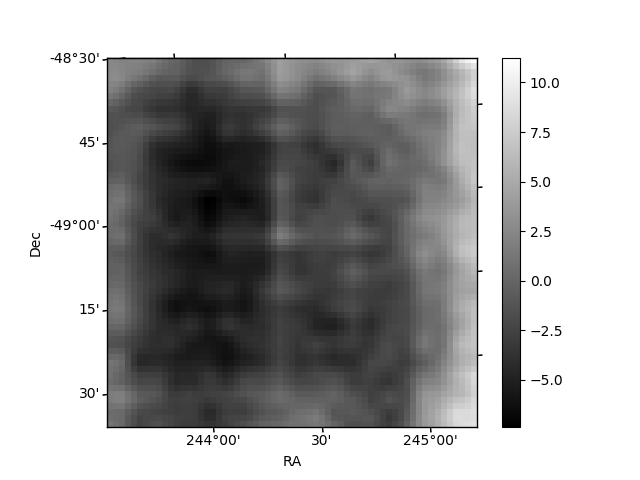
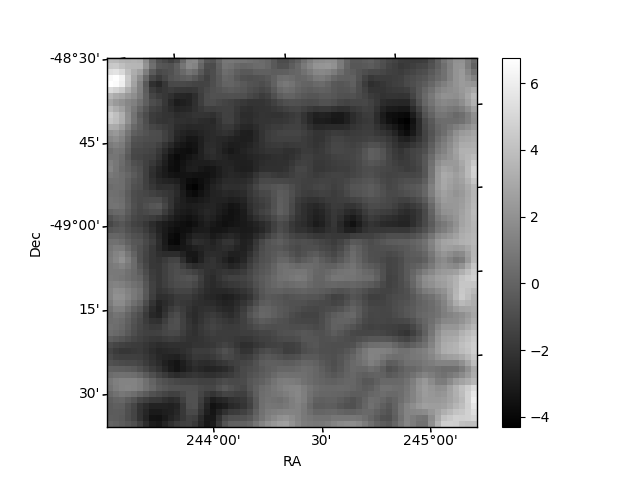
Histogram calculated using DETX and DETY for each event in the final _common_clean file
| Quadrant A | 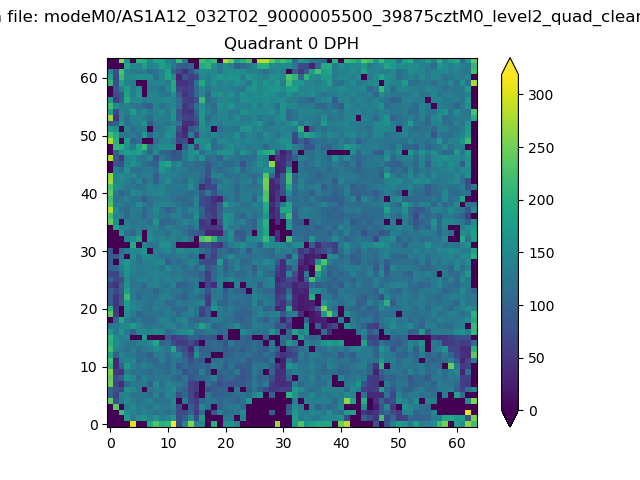 |
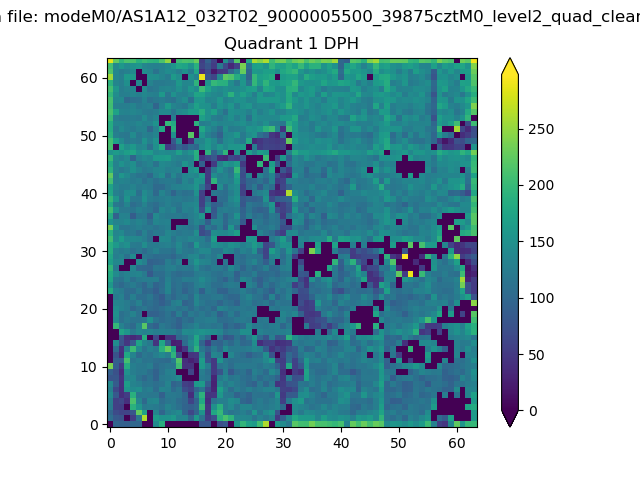 |
Quadrant B |
|---|---|---|---|
| Quadrant D | 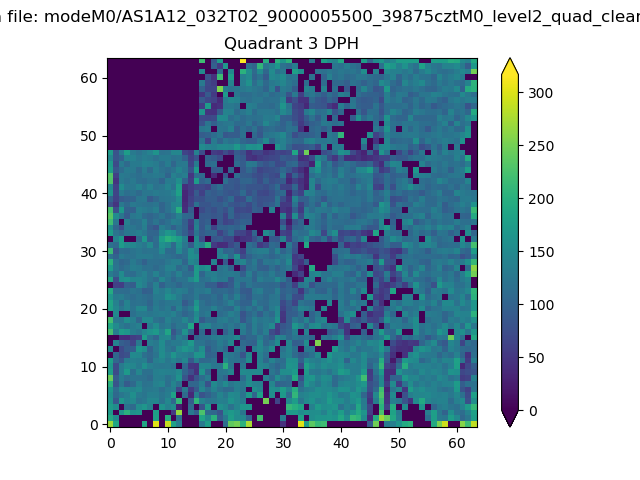 |
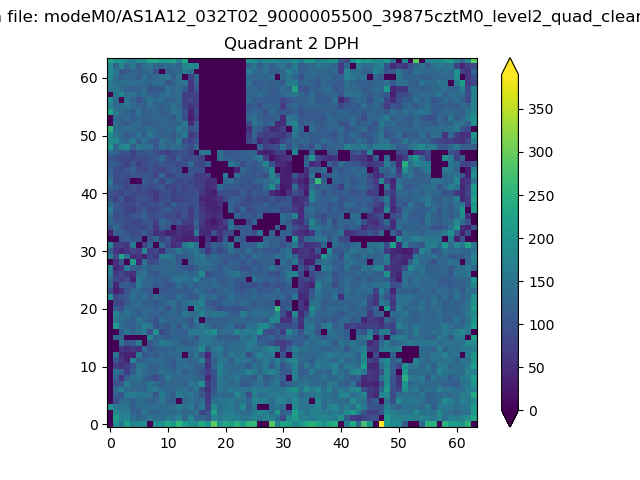 |
Quadrant C |
| Plot type | Count rate plots | Images |
|---|---|---|
| Comparison with Poisson distribution Blue bars denote a histogram of data divided into 1 sec bins. Red curve is a Poisson curve with rate = median count rate of data. |
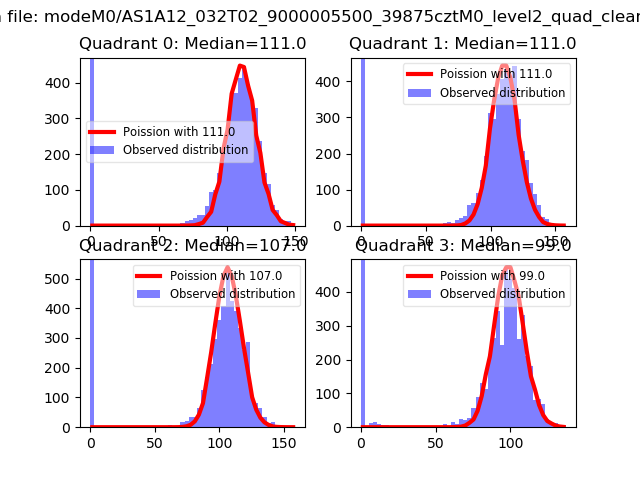 |
 |
| Quadrant-wise count rates Data is divided into 100 sec bins |
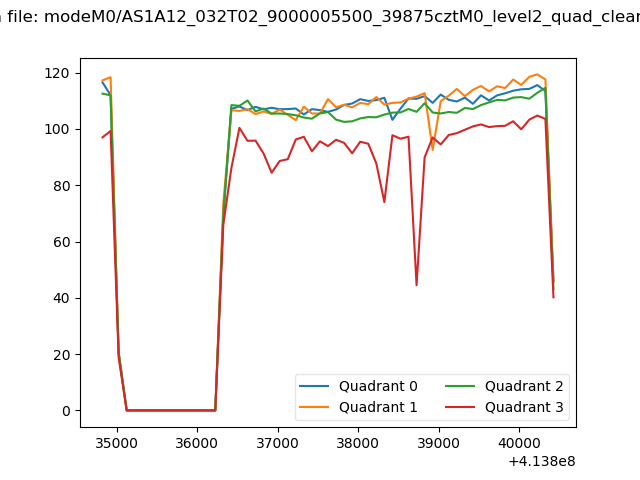 |
|
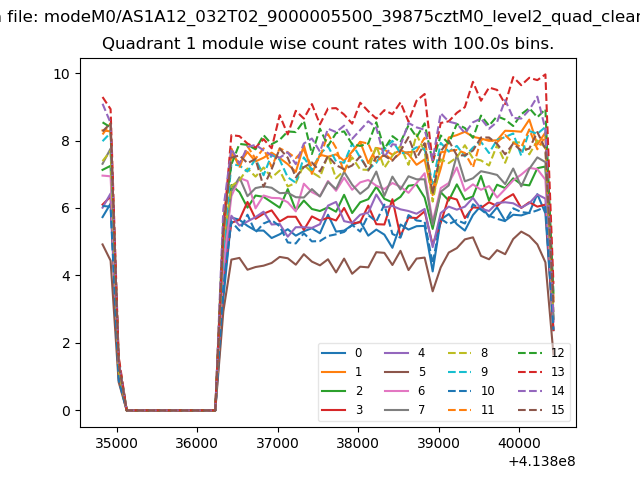
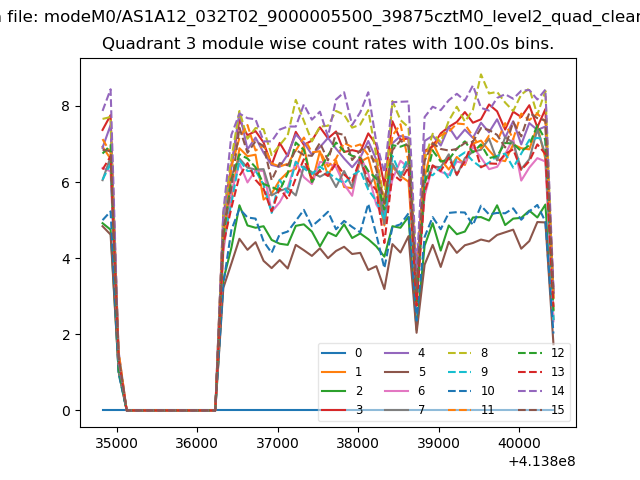
| Module-wise count rates for Quadrant A Data is divided into 100 sec bins |
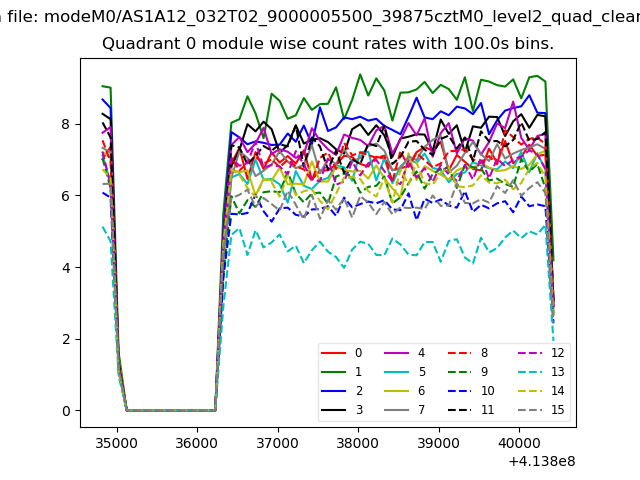 |
 |
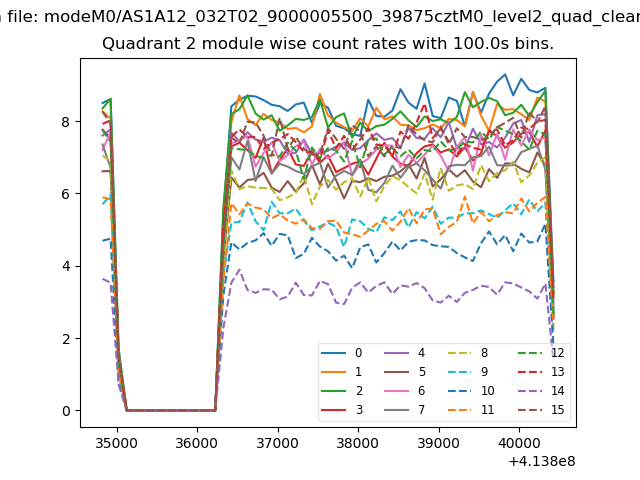
| Module-wise count rates for Quadrant B Data is divided into 100 sec bins |
 |
 |
| Module-wise count rates for Quadrant C Data is divided into 100 sec bins |
 |
 |
| Module-wise count rates for Quadrant D Data is divided into 100 sec bins |
 |
 |
| Parameter | Plot |
|---|---|
| CZT HV Monitor | 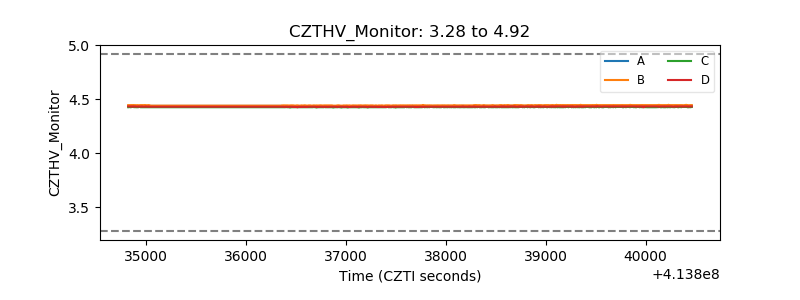 |
| D_VDD | 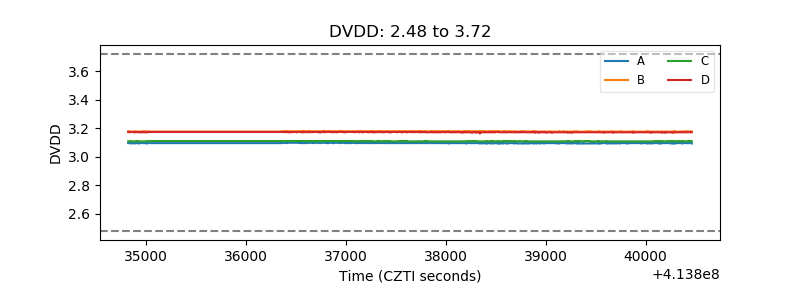 |
| Temperature 1 | 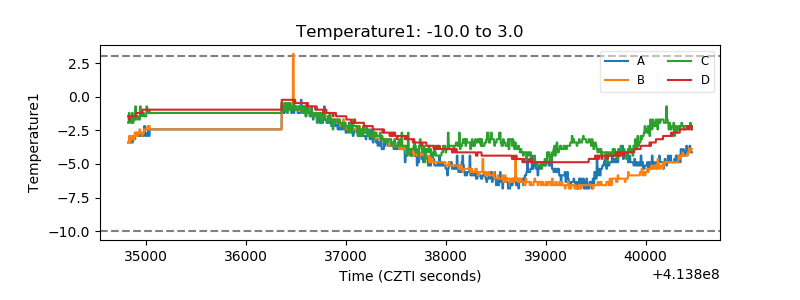 |
| Veto HV Monitor |  |
| Veto LLD | 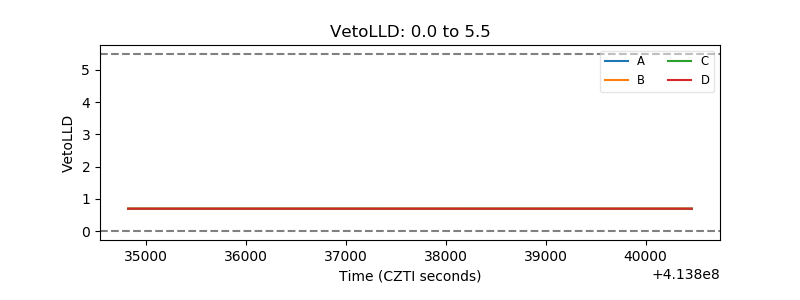 |
| Alpha Counter | 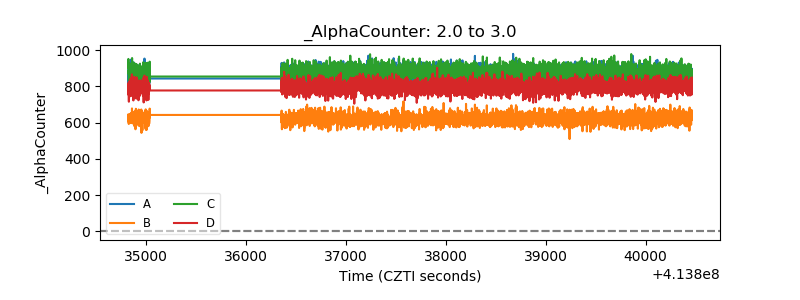 |
| _CPM_Rate | 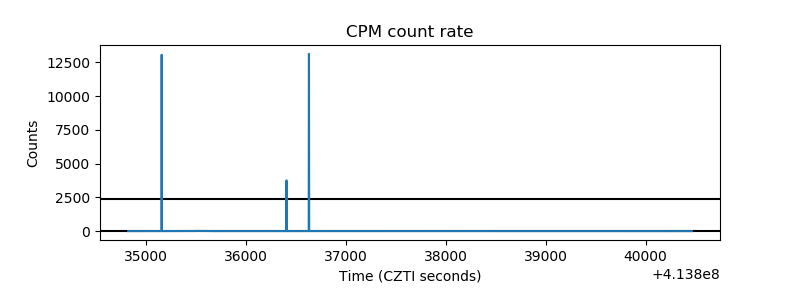 |
| CZT Counter | 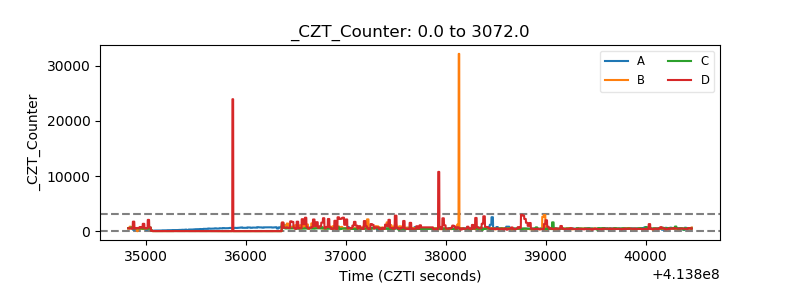 |
| +2.5 Volts monitor | 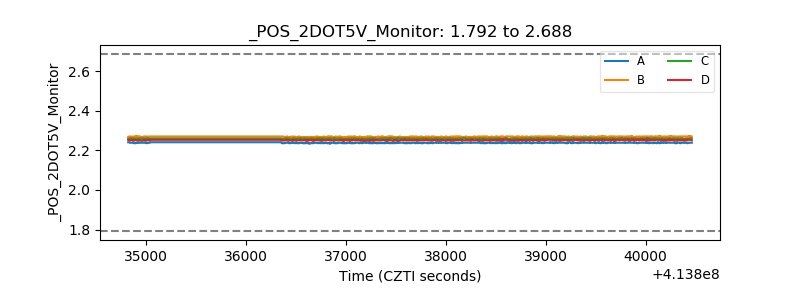 |
| +5 Volts monitor | 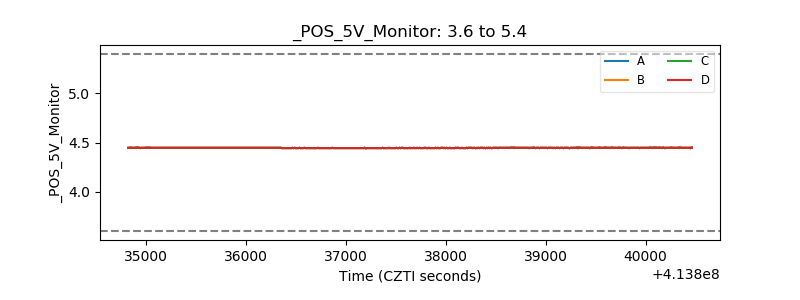 |
| _ROLL_ROT | 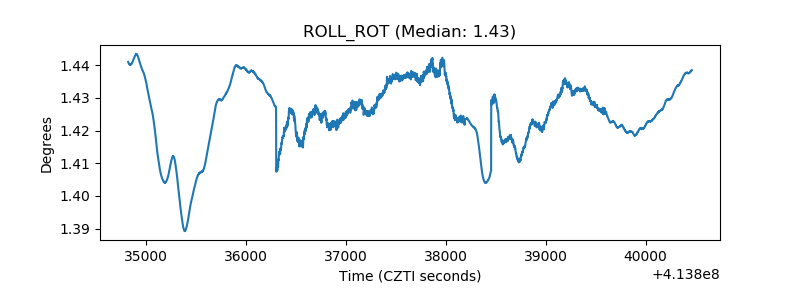 |
| _Roll_DEC | 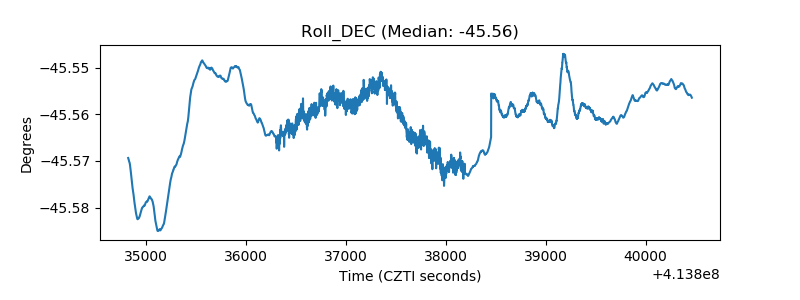 |
| _Roll_RA | 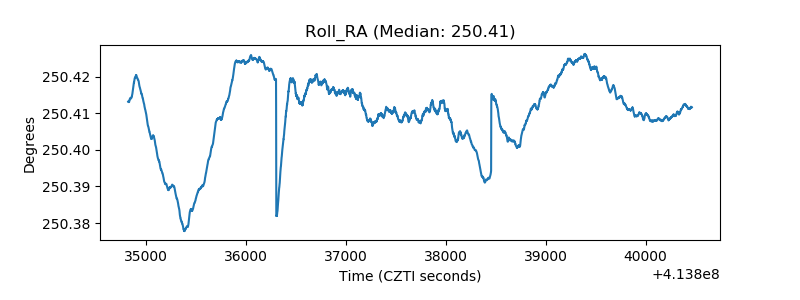 |
| Veto Counter | 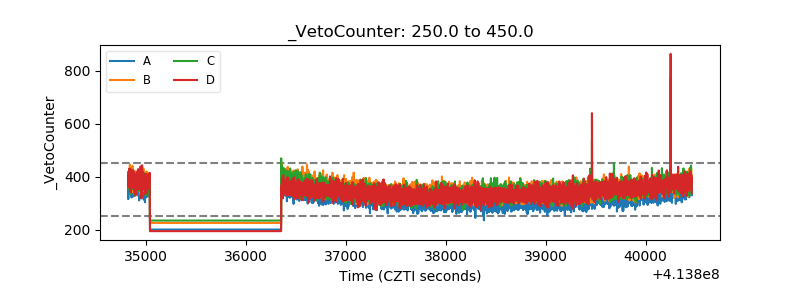 |