| Param | Original file | Final file |
|---|---|---|
| Filename | modeM0/AS1A12_032T02_9000005500_39876cztM0_level2.fits | modeM0/AS1A12_032T02_9000005500_39876cztM0_level2_quad_clean.evt |
| Size (bytes) | 570,018,240 | 144,846,720 |
| Size | 543.6 MB | 138.1 MB |
| Events in quadrant A | 4,872,017 | 968,289 |
| Events in quadrant B | 5,141,622 | 982,532 |
| Events in quadrant C | 4,367,832 | 956,075 |
| Events in quadrant D | 6,022,509 | 855,820 |
| Mode M9 | |||
|---|---|---|---|
| Quadrant | BADHDUFLAG | Total packets | Discarded packets |
| A | 0 | 13 | 0 |
| B | 0 | 13 | 0 |
| C | 0 | 13 | 0 |
| D | 0 | 13 | 0 |
| Mode SS | |||
|---|---|---|---|
| Quadrant | BADHDUFLAG | Total packets | Discarded packets |
| A | 0 | 182 | 0 |
| B | 0 | 182 | 0 |
| C | 0 | 182 | 0 |
| D | 0 | 182 | 0 |
| Mode M0 | |||
|---|---|---|---|
| Quadrant | BADHDUFLAG | Total packets | Discarded packets |
| A | 0 | 19955 | 1 |
| B | 0 | 21569 | 1 |
| C | 0 | 18646 | 1 |
| D | 0 | 24186 | 1 |
| Quadrant | Total seconds | Saturated seconds | Saturation percentage |
|---|---|---|---|
| A | 8972 | 66 | 0.735622% |
| B | 8972 | 146 | 1.627285% |
| C | 8972 | 17 | 0.189478% |
| D | 8972 | 398 | 4.436023% |
Noise dominated data is calculated using 1-second bins in cleaned event files. If a bin has >2000 counts, and if more than 50% of those come from <1% of pixels, then it is considered to be noise-dominated and hence unusable.
| Quadrant | # 1 sec bins | Bins with >0 counts | Bins with >2000 counts | High rate bins dominated by noise | Noise dominated (total time) | Noise dominated (detector-on time) | Marked lightcurve |
|---|---|---|---|---|---|---|---|
| A | 10285 | 8973 | 54 | 54 | 0.53% | 0.60% | 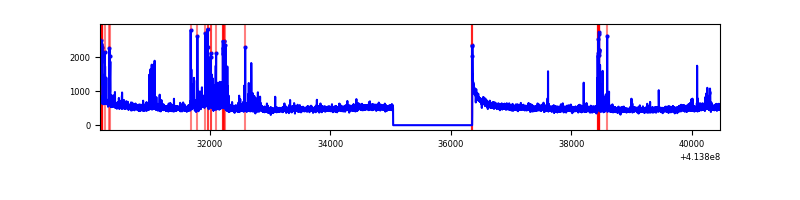 |
| B | 10285 | 8973 | 71 | 71 | 0.69% | 0.79% | 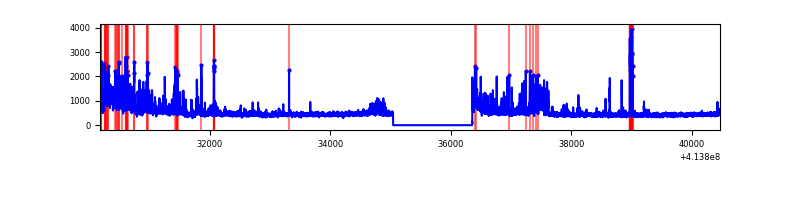 |
| C | 10285 | 8973 | 15 | 15 | 0.15% | 0.17% | 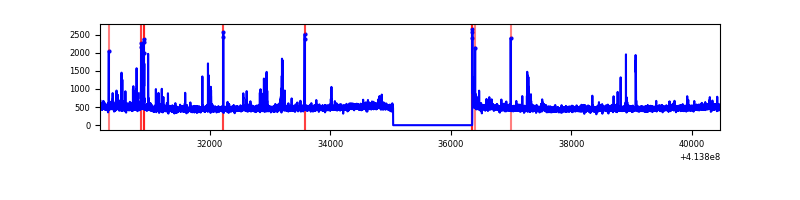 |
| D | 10285 | 8973 | 353 | 353 | 3.43% | 3.93% | 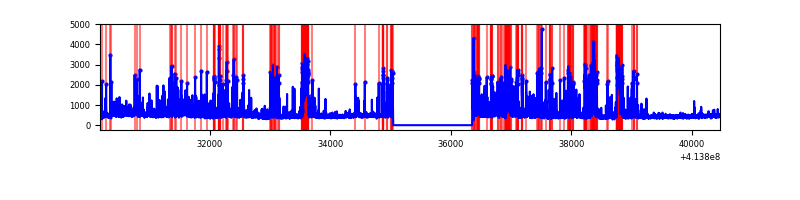 |
Top three noisy pixels from each quadrant. If the there are fewer than three noisy pixels in the level2.evt file, extra rows are filled as -1
| Pixel properties | Quadrant properties | ||||||
|---|---|---|---|---|---|---|---|
| Quadrant | DetID | PixID | Counts | Sigma | Mean | Median | Sigma |
| A | 10 | 83 | 702707 | 3542.41 | 963 | 940 | 198.1 |
| A | 14 | 235 | 174294 | 875.06 | 963 | 940 | 198.1 |
| A | 13 | 248 | 113960 | 570.51 | 963 | 940 | 198.1 |
| B | 0 | 183 | 372554 | 2011.08 | 961 | 936 | 184.8 |
| B | 0 | 190 | 212957 | 1147.39 | 961 | 936 | 184.8 |
| B | 0 | 245 | 190283 | 1024.69 | 961 | 936 | 184.8 |
| C | 15 | 214 | 370173 | 1669.33 | 949 | 955 | 221.2 |
| C | 14 | 254 | 81474 | 364.05 | 949 | 955 | 221.2 |
| C | 9 | 187 | 69674 | 310.7 | 949 | 955 | 221.2 |
| D | 2 | 250 | 449494 | 1972.8 | 925 | 897 | 227.4 |
| D | 12 | 227 | 398066 | 1746.63 | 925 | 897 | 227.4 |
| D | 1 | 47 | 293430 | 1286.48 | 925 | 897 | 227.4 |
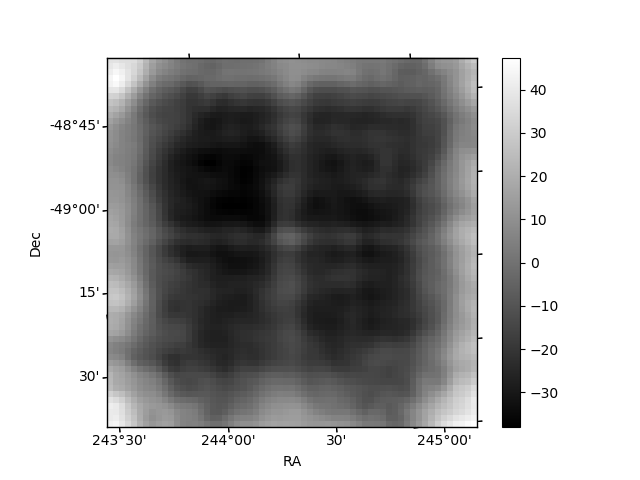
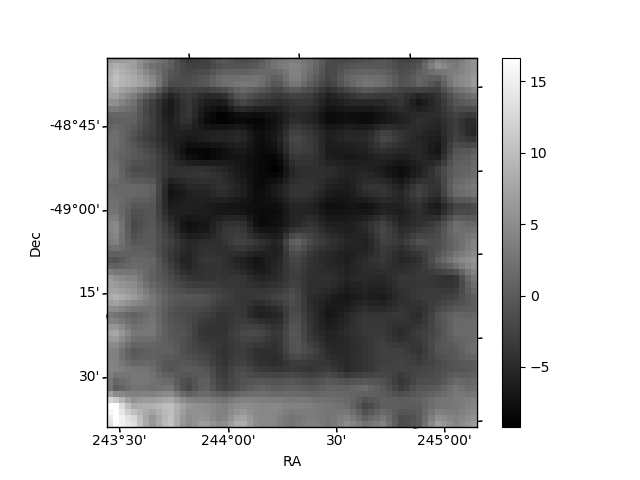
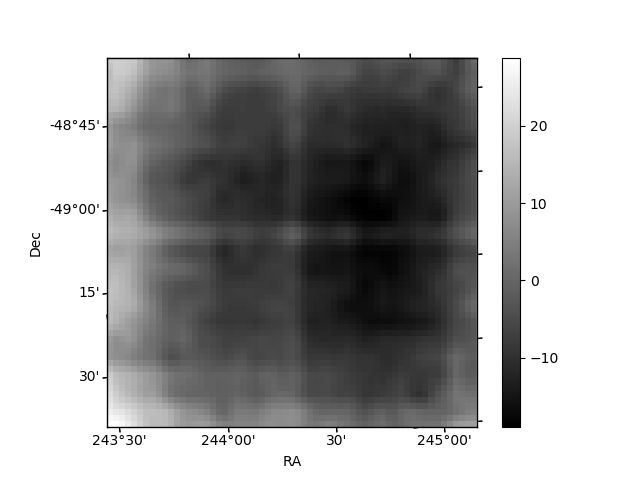
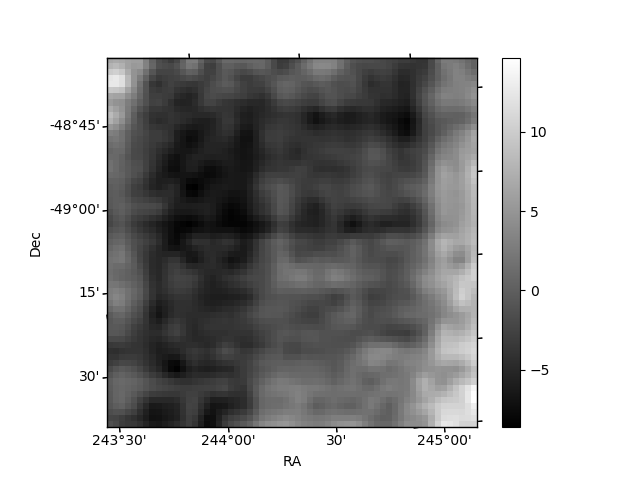
Histogram calculated using DETX and DETY for each event in the final _common_clean file
| Quadrant A | 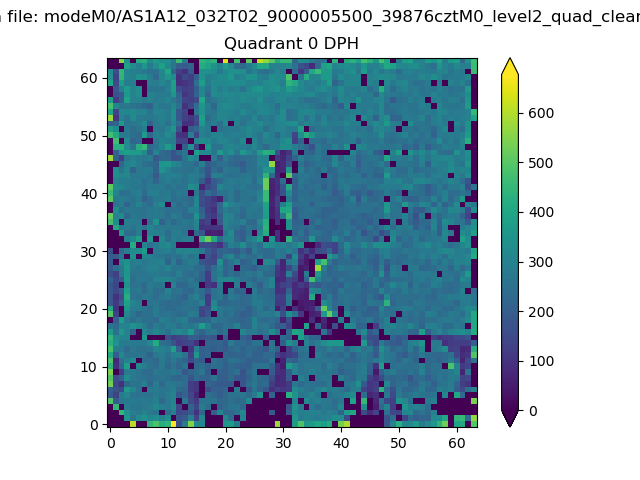 |
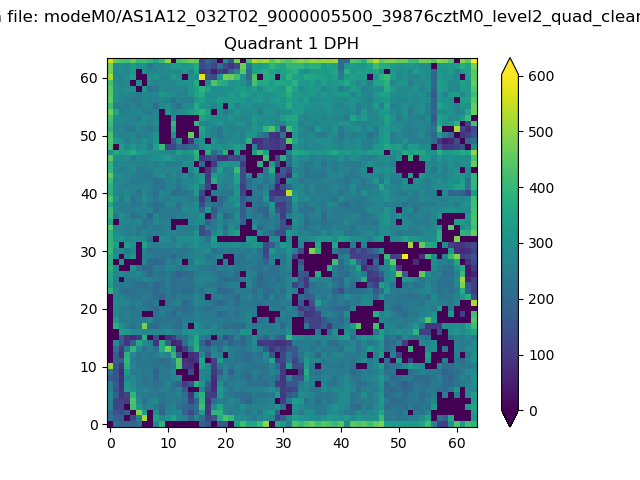 |
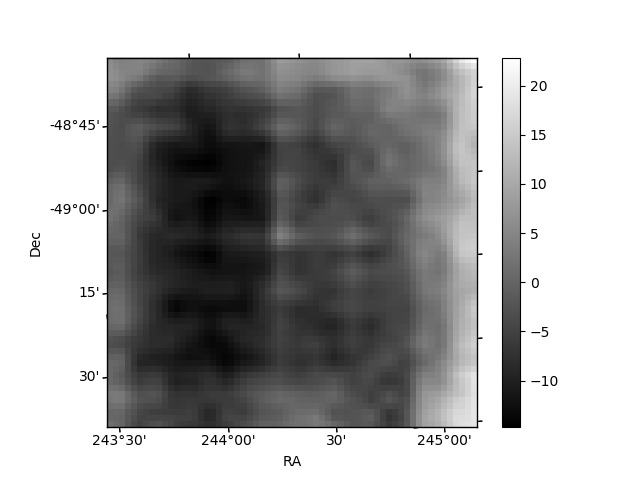
Quadrant B |
|---|---|---|---|
| Quadrant D |  |
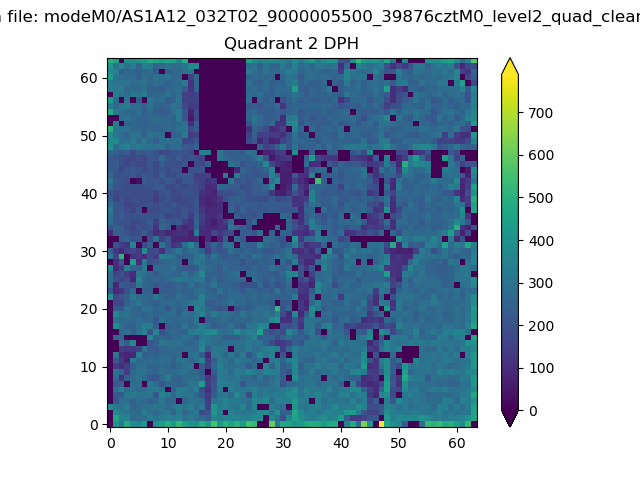 |
Quadrant C |
| Plot type | Count rate plots | Images |
|---|---|---|
| Comparison with Poisson distribution Blue bars denote a histogram of data divided into 1 sec bins. Red curve is a Poisson curve with rate = median count rate of data. |
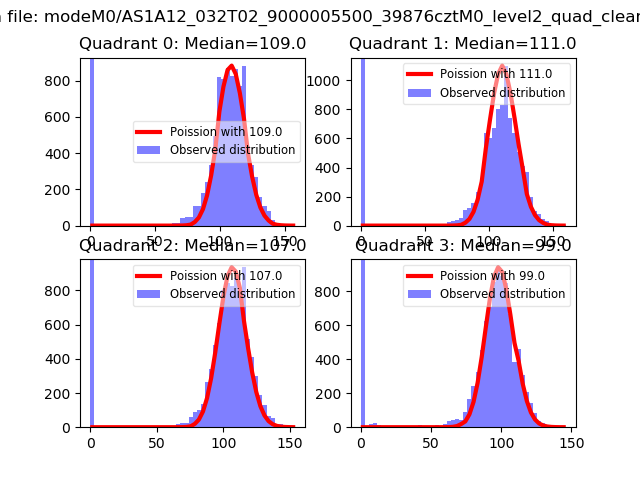 |
 |
| Quadrant-wise count rates Data is divided into 100 sec bins |
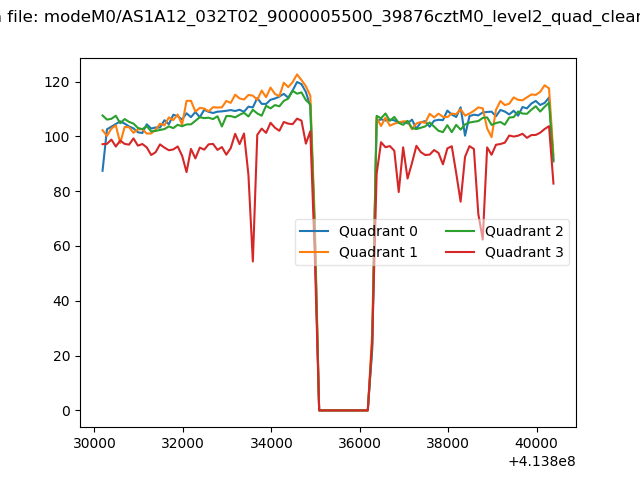 |
|
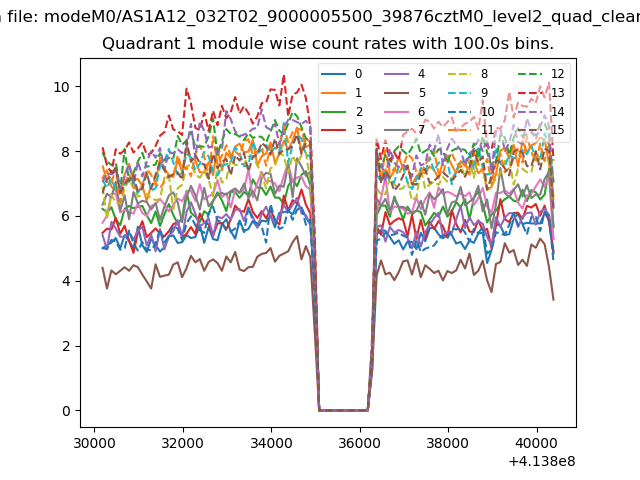
| Module-wise count rates for Quadrant A Data is divided into 100 sec bins |
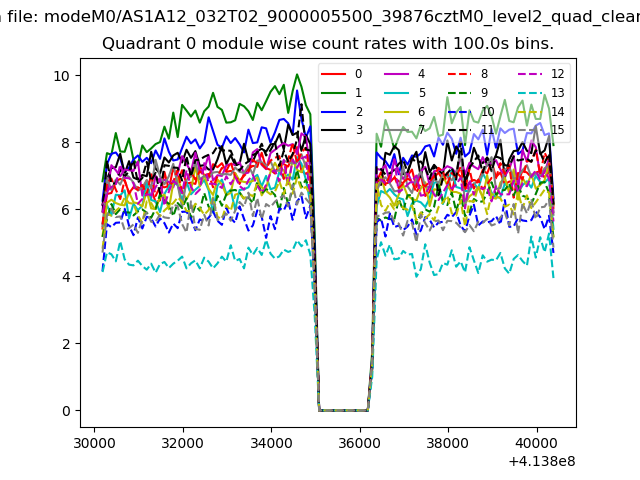 |
 |
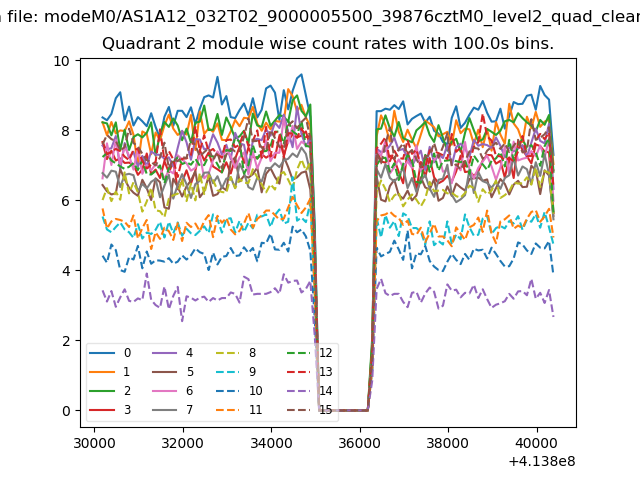
| Module-wise count rates for Quadrant B Data is divided into 100 sec bins |
 |
 |
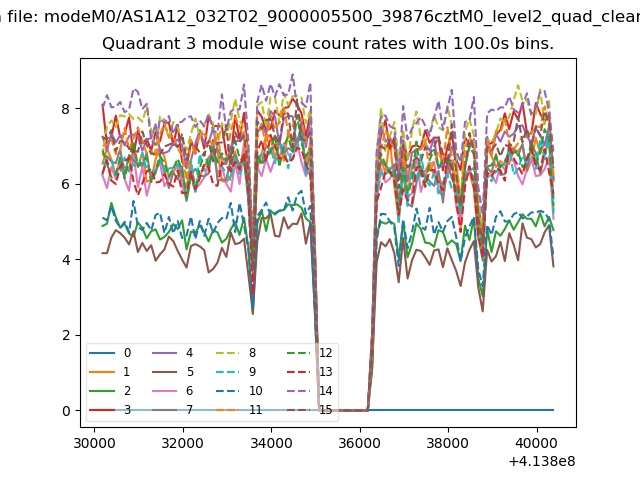
| Module-wise count rates for Quadrant C Data is divided into 100 sec bins |
 |
 |
| Module-wise count rates for Quadrant D Data is divided into 100 sec bins |
 |
 |
| Parameter | Plot |
|---|---|
| CZT HV Monitor | 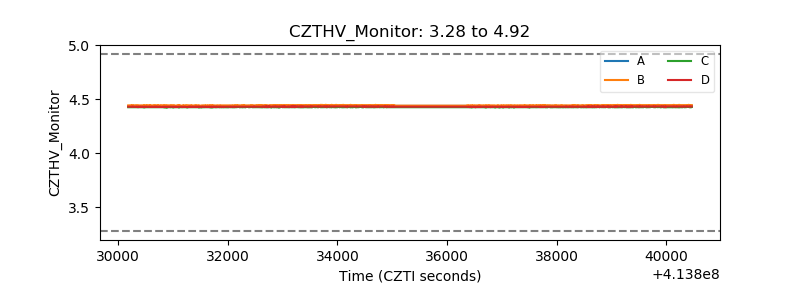 |
| D_VDD | 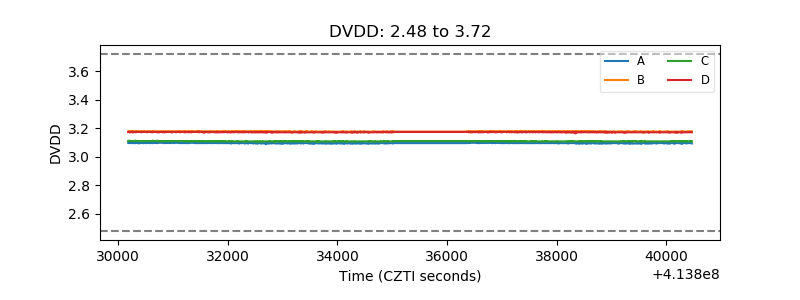 |
| Temperature 1 | 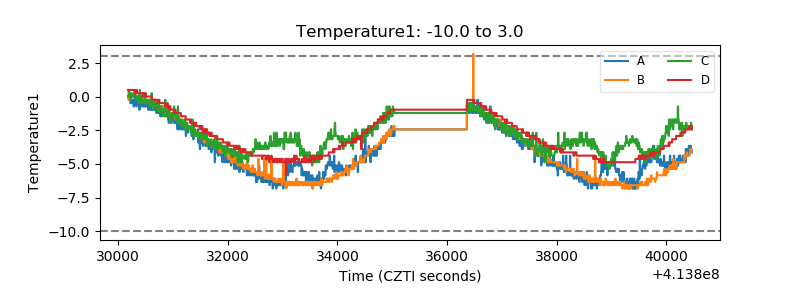 |
| Veto HV Monitor | 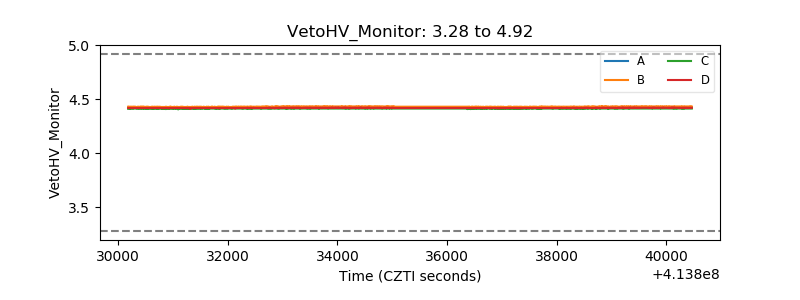 |
| Veto LLD | 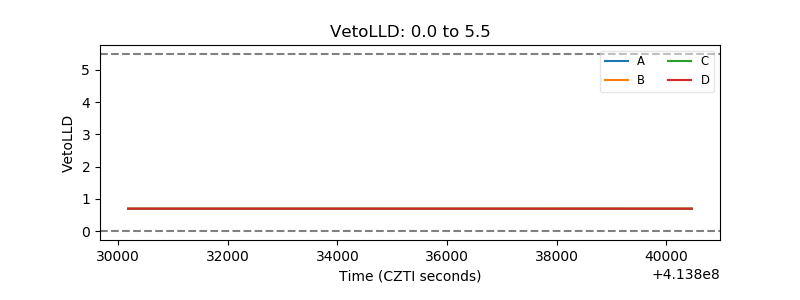 |
| Alpha Counter | 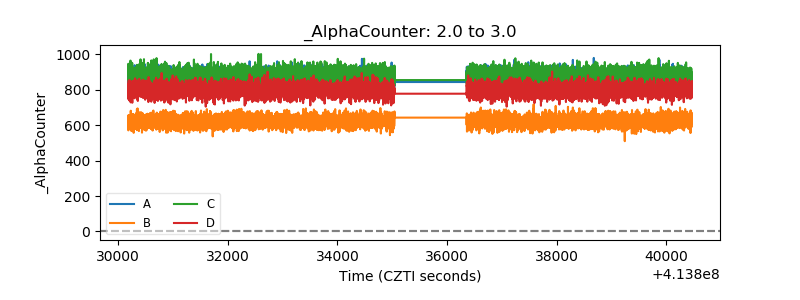 |
| _CPM_Rate |  |
| CZT Counter | 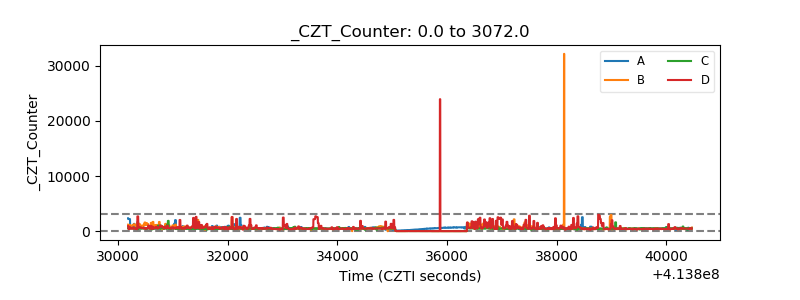 |
| +2.5 Volts monitor | 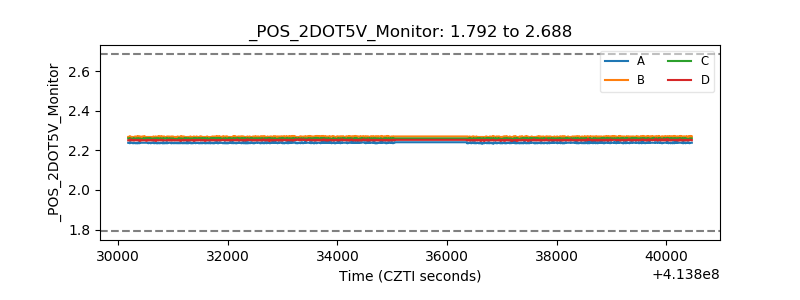 |
| +5 Volts monitor | 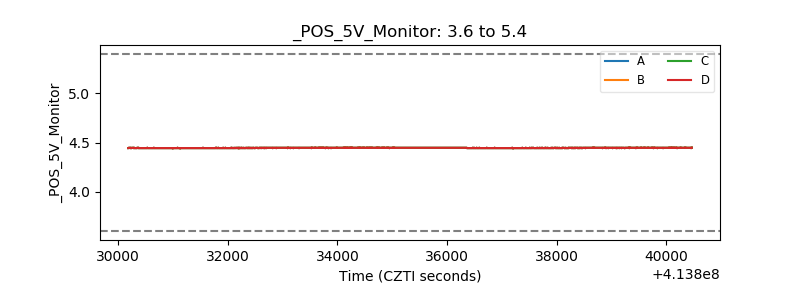 |
| _ROLL_ROT | 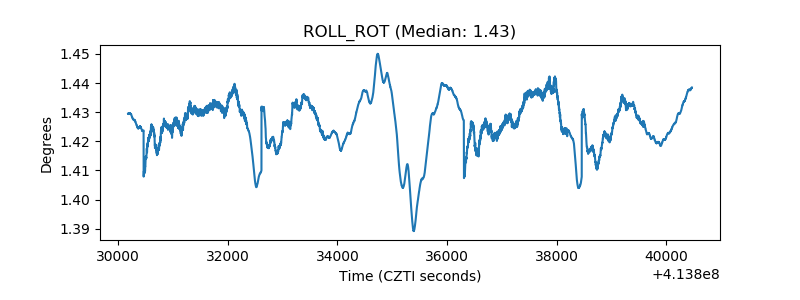 |
| _Roll_DEC | 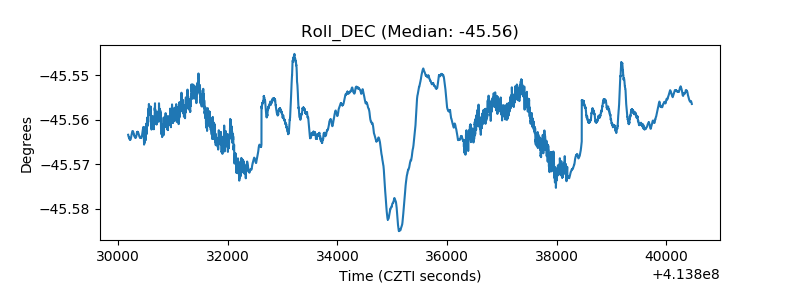 |
| _Roll_RA | 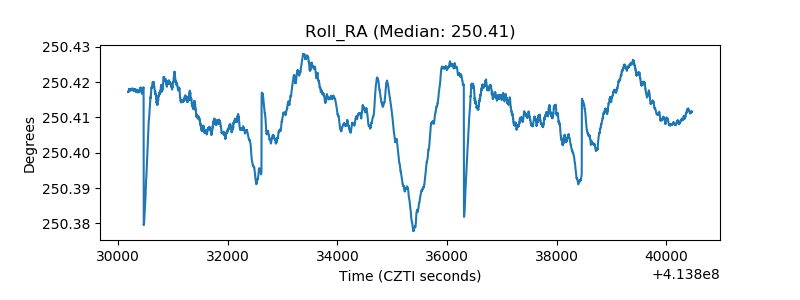 |
| Veto Counter | 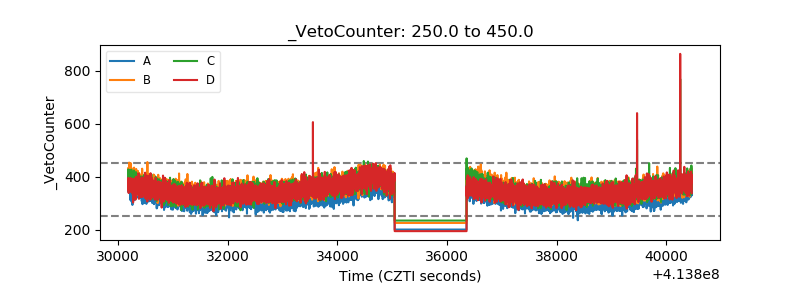 |