| Param | Original file | Final file |
|---|---|---|
| Filename | modeM0/AS1A12_032T03_9000005502_39875cztM0_level2.fits | modeM0/AS1A12_032T03_9000005502_39875cztM0_level2_quad_clean.evt |
| Size (bytes) | 688,207,680 | 180,095,040 |
| Size | 656.3 MB | 171.8 MB |
| Events in quadrant A | 6,398,658 | 1,189,119 |
| Events in quadrant B | 5,983,677 | 1,234,754 |
| Events in quadrant C | 5,609,919 | 1,183,237 |
| Events in quadrant D | 6,623,854 | 1,079,238 |
| Mode SS | |||
|---|---|---|---|
| Quadrant | BADHDUFLAG | Total packets | Discarded packets |
| A | 0 | 224 | 0 |
| B | 0 | 224 | 0 |
| C | 0 | 224 | 0 |
| D | 0 | 224 | 0 |
| Mode M9 | |||
|---|---|---|---|
| Quadrant | BADHDUFLAG | Total packets | Discarded packets |
| A | 0 | 43 | 0 |
| B | 0 | 43 | 0 |
| C | 0 | 43 | 0 |
| D | 0 | 43 | 0 |
| Mode M0 | |||
|---|---|---|---|
| Quadrant | BADHDUFLAG | Total packets | Discarded packets |
| A | 0 | 25925 | 4 |
| B | 0 | 25361 | 3 |
| C | 0 | 23485 | 3 |
| D | 0 | 27491 | 3 |
| Quadrant | Total seconds | Saturated seconds | Saturation percentage |
|---|---|---|---|
| A | 11081 | 222 | 2.003429% |
| B | 11081 | 101 | 0.911470% |
| C | 11081 | 40 | 0.360978% |
| D | 11081 | 258 | 2.328310% |
Noise dominated data is calculated using 1-second bins in cleaned event files. If a bin has >2000 counts, and if more than 50% of those come from <1% of pixels, then it is considered to be noise-dominated and hence unusable.
| Quadrant | # 1 sec bins | Bins with >0 counts | Bins with >2000 counts | High rate bins dominated by noise | Noise dominated (total time) | Noise dominated (detector-on time) | Marked lightcurve |
|---|---|---|---|---|---|---|---|
| A | 15290 | 11084 | 158 | 158 | 1.03% | 1.43% | 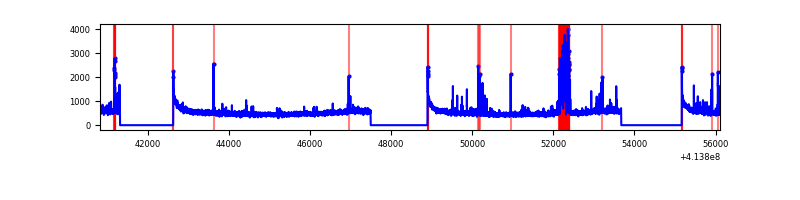 |
| B | 15290 | 11084 | 54 | 54 | 0.35% | 0.49% |  |
| C | 15290 | 11084 | 29 | 29 | 0.19% | 0.26% | 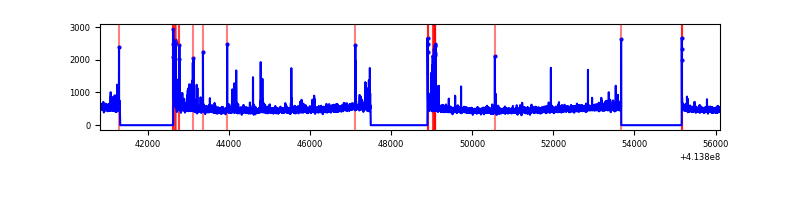 |
| D | 15290 | 11084 | 253 | 253 | 1.65% | 2.28% | 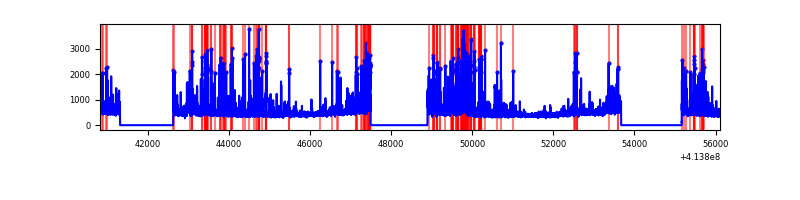 |
Top three noisy pixels from each quadrant. If the there are fewer than three noisy pixels in the level2.evt file, extra rows are filled as -1
| Pixel properties | Quadrant properties | ||||||
|---|---|---|---|---|---|---|---|
| Quadrant | DetID | PixID | Counts | Sigma | Mean | Median | Sigma |
| A | 10 | 83 | 938234 | 3777.54 | 1215 | 1192 | 248.1 |
| A | 14 | 250 | 548708 | 2207.22 | 1215 | 1192 | 248.1 |
| A | 13 | 248 | 64427 | 254.92 | 1215 | 1192 | 248.1 |
| B | 0 | 183 | 290770 | 1238.36 | 1221 | 1187 | 233.8 |
| B | 4 | 170 | 174530 | 741.28 | 1221 | 1187 | 233.8 |
| B | 0 | 190 | 137282 | 581.99 | 1221 | 1187 | 233.8 |
| C | 15 | 214 | 462063 | 1639.43 | 1202 | 1210 | 281.1 |
| C | 14 | 254 | 155903 | 550.3 | 1202 | 1210 | 281.1 |
| C | 15 | 208 | 123884 | 436.4 | 1202 | 1210 | 281.1 |
| D | 1 | 47 | 480631 | 1656.77 | 1188 | 1157 | 289.4 |
| D | 13 | 249 | 272081 | 936.15 | 1188 | 1157 | 289.4 |
| D | 13 | 171 | 244423 | 840.58 | 1188 | 1157 | 289.4 |
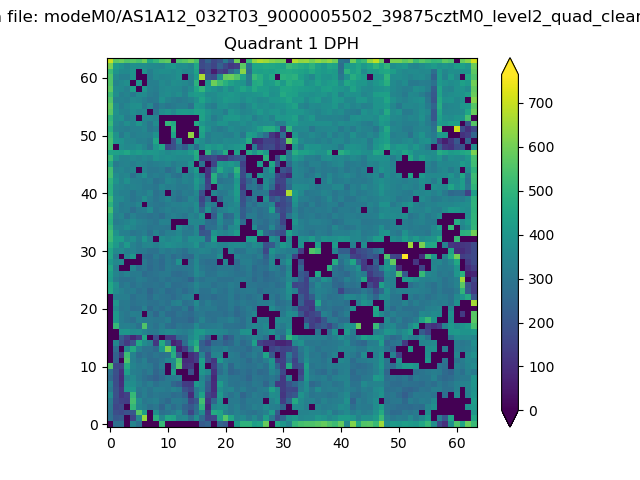
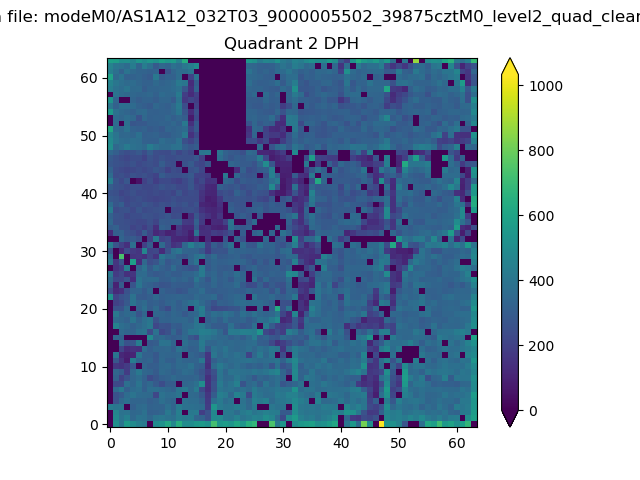
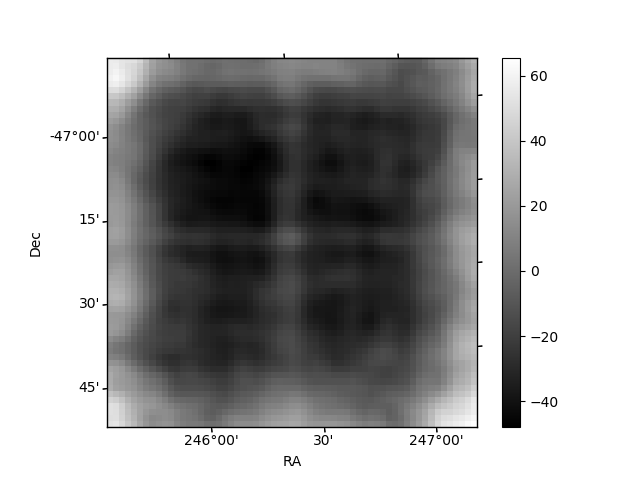
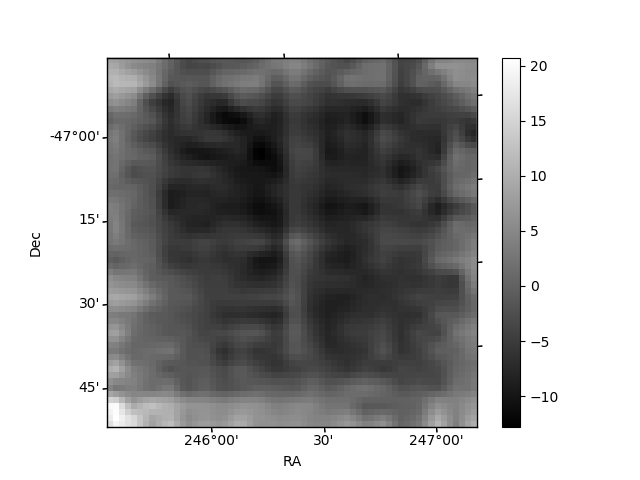
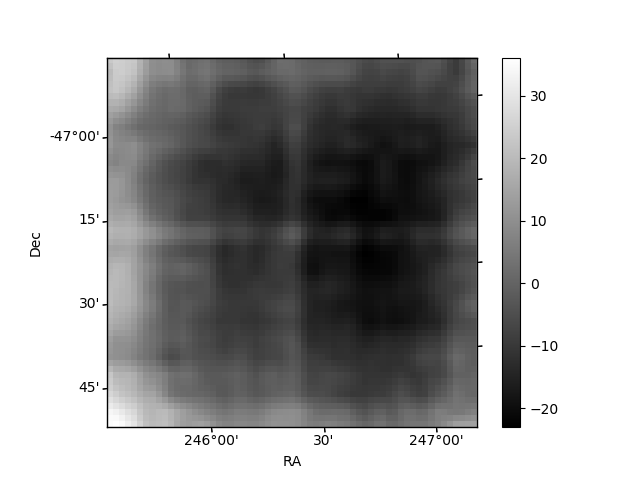
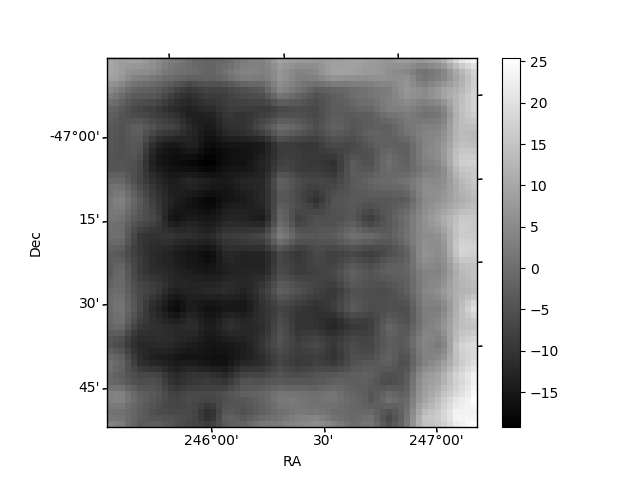
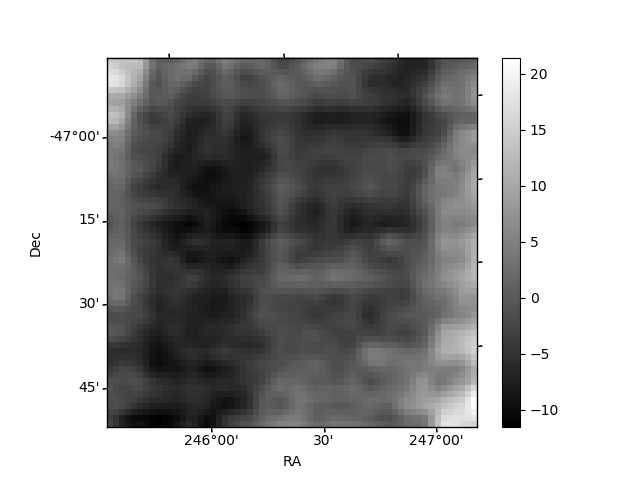
Histogram calculated using DETX and DETY for each event in the final _common_clean file
| Quadrant A | 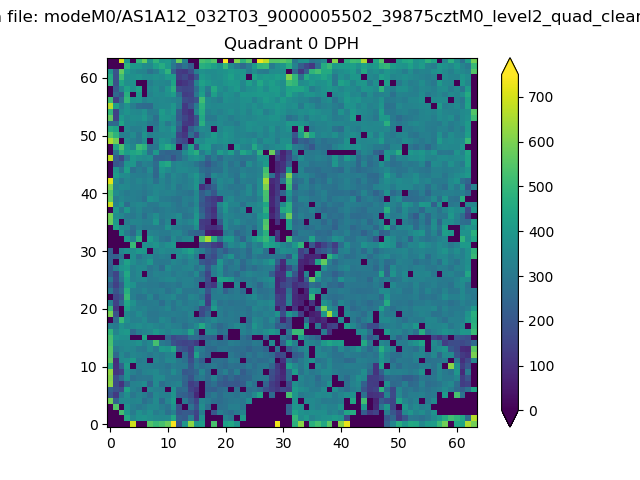 |
 |
Quadrant B |
|---|---|---|---|
| Quadrant D | 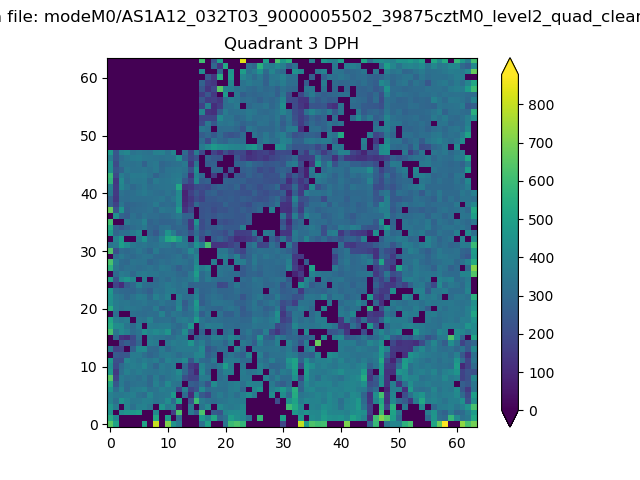 |
 |
Quadrant C |
| Plot type | Count rate plots | Images |
|---|---|---|
| Comparison with Poisson distribution Blue bars denote a histogram of data divided into 1 sec bins. Red curve is a Poisson curve with rate = median count rate of data. |
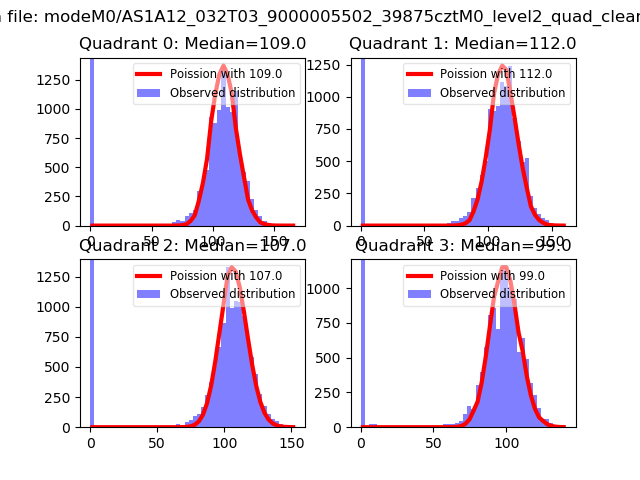 |
 |
| Quadrant-wise count rates Data is divided into 100 sec bins |
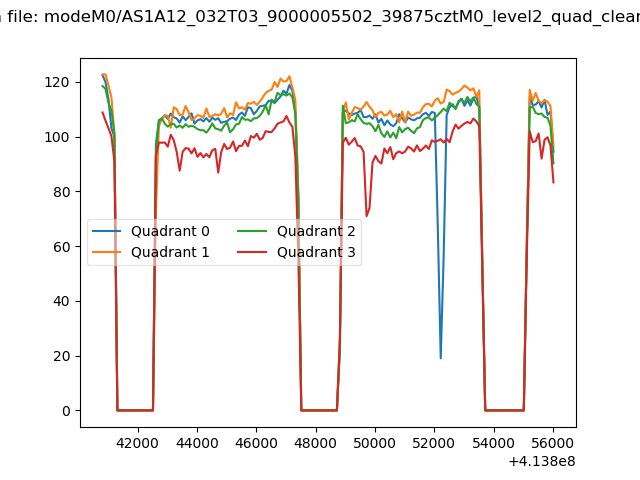 |
|
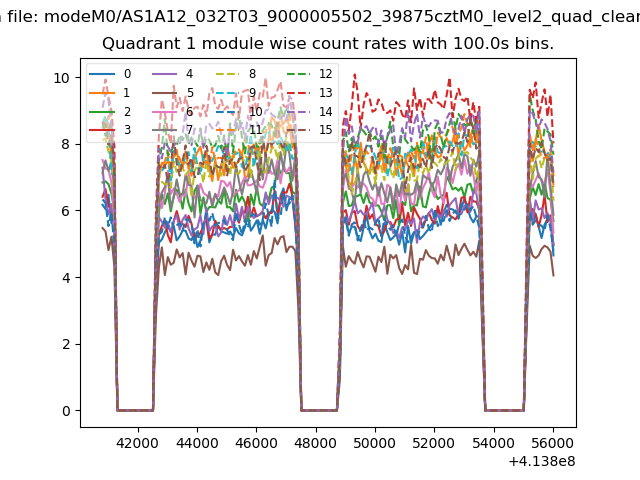
| Module-wise count rates for Quadrant A Data is divided into 100 sec bins |
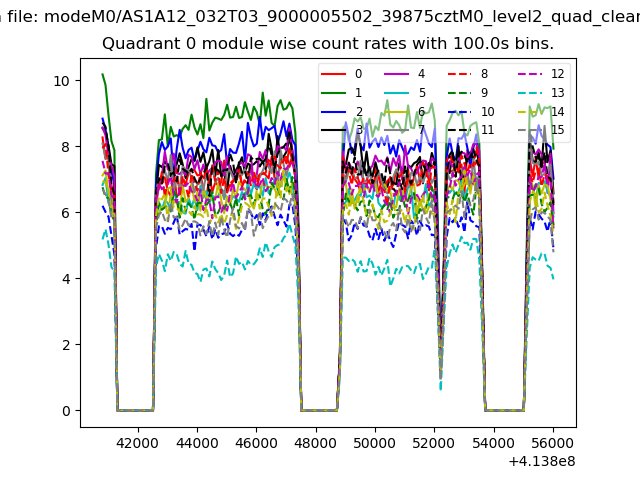 |
 |
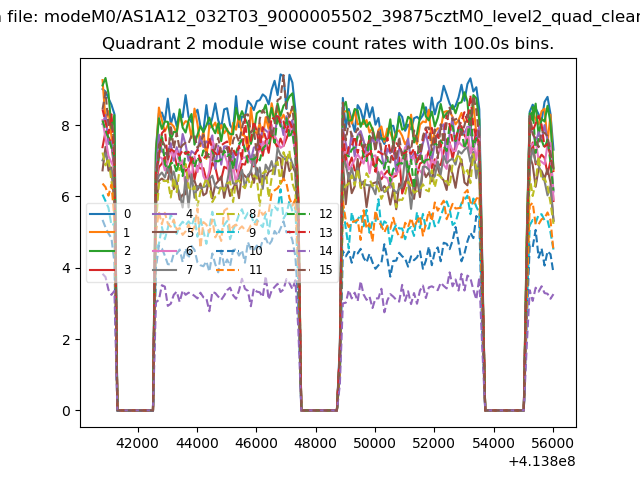
| Module-wise count rates for Quadrant B Data is divided into 100 sec bins |
 |
 |
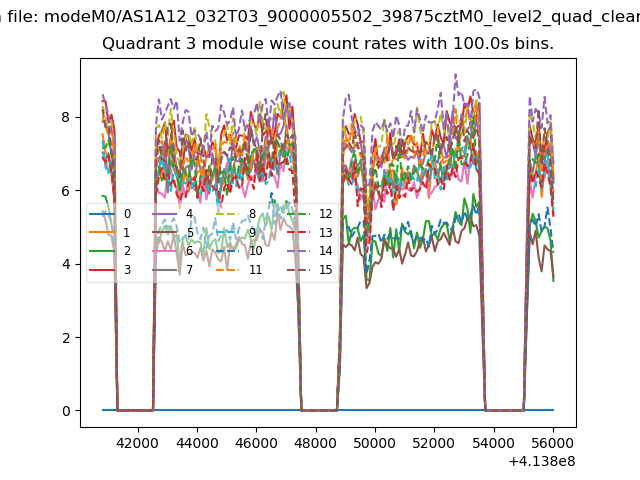
| Module-wise count rates for Quadrant C Data is divided into 100 sec bins |
 |
 |
| Module-wise count rates for Quadrant D Data is divided into 100 sec bins |
 |
 |
| Parameter | Plot |
|---|---|
| CZT HV Monitor | 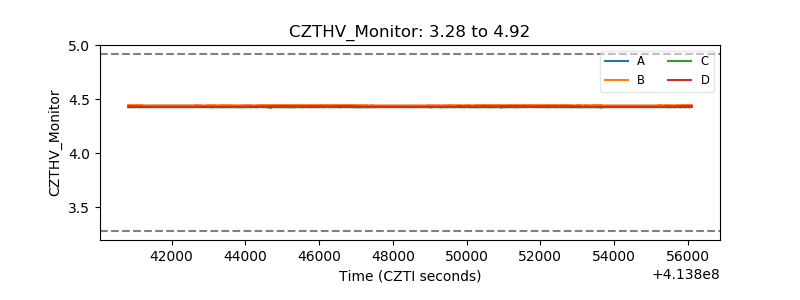 |
| D_VDD | 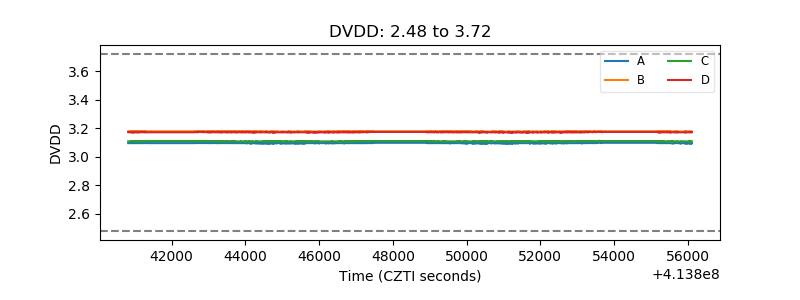 |
| Temperature 1 | 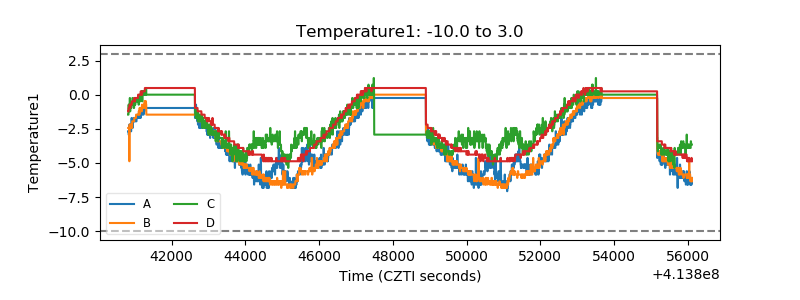 |
| Veto HV Monitor | 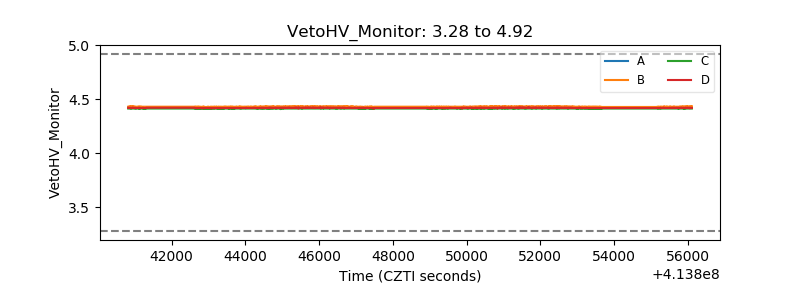 |
| Veto LLD | 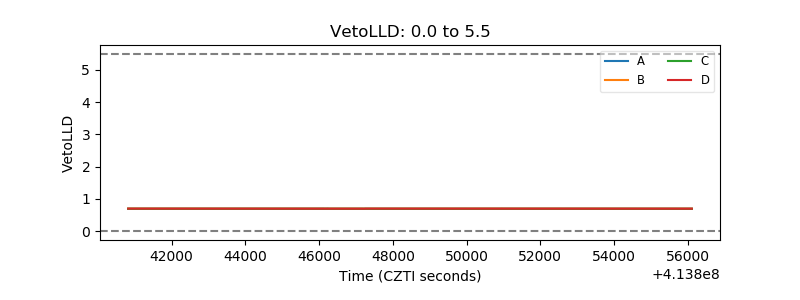 |
| Alpha Counter | 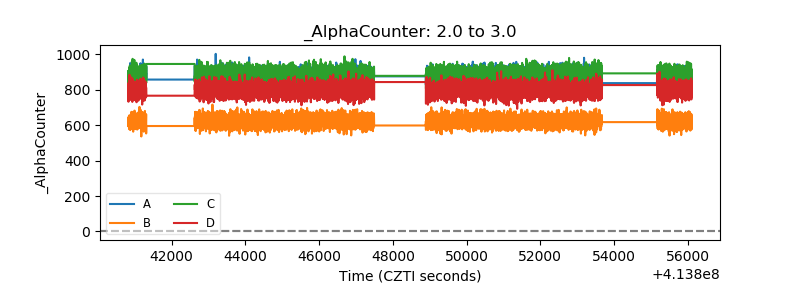 |
| _CPM_Rate | 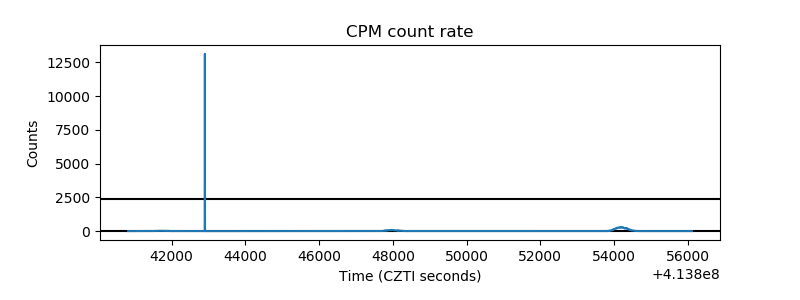 |
| CZT Counter | 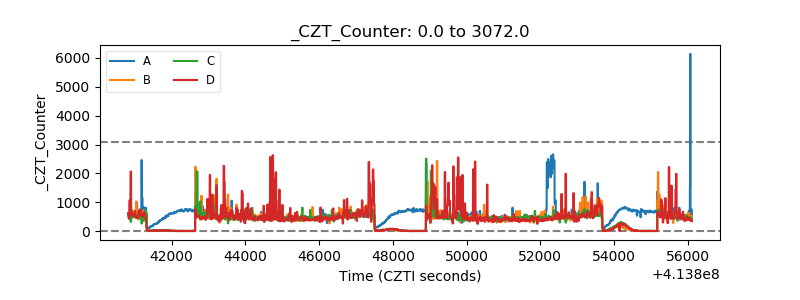 |
| +2.5 Volts monitor |  |
| +5 Volts monitor | 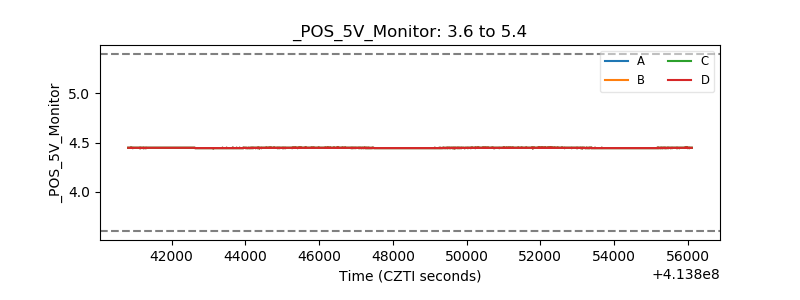 |
| _ROLL_ROT | 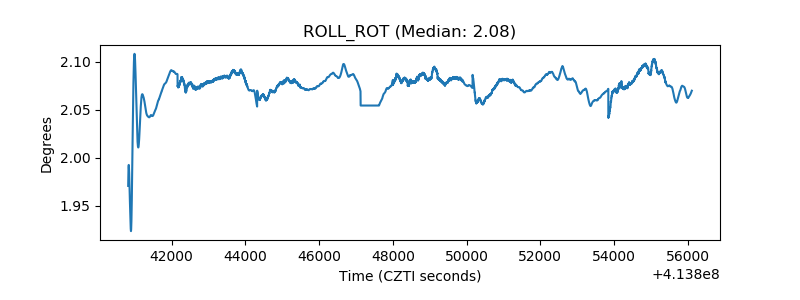 |
| _Roll_DEC | 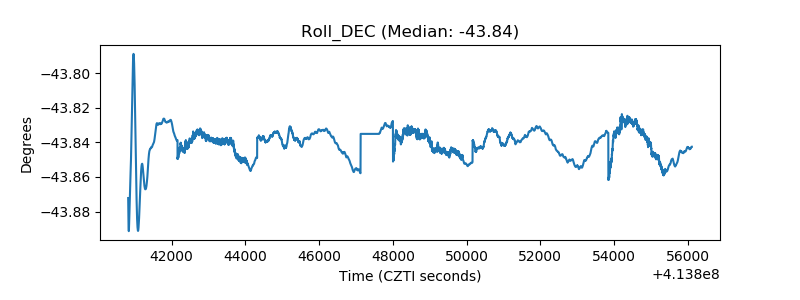 |
| _Roll_RA | 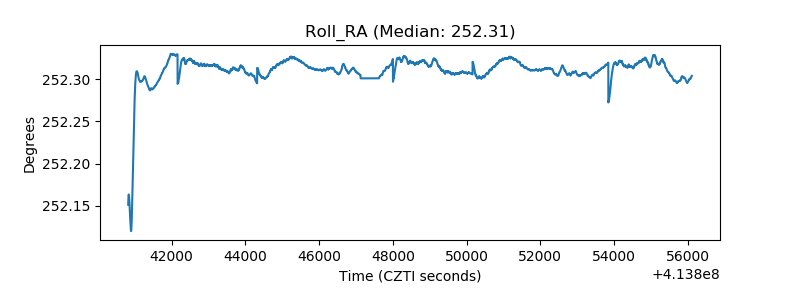 |
| Veto Counter | 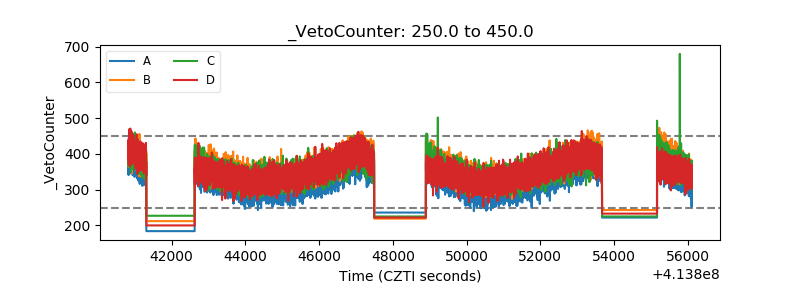 |