| Param | Original file | Final file |
|---|---|---|
| Filename | modeM0/AS1A12_032T03_9000005502_39876cztM0_level2.fits | modeM0/AS1A12_032T03_9000005502_39876cztM0_level2_quad_clean.evt |
| Size (bytes) | 986,022,720 | 253,258,560 |
| Size | 940.3 MB | 241.5 MB |
| Events in quadrant A | 9,344,505 | 1,659,589 |
| Events in quadrant B | 8,441,613 | 1,740,138 |
| Events in quadrant C | 7,790,342 | 1,672,821 |
| Events in quadrant D | 9,709,519 | 1,514,881 |
| Mode SS | |||
|---|---|---|---|
| Quadrant | BADHDUFLAG | Total packets | Discarded packets |
| A | 0 | 318 | 0 |
| B | 0 | 318 | 0 |
| C | 0 | 318 | 0 |
| D | 0 | 318 | 0 |
| Mode M9 | |||
|---|---|---|---|
| Quadrant | BADHDUFLAG | Total packets | Discarded packets |
| A | 0 | 60 | 0 |
| B | 0 | 60 | 0 |
| C | 0 | 60 | 0 |
| D | 0 | 60 | 0 |
| Mode M0 | |||
|---|---|---|---|
| Quadrant | BADHDUFLAG | Total packets | Discarded packets |
| A | 0 | 37662 | 5 |
| B | 0 | 35951 | 4 |
| C | 0 | 32801 | 4 |
| D | 0 | 40012 | 4 |
| Quadrant | Total seconds | Saturated seconds | Saturation percentage |
|---|---|---|---|
| A | 15668 | 487 | 3.108246% |
| B | 15668 | 176 | 1.123309% |
| C | 15668 | 47 | 0.299974% |
| D | 15668 | 443 | 2.827419% |
Noise dominated data is calculated using 1-second bins in cleaned event files. If a bin has >2000 counts, and if more than 50% of those come from <1% of pixels, then it is considered to be noise-dominated and hence unusable.
| Quadrant | # 1 sec bins | Bins with >0 counts | Bins with >2000 counts | High rate bins dominated by noise | Noise dominated (total time) | Noise dominated (detector-on time) | Marked lightcurve |
|---|---|---|---|---|---|---|---|
| A | 21520 | 15672 | 343 | 343 | 1.59% | 2.19% |  |
| B | 21520 | 15672 | 115 | 115 | 0.53% | 0.73% | 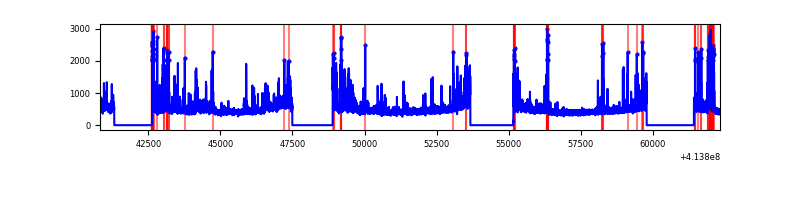 |
| C | 21520 | 15672 | 33 | 33 | 0.15% | 0.21% |  |
| D | 21520 | 15672 | 394 | 394 | 1.83% | 2.51% | 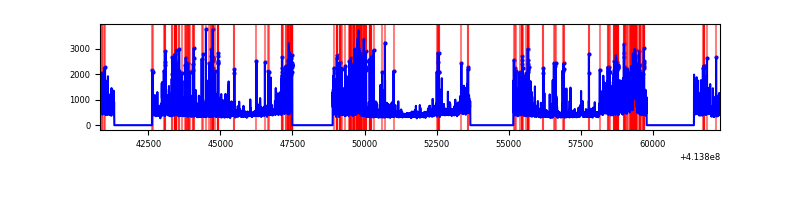 |
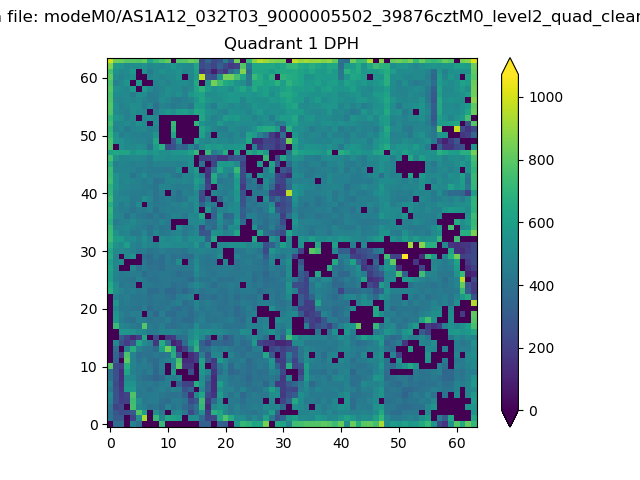
Top three noisy pixels from each quadrant. If the there are fewer than three noisy pixels in the level2.evt file, extra rows are filled as -1
| Pixel properties | Quadrant properties | ||||||
|---|---|---|---|---|---|---|---|
| Quadrant | DetID | PixID | Counts | Sigma | Mean | Median | Sigma |
| A | 10 | 83 | 1269976 | 3681.48 | 1700 | 1666 | 344.5 |
| A | 14 | 250 | 1182973 | 3428.94 | 1700 | 1666 | 344.5 |
| A | 13 | 248 | 114412 | 327.26 | 1700 | 1666 | 344.5 |
| B | 0 | 183 | 495336 | 1503.31 | 1721 | 1675 | 328.4 |
| B | 4 | 170 | 178221 | 537.62 | 1721 | 1675 | 328.4 |
| B | 0 | 190 | 168707 | 508.65 | 1721 | 1675 | 328.4 |
| C | 15 | 214 | 648772 | 1634.17 | 1699 | 1715 | 396.0 |
| C | 14 | 254 | 167113 | 417.72 | 1699 | 1715 | 396.0 |
| C | 15 | 208 | 126396 | 314.89 | 1699 | 1715 | 396.0 |
| D | 1 | 47 | 648579 | 1577.31 | 1679 | 1634 | 410.2 |
| D | 12 | 233 | 378613 | 919.11 | 1679 | 1634 | 410.2 |
| D | 13 | 249 | 365103 | 886.17 | 1679 | 1634 | 410.2 |
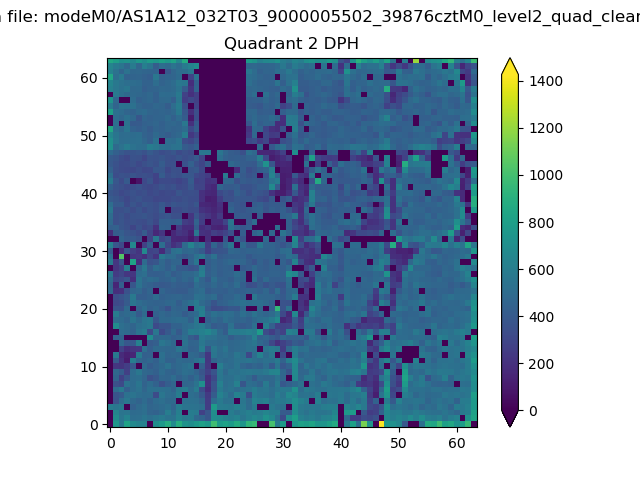
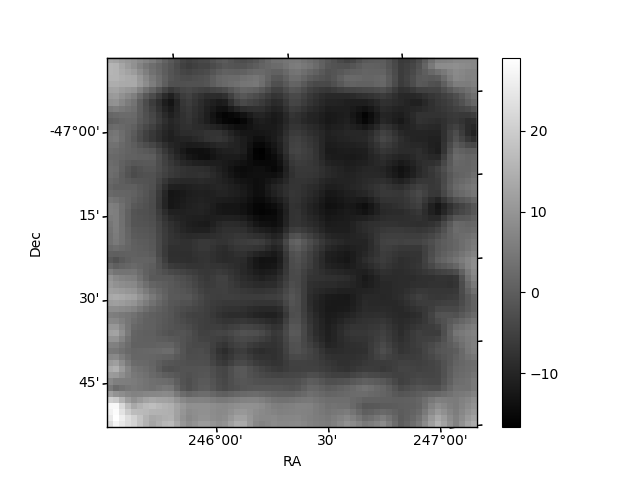
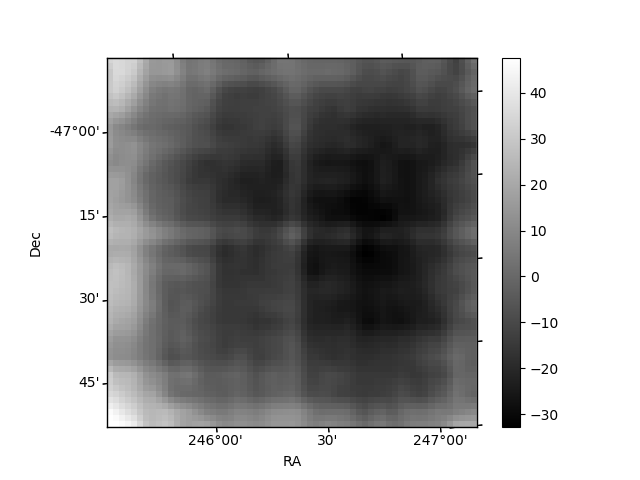
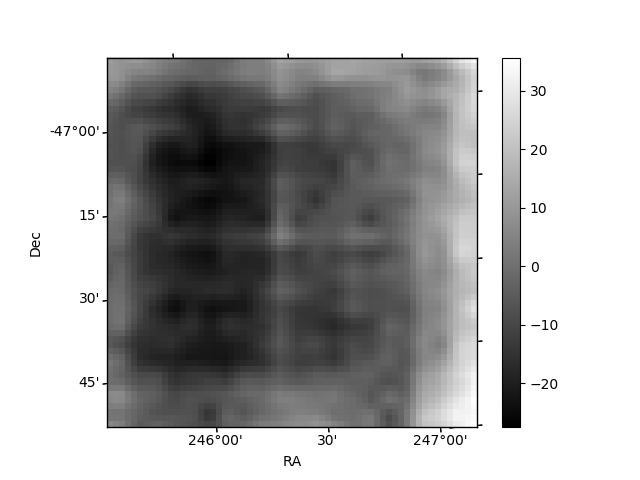
Histogram calculated using DETX and DETY for each event in the final _common_clean file
| Quadrant A | 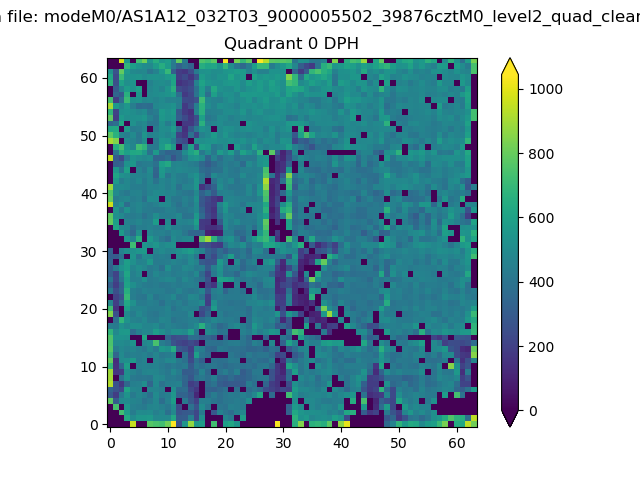 |
 |
Quadrant B |
|---|---|---|---|
| Quadrant D | 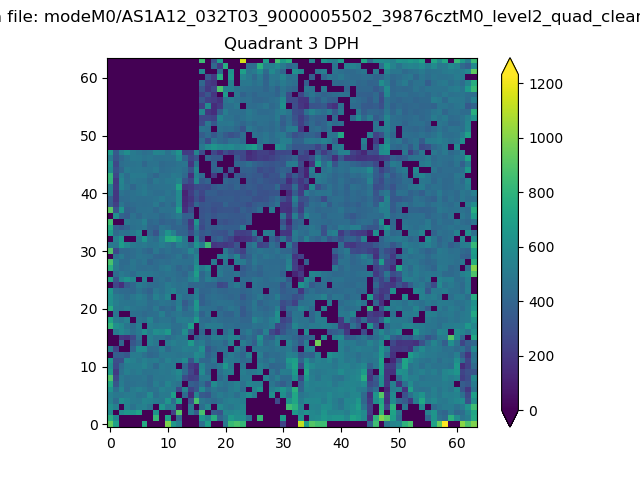 |
 |
Quadrant C |
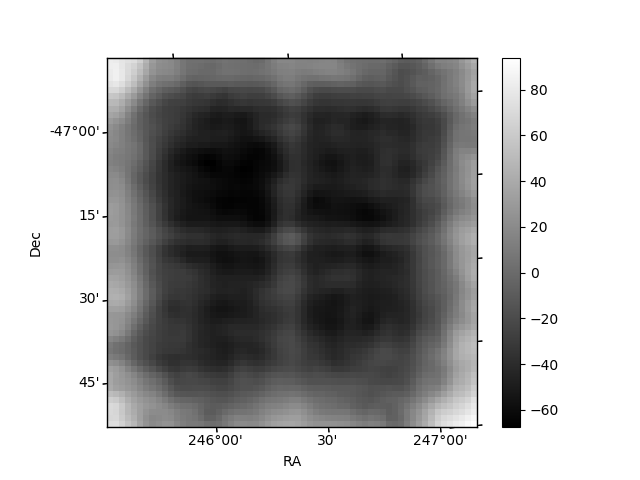
| Plot type | Count rate plots | Images |
|---|---|---|
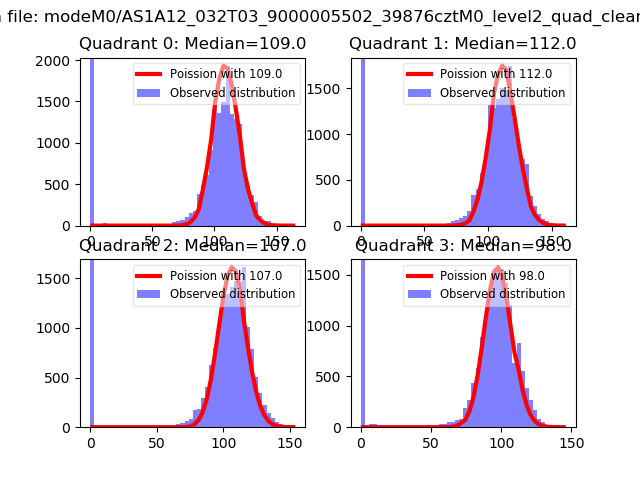
| Comparison with Poisson distribution Blue bars denote a histogram of data divided into 1 sec bins. Red curve is a Poisson curve with rate = median count rate of data. |
 |
 |
| Quadrant-wise count rates Data is divided into 100 sec bins |
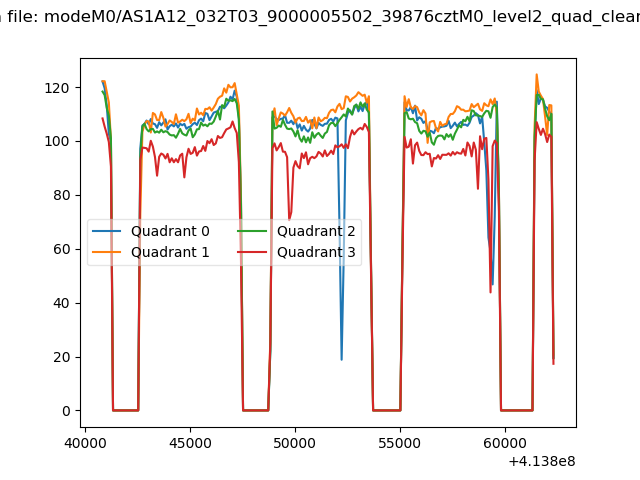 |
|
| Module-wise count rates for Quadrant A Data is divided into 100 sec bins |
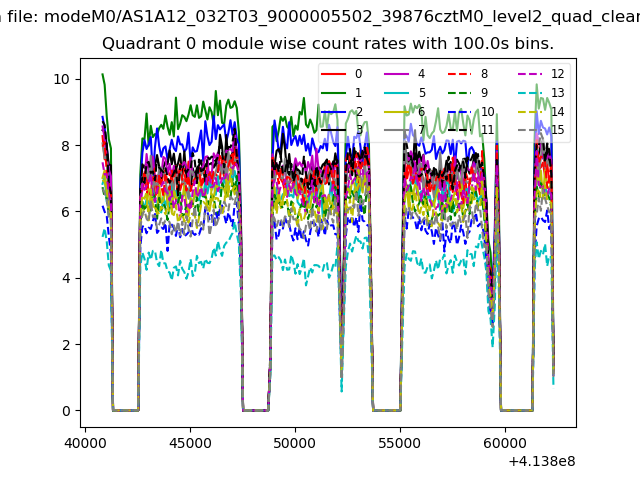 |
 |
| Module-wise count rates for Quadrant B Data is divided into 100 sec bins |
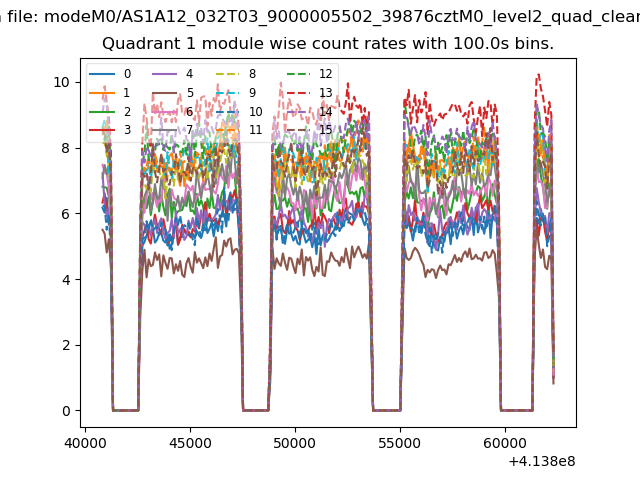 |
 |
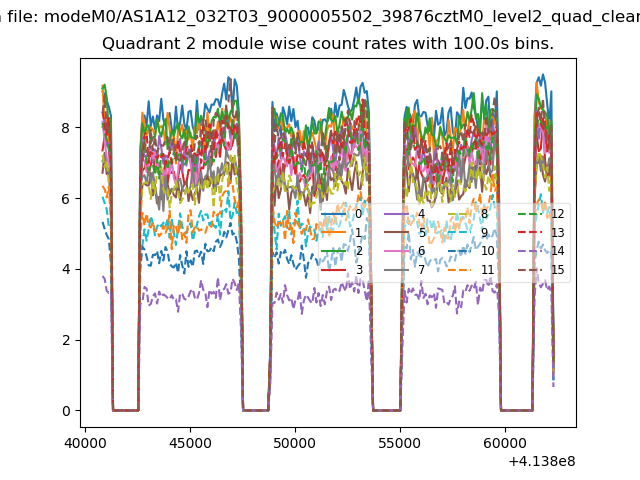
| Module-wise count rates for Quadrant C Data is divided into 100 sec bins |
 |
 |
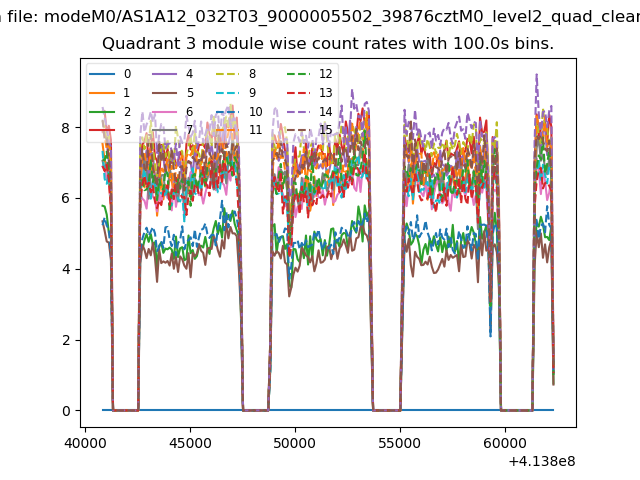
| Module-wise count rates for Quadrant D Data is divided into 100 sec bins |
 |
 |
| Parameter | Plot |
|---|---|
| CZT HV Monitor | 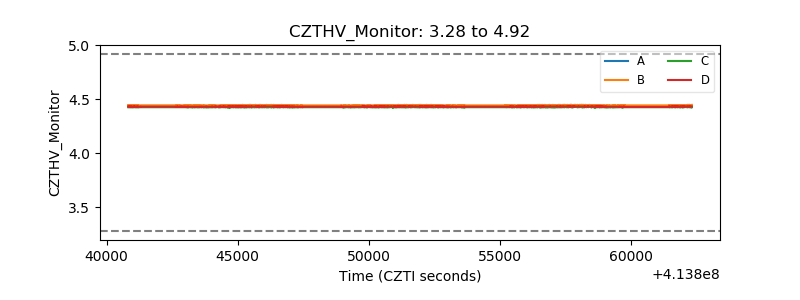 |
| D_VDD | 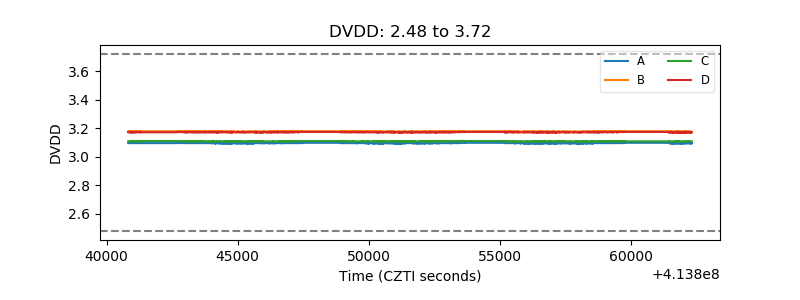 |
| Temperature 1 | 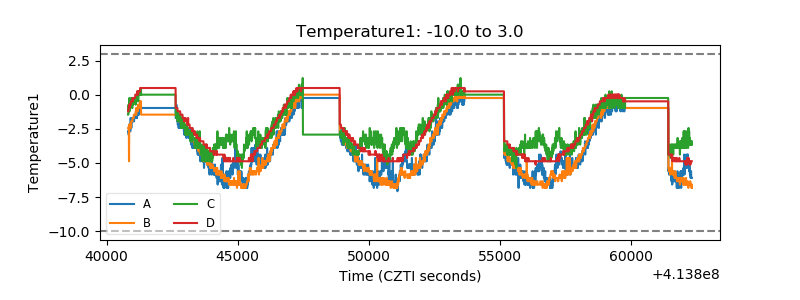 |
| Veto HV Monitor | 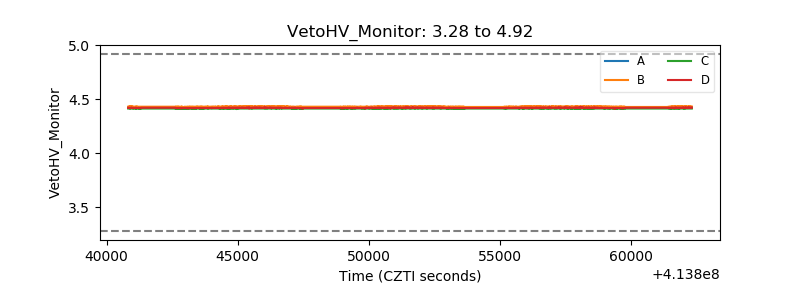 |
| Veto LLD | 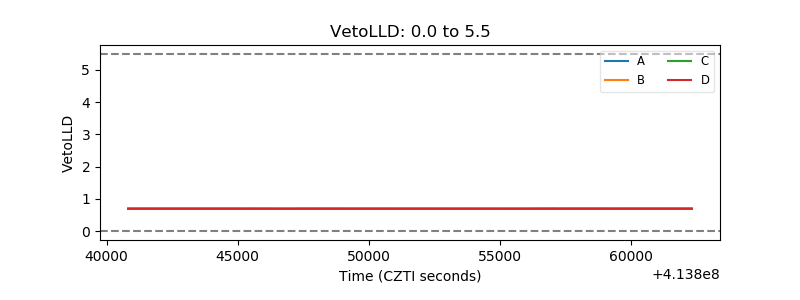 |
| Alpha Counter | 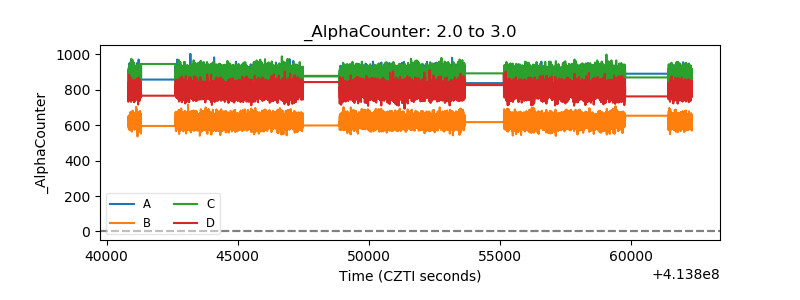 |
| _CPM_Rate | 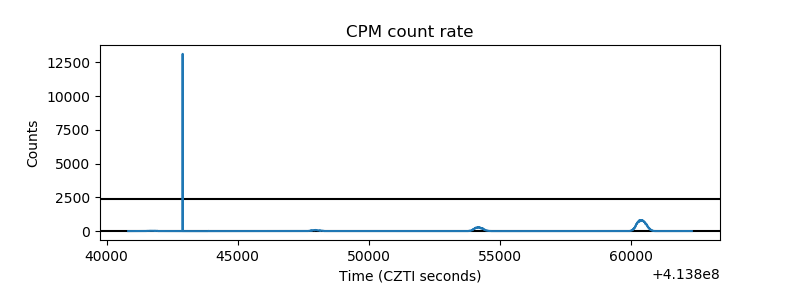 |
| CZT Counter | 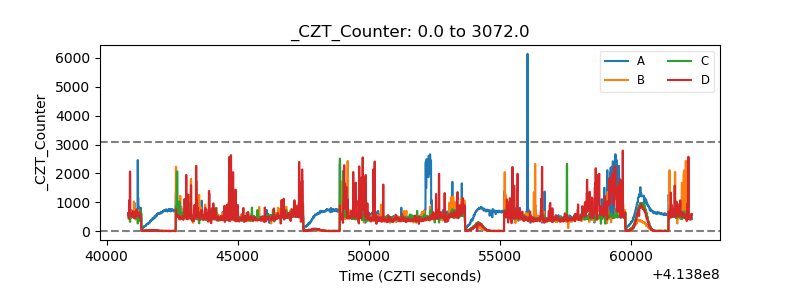 |
| +2.5 Volts monitor |  |
| +5 Volts monitor |  |
| _ROLL_ROT | 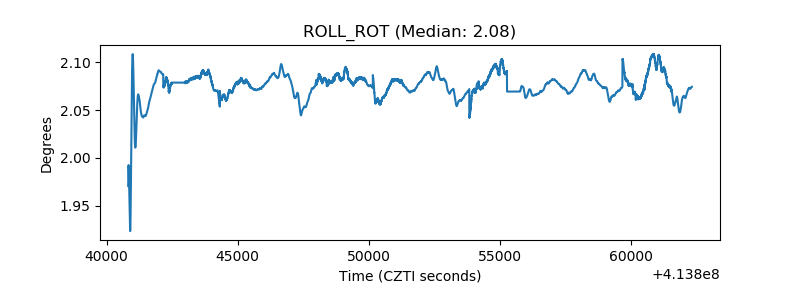 |
| _Roll_DEC |  |
| _Roll_RA | 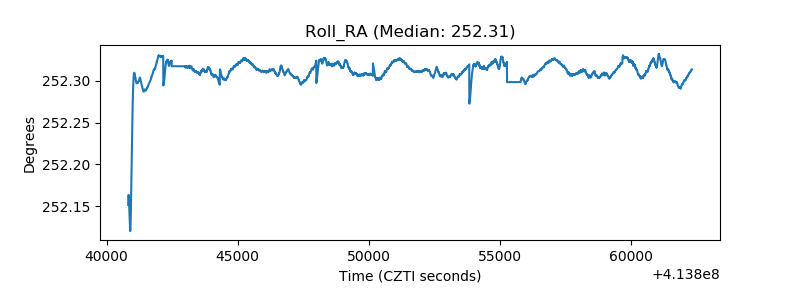 |
| Veto Counter | 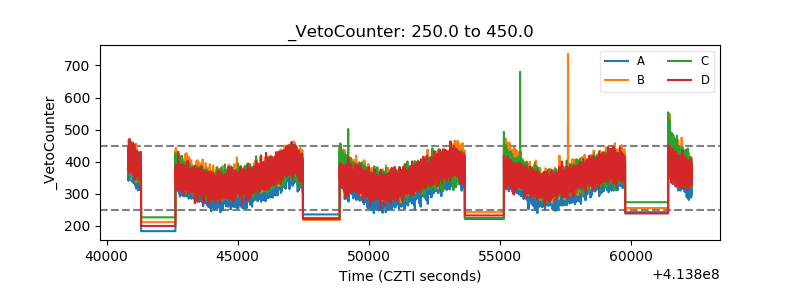 |