| Param | Original file | Final file |
|---|---|---|
| Filename | modeM0/AS1A12_032T03_9000005502_39878cztM0_level2.fits | modeM0/AS1A12_032T03_9000005502_39878cztM0_level2_quad_clean.evt |
| Size (bytes) | 337,872,960 | 90,757,440 |
| Size | 322.2 MB | 86.6 MB |
| Events in quadrant A | 2,937,441 | 606,007 |
| Events in quadrant B | 2,777,991 | 623,154 |
| Events in quadrant C | 2,680,011 | 602,497 |
| Events in quadrant D | 3,695,324 | 542,550 |
| Mode SS | |||
|---|---|---|---|
| Quadrant | BADHDUFLAG | Total packets | Discarded packets |
| A | 0 | 108 | 0 |
| B | 0 | 108 | 0 |
| C | 0 | 108 | 0 |
| D | 0 | 108 | 0 |
| Mode M9 | |||
|---|---|---|---|
| Quadrant | BADHDUFLAG | Total packets | Discarded packets |
| A | 0 | 26 | 0 |
| B | 0 | 26 | 0 |
| C | 0 | 26 | 0 |
| D | 0 | 27 | 0 |
| Mode M0 | |||
|---|---|---|---|
| Quadrant | BADHDUFLAG | Total packets | Discarded packets |
| A | 0 | 12085 | 3 |
| B | 0 | 11893 | 2 |
| C | 0 | 11175 | 2 |
| D | 0 | 14734 | 2 |
| Quadrant | Total seconds | Saturated seconds | Saturation percentage |
|---|---|---|---|
| A | 5344 | 41 | 0.767216% |
| B | 5344 | 60 | 1.122754% |
| C | 5344 | 15 | 0.280689% |
| D | 5344 | 153 | 2.863024% |
Noise dominated data is calculated using 1-second bins in cleaned event files. If a bin has >2000 counts, and if more than 50% of those come from <1% of pixels, then it is considered to be noise-dominated and hence unusable.
| Quadrant | # 1 sec bins | Bins with >0 counts | Bins with >2000 counts | High rate bins dominated by noise | Noise dominated (total time) | Noise dominated (detector-on time) | Marked lightcurve |
|---|---|---|---|---|---|---|---|
| A | 7077 | 5345 | 19 | 19 | 0.27% | 0.36% | 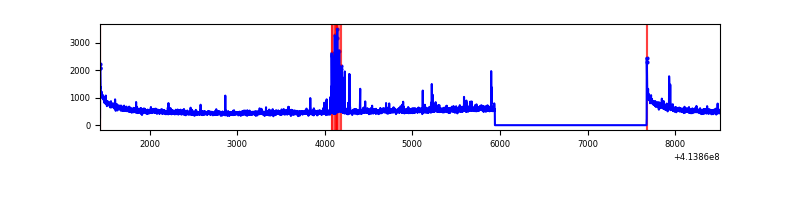 |
| B | 7077 | 5345 | 55 | 55 | 0.78% | 1.03% | 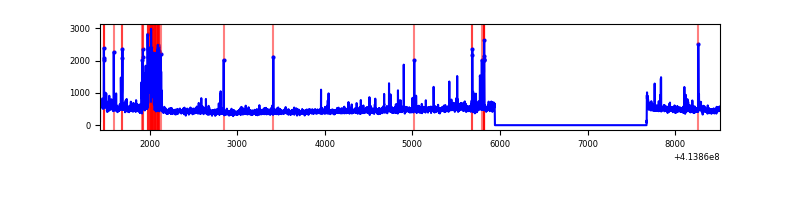 |
| C | 7077 | 5345 | 15 | 15 | 0.21% | 0.28% | 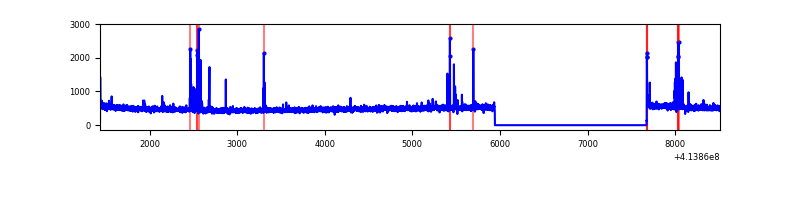 |
| D | 7077 | 5345 | 151 | 151 | 2.13% | 2.83% | 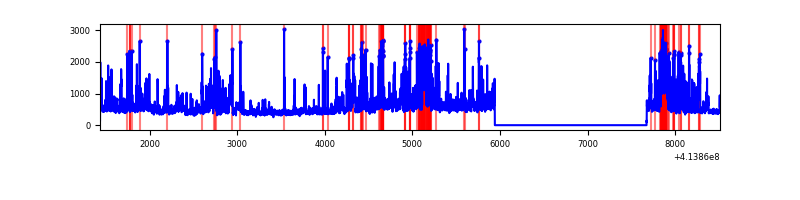 |
Top three noisy pixels from each quadrant. If the there are fewer than three noisy pixels in the level2.evt file, extra rows are filled as -1
| Pixel properties | Quadrant properties | ||||||
|---|---|---|---|---|---|---|---|
| Quadrant | DetID | PixID | Counts | Sigma | Mean | Median | Sigma |
| A | 10 | 83 | 465654 | 3831.12 | 593 | 580 | 121.4 |
| A | 14 | 250 | 131187 | 1075.9 | 593 | 580 | 121.4 |
| A | 2 | 79 | 14377 | 113.66 | 593 | 580 | 121.4 |
| B | 0 | 183 | 179756 | 1555.3 | 594 | 577 | 115.2 |
| B | 0 | 230 | 75874 | 653.59 | 594 | 577 | 115.2 |
| B | 5 | 172 | 33693 | 287.45 | 594 | 577 | 115.2 |
| C | 15 | 214 | 224641 | 1631.29 | 591 | 595 | 137.3 |
| C | 14 | 254 | 81175 | 586.71 | 591 | 595 | 137.3 |
| C | 1 | 16 | 32233 | 230.36 | 591 | 595 | 137.3 |
| D | 1 | 47 | 756118 | 5280.76 | 582 | 566 | 143.1 |
| D | 12 | 227 | 320194 | 2233.97 | 582 | 566 | 143.1 |
| D | 13 | 171 | 90573 | 629.08 | 582 | 566 | 143.1 |
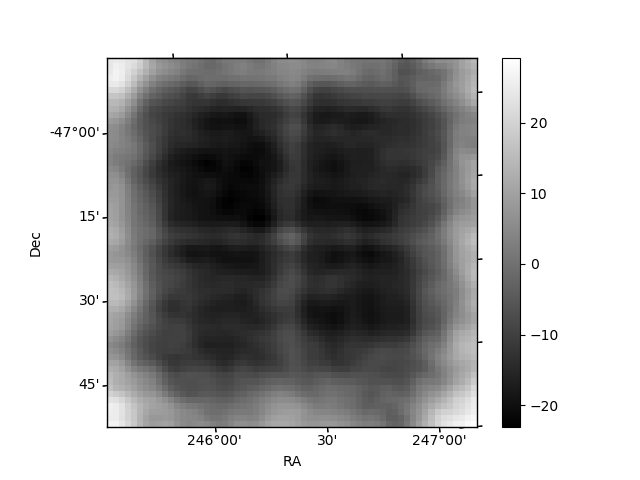
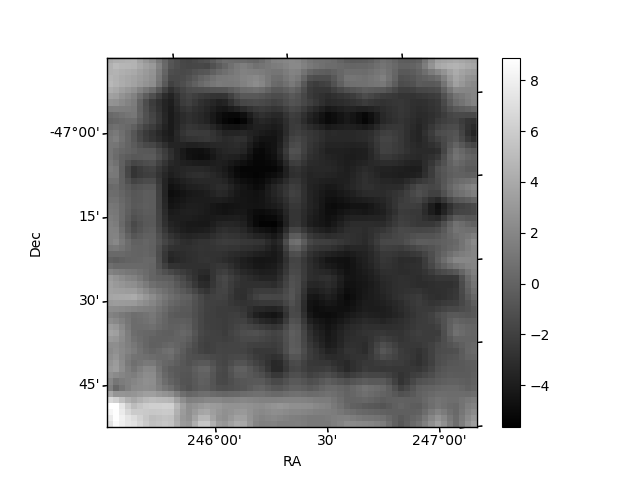
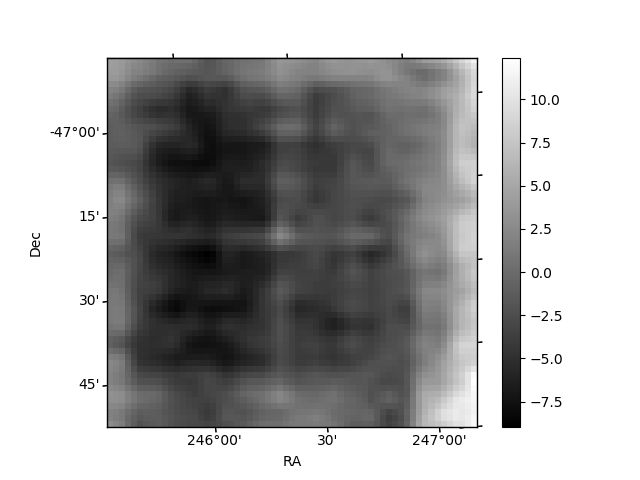
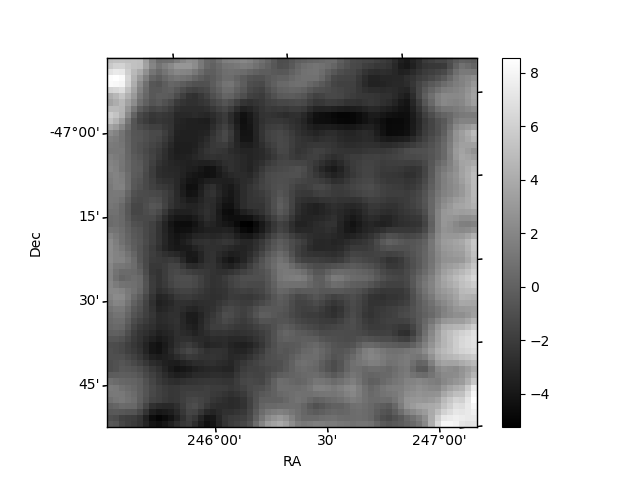
Histogram calculated using DETX and DETY for each event in the final _common_clean file
| Quadrant A | 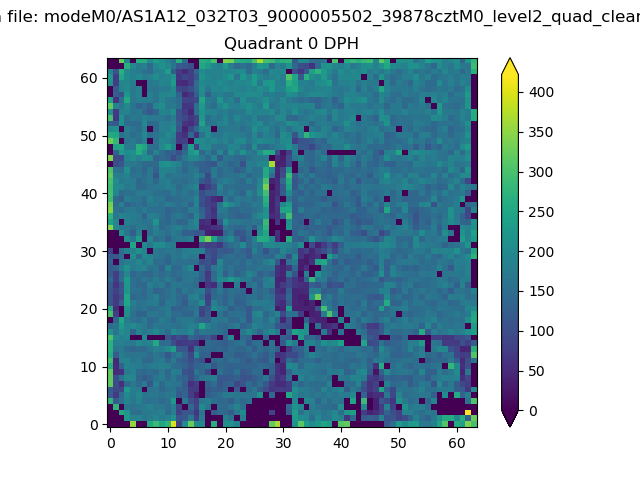 |
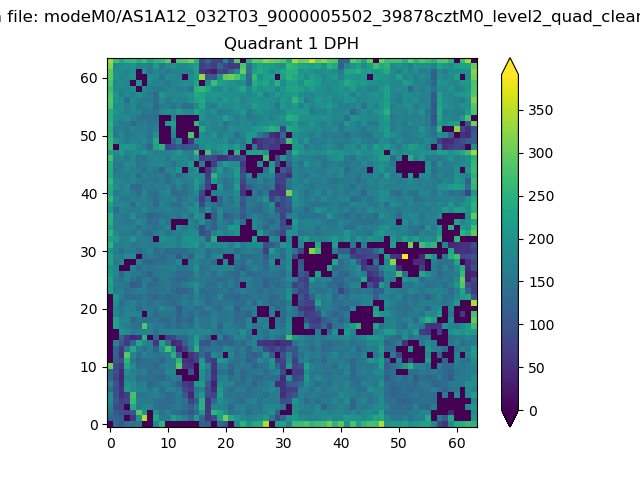 |
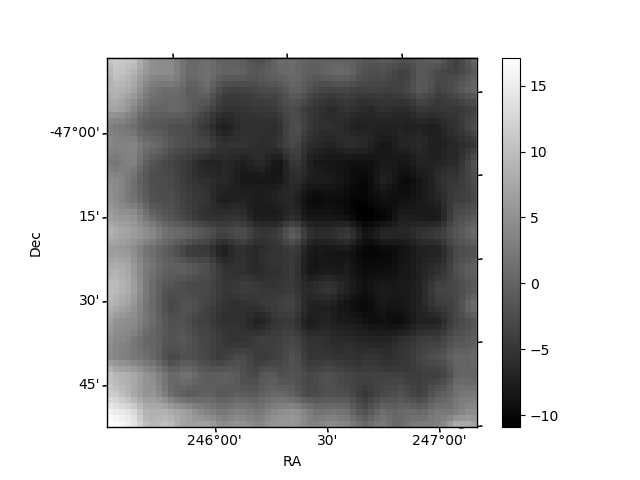
Quadrant B |
|---|---|---|---|
| Quadrant D | 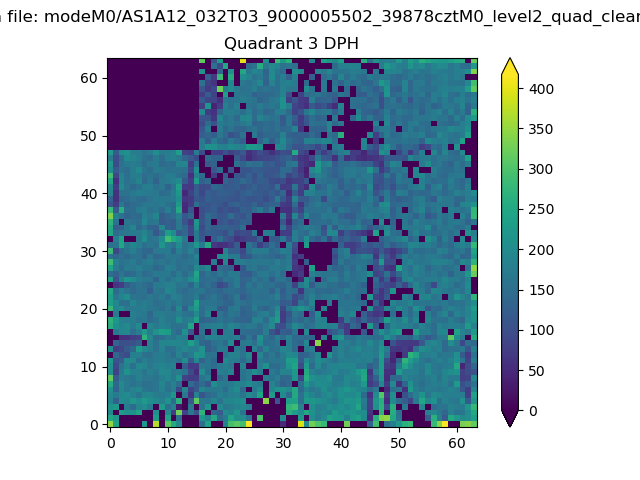 |
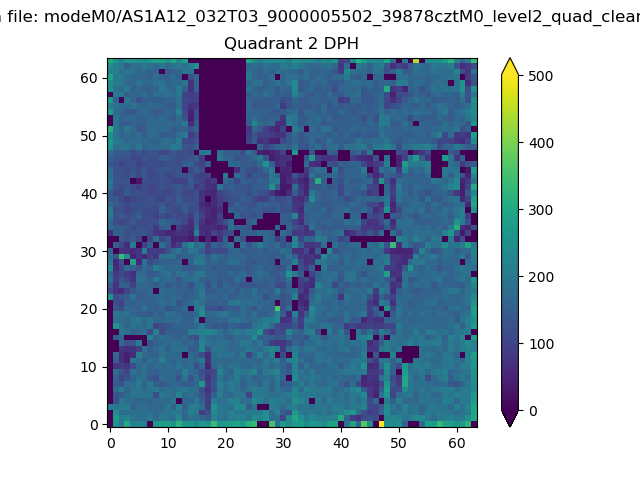 |
Quadrant C |
| Plot type | Count rate plots | Images |
|---|---|---|
| Comparison with Poisson distribution Blue bars denote a histogram of data divided into 1 sec bins. Red curve is a Poisson curve with rate = median count rate of data. |
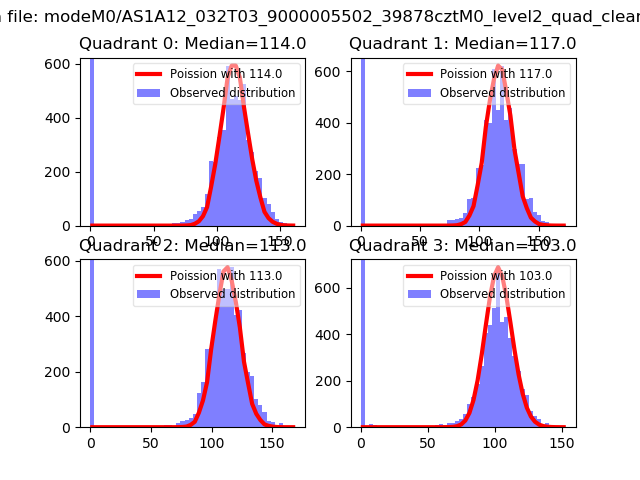 |
 |
| Quadrant-wise count rates Data is divided into 100 sec bins |
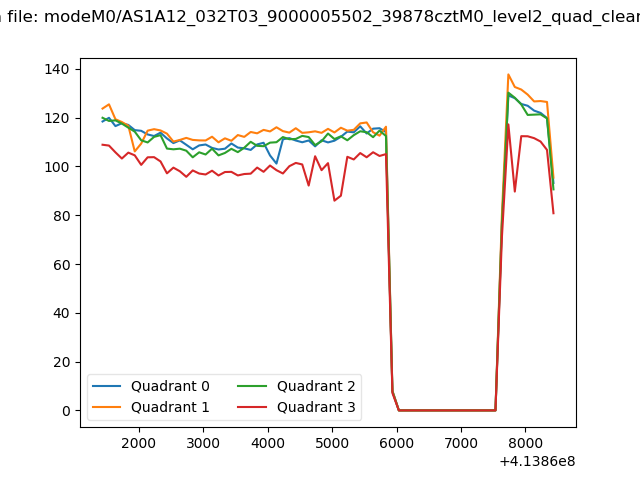 |
|
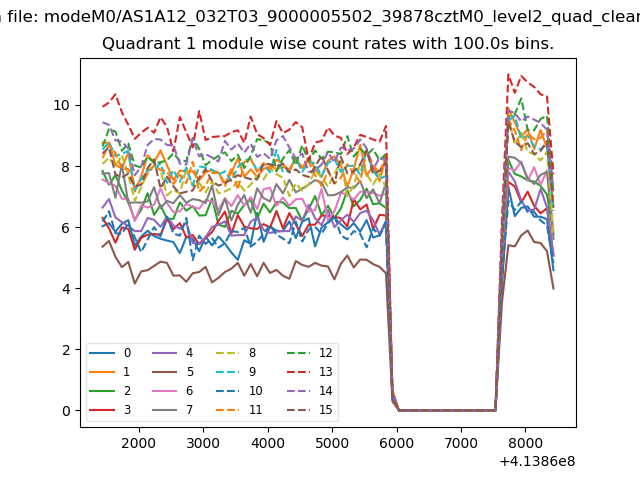
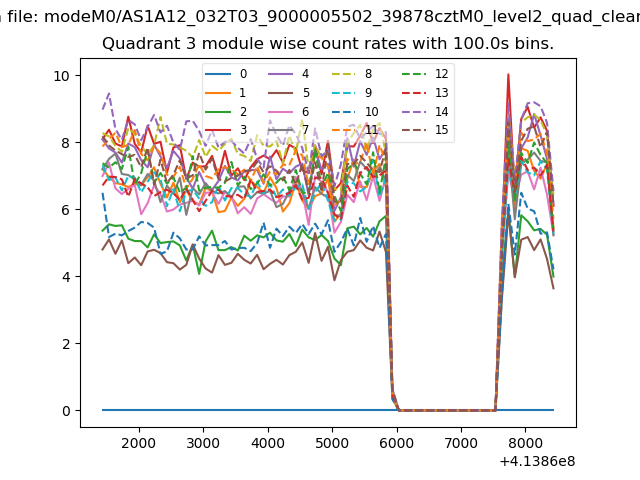
| Module-wise count rates for Quadrant A Data is divided into 100 sec bins |
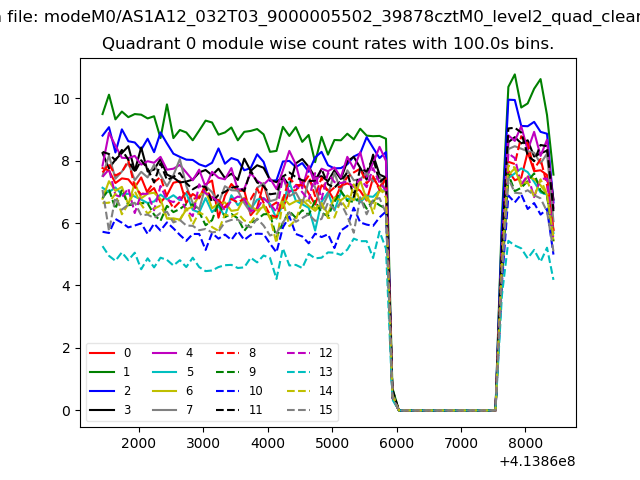 |
 |
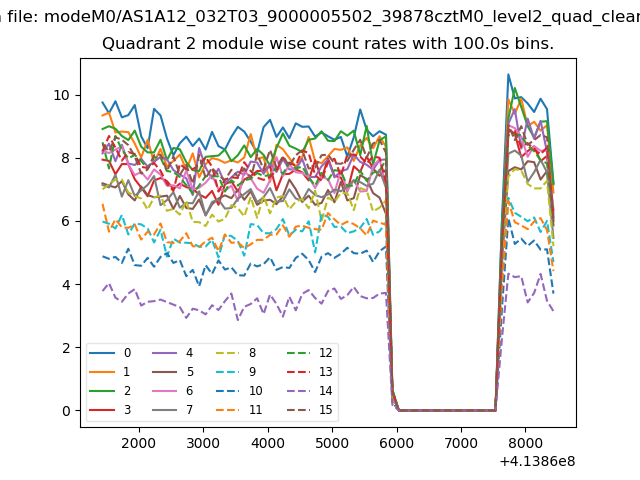
| Module-wise count rates for Quadrant B Data is divided into 100 sec bins |
 |
 |
| Module-wise count rates for Quadrant C Data is divided into 100 sec bins |
 |
 |
| Module-wise count rates for Quadrant D Data is divided into 100 sec bins |
 |
 |
| Parameter | Plot |
|---|---|
| CZT HV Monitor | 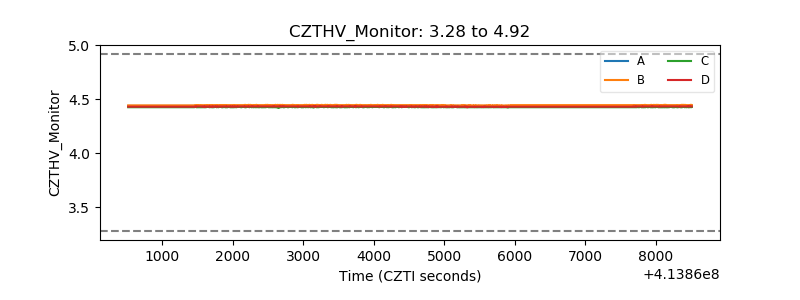 |
| D_VDD | 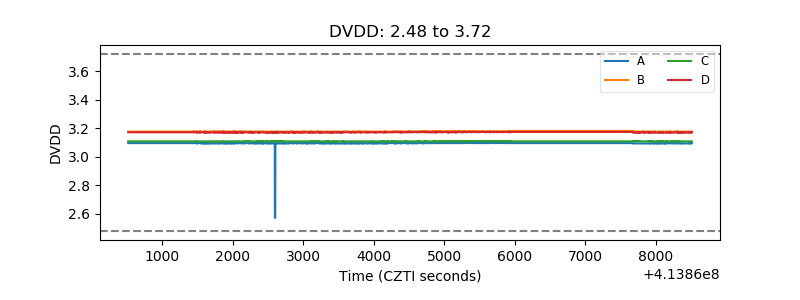 |
| Temperature 1 | 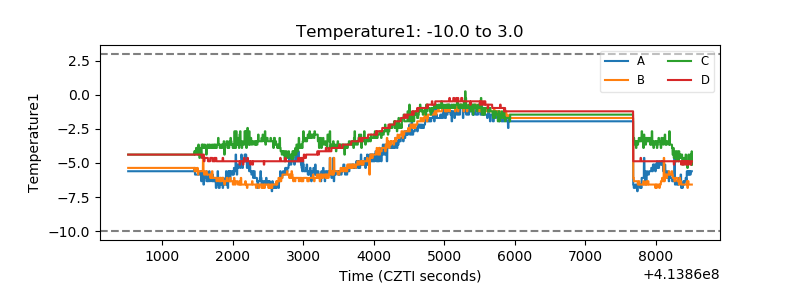 |
| Veto HV Monitor | 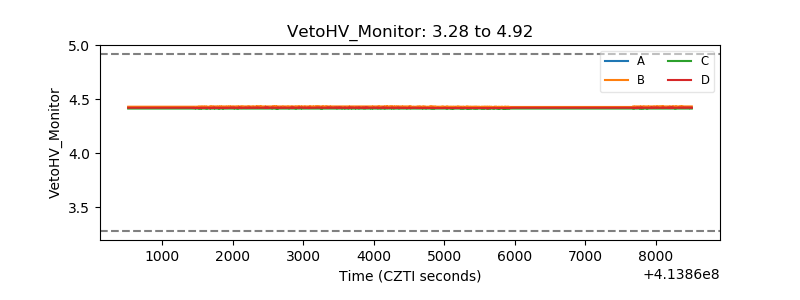 |
| Veto LLD | 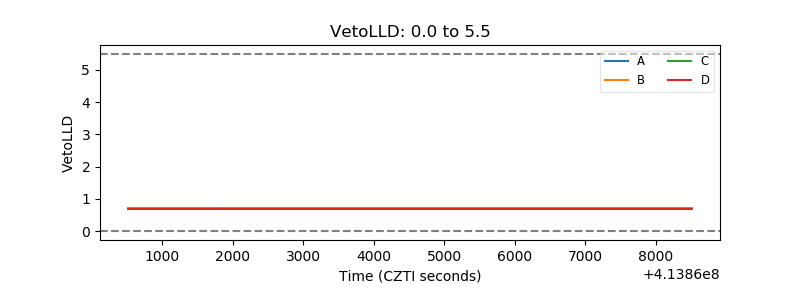 |
| Alpha Counter | 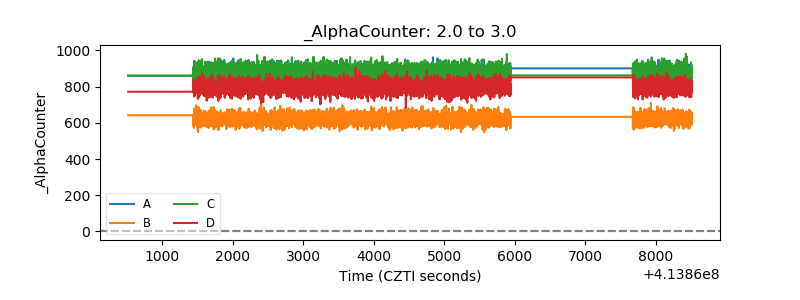 |
| _CPM_Rate | 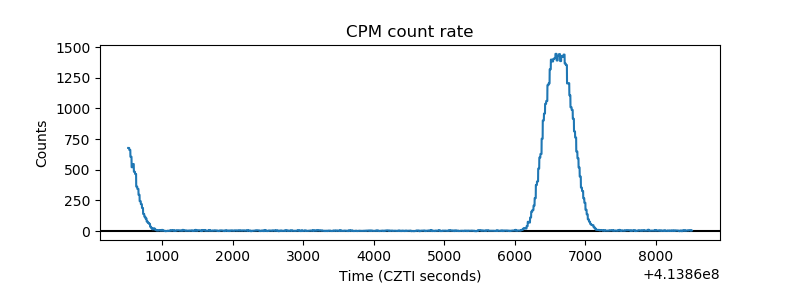 |
| CZT Counter | 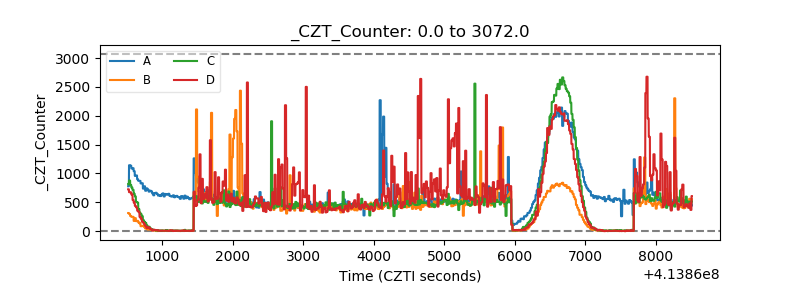 |
| +2.5 Volts monitor | 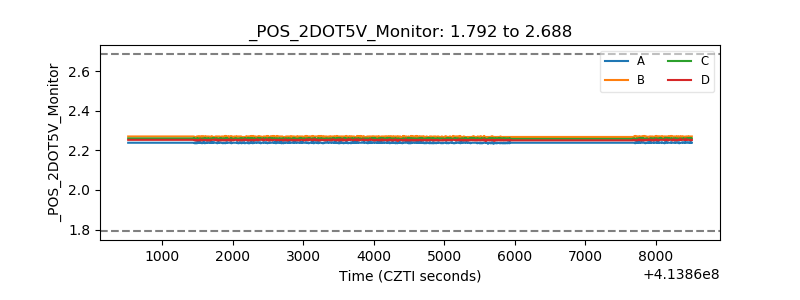 |
| +5 Volts monitor | 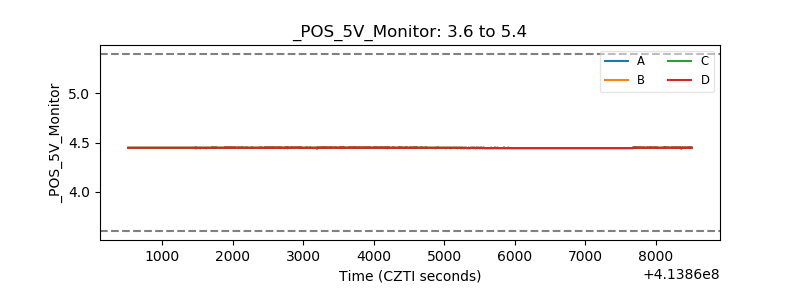 |
| _ROLL_ROT | 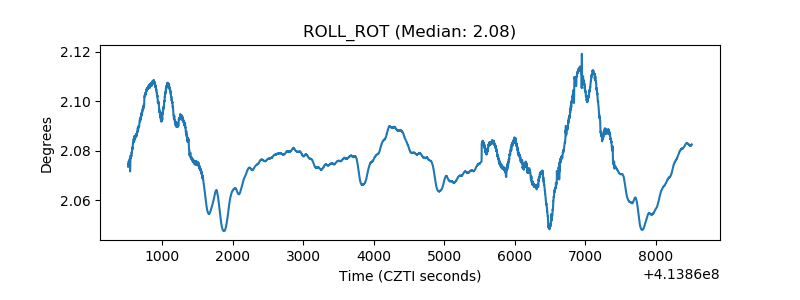 |
| _Roll_DEC | 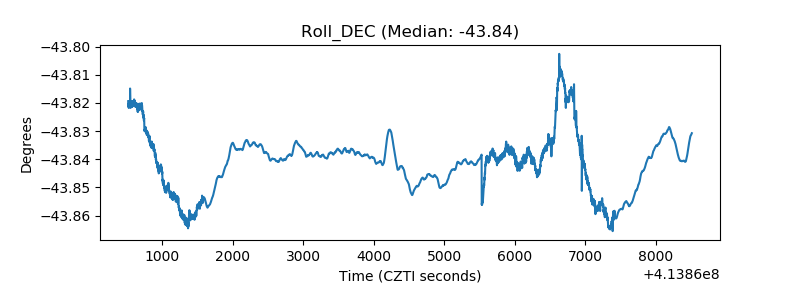 |
| _Roll_RA | 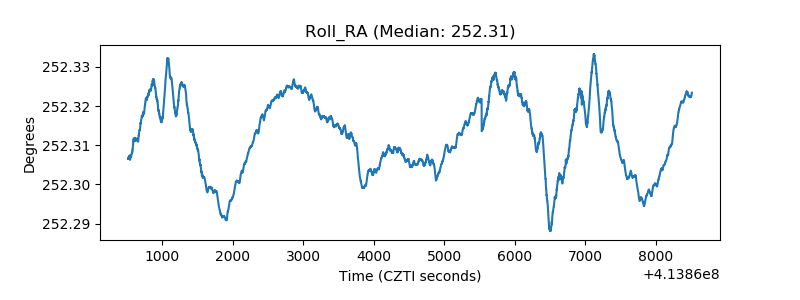 |
| Veto Counter | 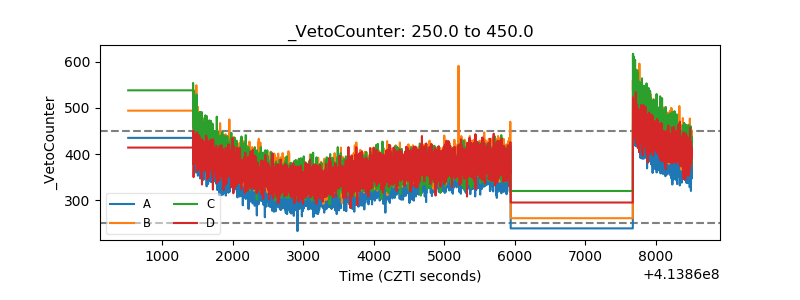 |