| Param | Original file | Final file |
|---|---|---|
| Filename | modeM0/AS1A12_032T03_9000005502_39880cztM0_level2.fits | modeM0/AS1A12_032T03_9000005502_39880cztM0_level2_quad_clean.evt |
| Size (bytes) | 316,854,720 | 89,303,040 |
| Size | 302.2 MB | 85.2 MB |
| Events in quadrant A | 3,151,717 | 594,125 |
| Events in quadrant B | 2,582,108 | 620,396 |
| Events in quadrant C | 2,810,114 | 601,547 |
| Events in quadrant D | 2,802,503 | 544,249 |
| Mode SS | |||
|---|---|---|---|
| Quadrant | BADHDUFLAG | Total packets | Discarded packets |
| A | 0 | 98 | 0 |
| B | 0 | 98 | 0 |
| C | 0 | 98 | 0 |
| D | 0 | 98 | 0 |
| Mode M9 | |||
|---|---|---|---|
| Quadrant | BADHDUFLAG | Total packets | Discarded packets |
| A | 0 | 21 | 0 |
| B | 0 | 21 | 0 |
| C | 0 | 21 | 0 |
| D | 0 | 21 | 0 |
| Mode M0 | |||
|---|---|---|---|
| Quadrant | BADHDUFLAG | Total packets | Discarded packets |
| A | 0 | 12431 | 1 |
| B | 0 | 10710 | 0 |
| C | 0 | 11280 | 0 |
| D | 0 | 11574 | 0 |
| Quadrant | Total seconds | Saturated seconds | Saturation percentage |
|---|---|---|---|
| A | 4910 | 103 | 2.097760% |
| B | 4910 | 17 | 0.346232% |
| C | 4910 | 45 | 0.916497% |
| D | 4910 | 104 | 2.118126% |
Noise dominated data is calculated using 1-second bins in cleaned event files. If a bin has >2000 counts, and if more than 50% of those come from <1% of pixels, then it is considered to be noise-dominated and hence unusable.
| Quadrant | # 1 sec bins | Bins with >0 counts | Bins with >2000 counts | High rate bins dominated by noise | Noise dominated (total time) | Noise dominated (detector-on time) | Marked lightcurve |
|---|---|---|---|---|---|---|---|
| A | 6913 | 4911 | 59 | 59 | 0.85% | 1.20% | 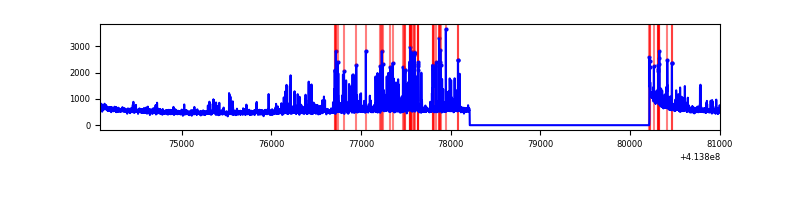 |
| B | 6913 | 4911 | 3 | 3 | 0.04% | 0.06% | 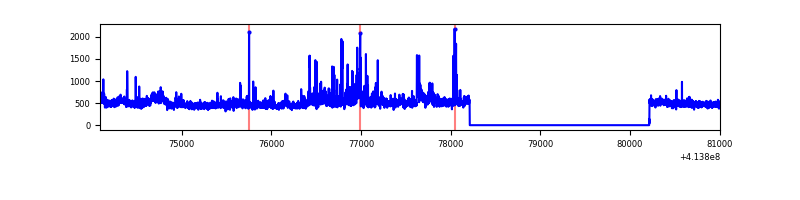 |
| C | 6913 | 4911 | 39 | 39 | 0.56% | 0.79% | 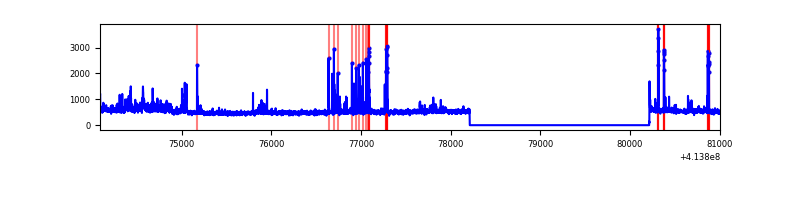 |
| D | 6913 | 4911 | 92 | 92 | 1.33% | 1.87% | 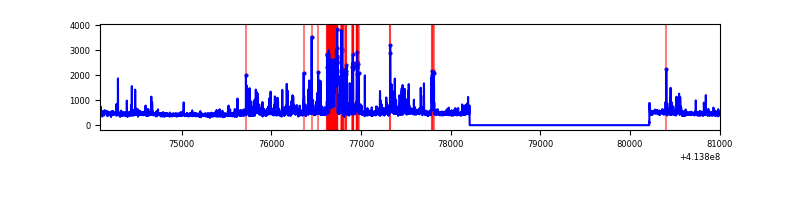 |
Top three noisy pixels from each quadrant. If the there are fewer than three noisy pixels in the level2.evt file, extra rows are filled as -1
| Pixel properties | Quadrant properties | ||||||
|---|---|---|---|---|---|---|---|
| Quadrant | DetID | PixID | Counts | Sigma | Mean | Median | Sigma |
| A | 10 | 83 | 397282 | 3458.0 | 568 | 557 | 114.7 |
| A | 14 | 250 | 223200 | 1940.63 | 568 | 557 | 114.7 |
| A | 9 | 143 | 218104 | 1896.22 | 568 | 557 | 114.7 |
| B | 0 | 230 | 117283 | 1079.02 | 569 | 554 | 108.2 |
| B | 4 | 170 | 63245 | 579.51 | 569 | 554 | 108.2 |
| B | 0 | 183 | 50828 | 464.72 | 569 | 554 | 108.2 |
| C | 14 | 254 | 320466 | 2393.23 | 569 | 574 | 133.7 |
| C | 15 | 214 | 207117 | 1545.22 | 569 | 574 | 133.7 |
| C | 1 | 16 | 35580 | 261.89 | 569 | 574 | 133.7 |
| D | 12 | 233 | 329381 | 2376.74 | 567 | 552 | 138.4 |
| D | 12 | 227 | 67099 | 480.99 | 567 | 552 | 138.4 |
| D | 13 | 171 | 51010 | 364.7 | 567 | 552 | 138.4 |
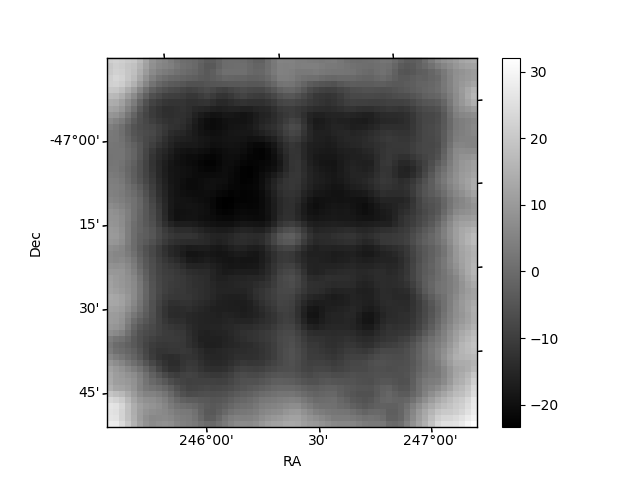
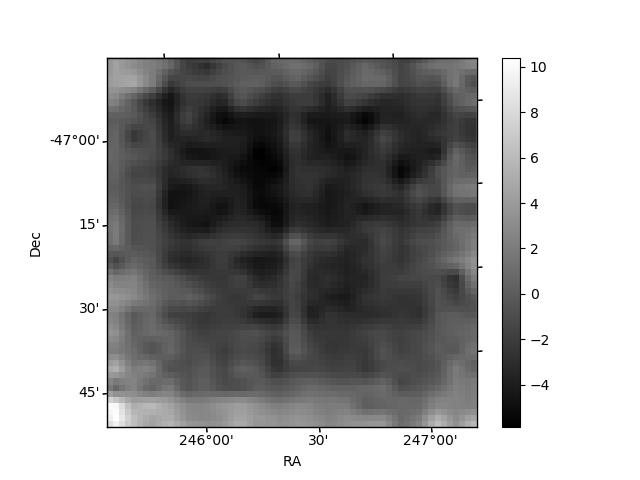
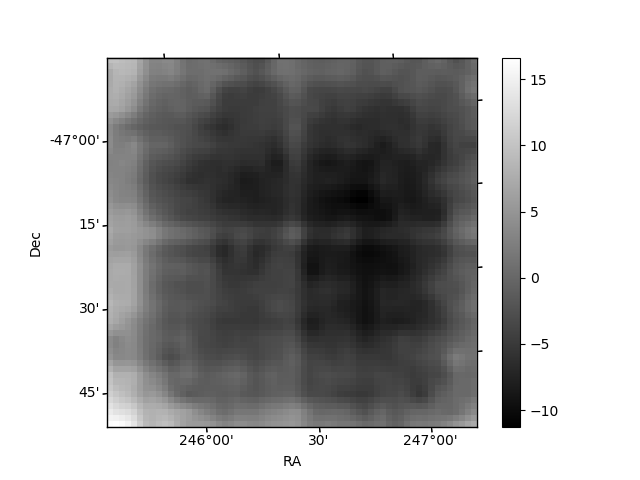
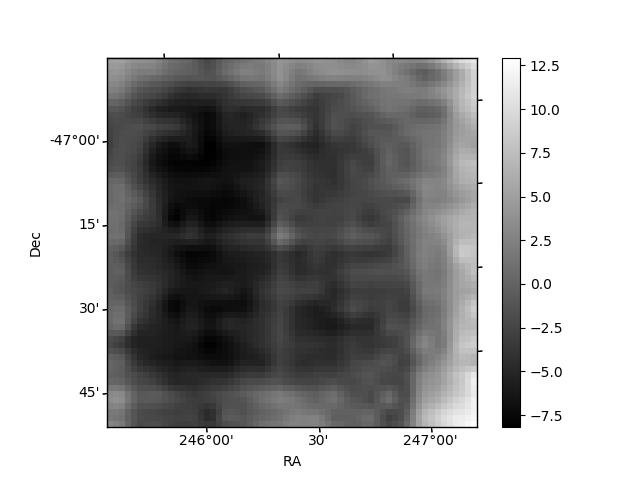
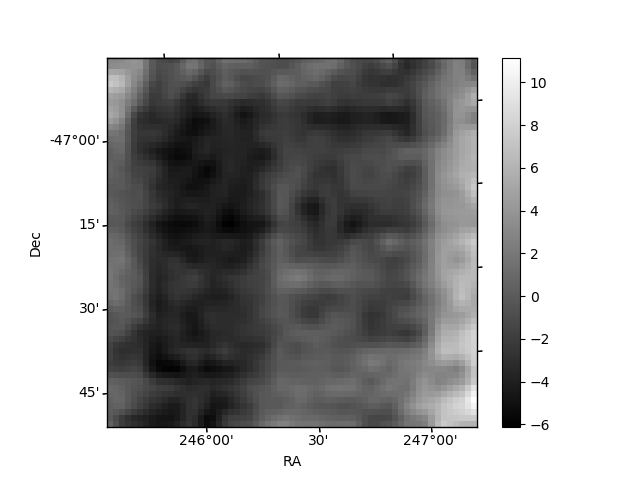
Histogram calculated using DETX and DETY for each event in the final _common_clean file
| Quadrant A | 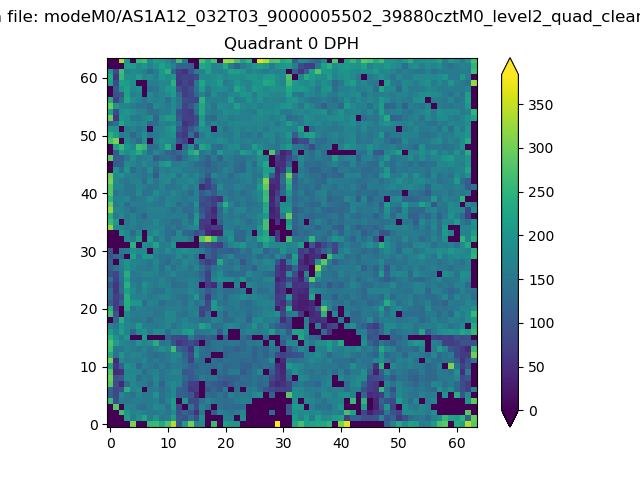 |
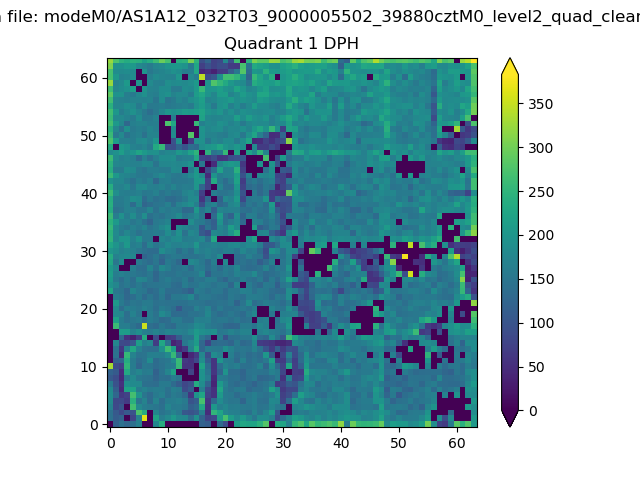 |
Quadrant B |
|---|---|---|---|
| Quadrant D | 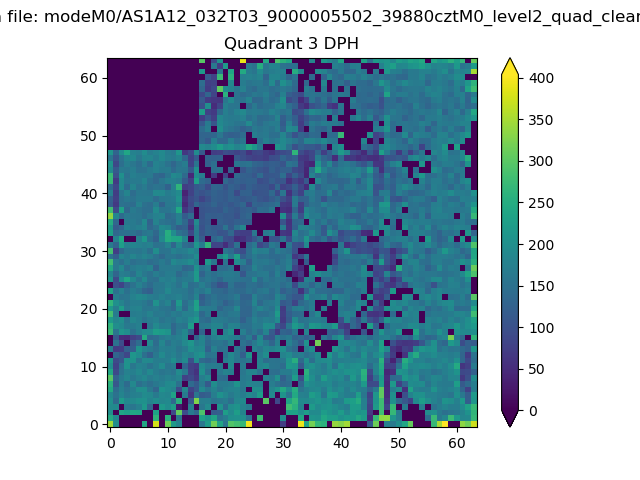 |
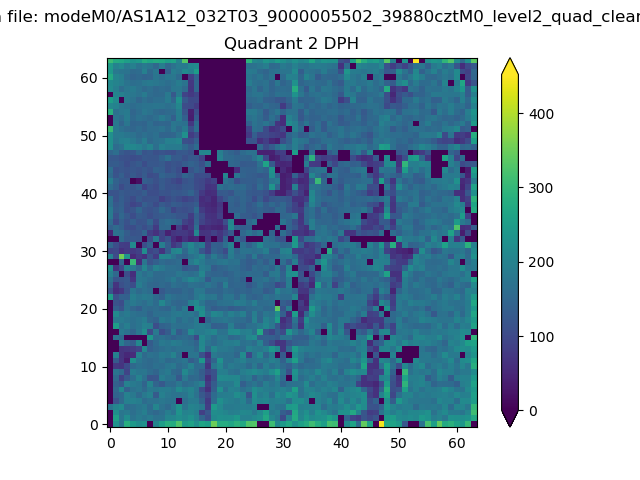 |
Quadrant C |
| Plot type | Count rate plots | Images |
|---|---|---|
| Comparison with Poisson distribution Blue bars denote a histogram of data divided into 1 sec bins. Red curve is a Poisson curve with rate = median count rate of data. |
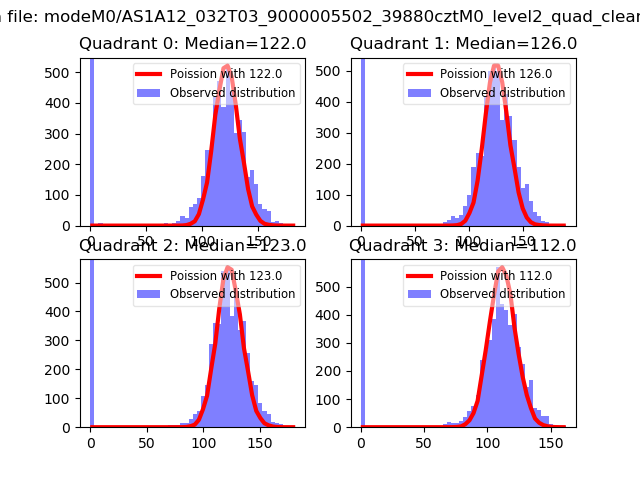 |
 |
| Quadrant-wise count rates Data is divided into 100 sec bins |
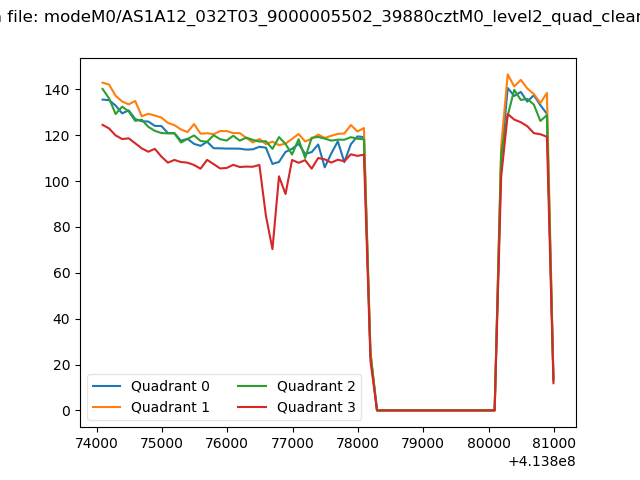 |
|
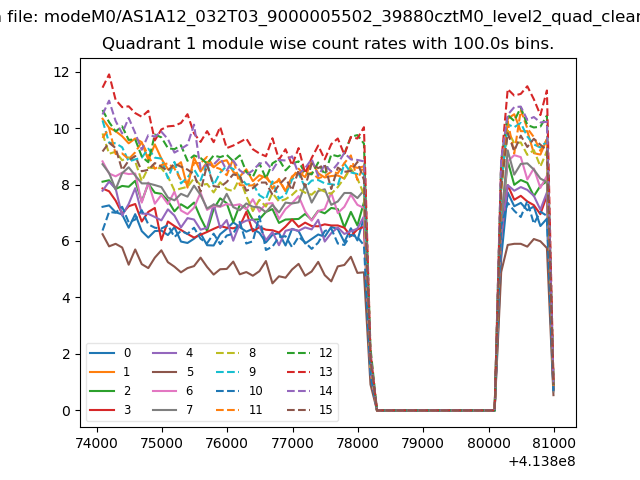
| Module-wise count rates for Quadrant A Data is divided into 100 sec bins |
 |
 |
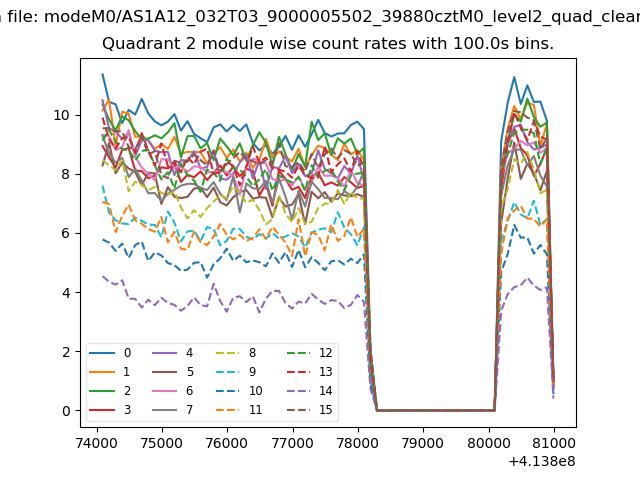
| Module-wise count rates for Quadrant B Data is divided into 100 sec bins |
 |
 |
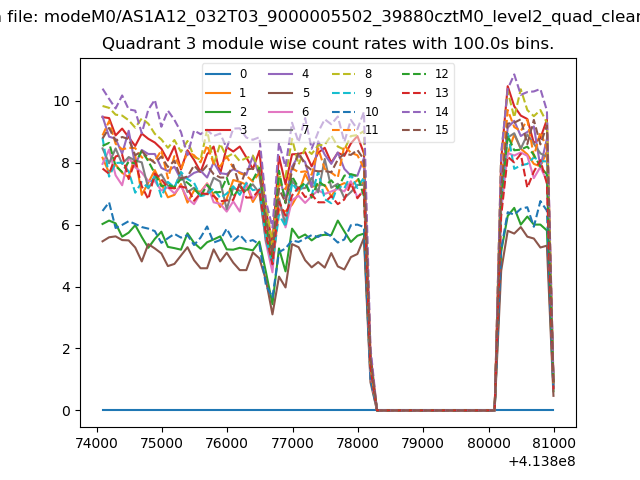
| Module-wise count rates for Quadrant C Data is divided into 100 sec bins |
 |
 |
| Module-wise count rates for Quadrant D Data is divided into 100 sec bins |
 |
 |
| Parameter | Plot |
|---|---|
| CZT HV Monitor | 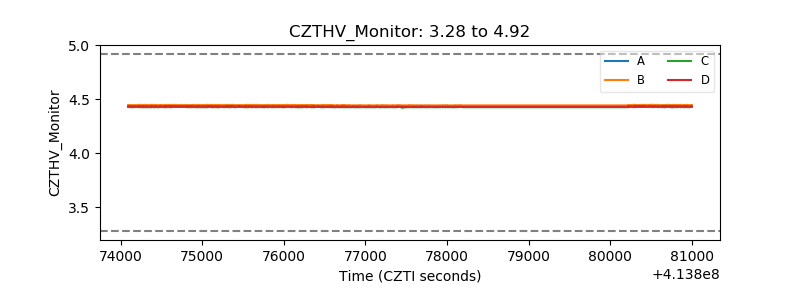 |
| D_VDD | 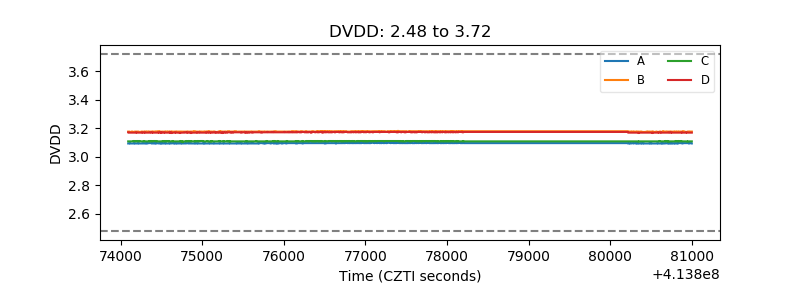 |
| Temperature 1 |  |
| Veto HV Monitor | 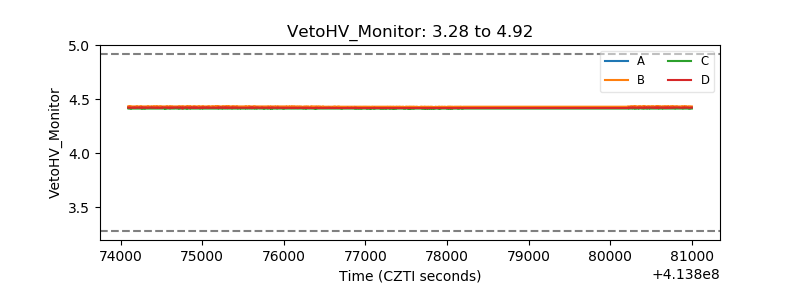 |
| Veto LLD | 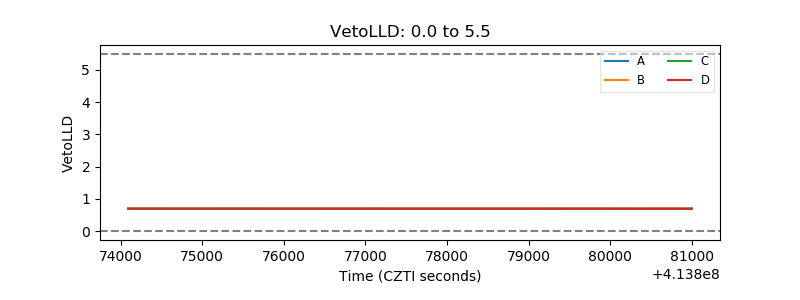 |
| Alpha Counter | 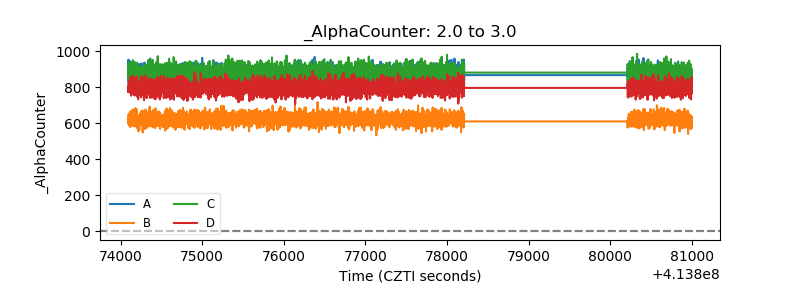 |
| _CPM_Rate | 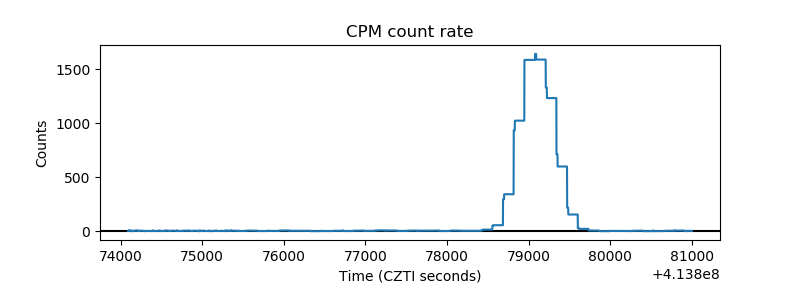 |
| CZT Counter | 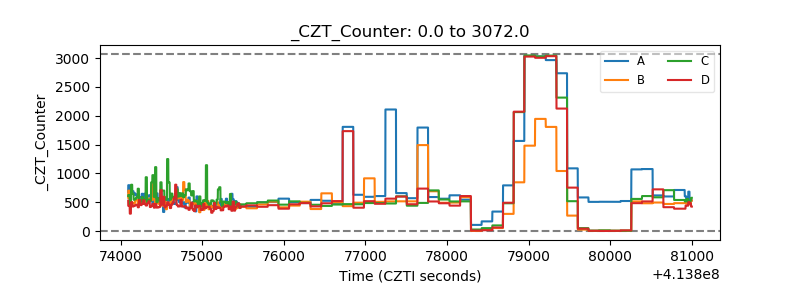 |
| +2.5 Volts monitor | 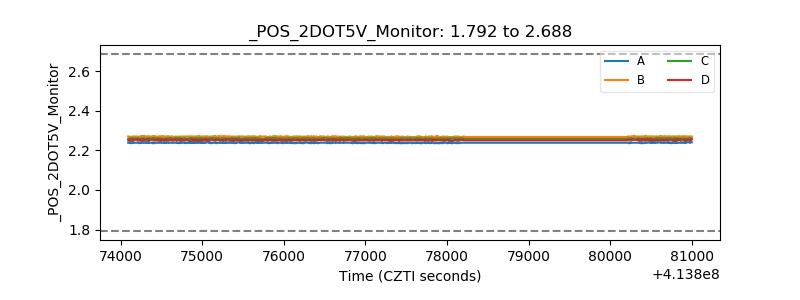 |
| +5 Volts monitor | 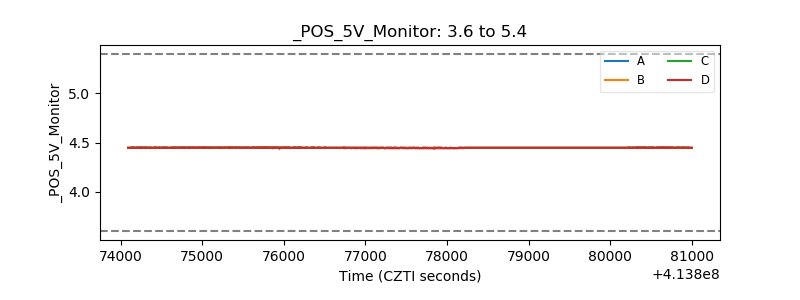 |
| _ROLL_ROT |  |
| _Roll_DEC | 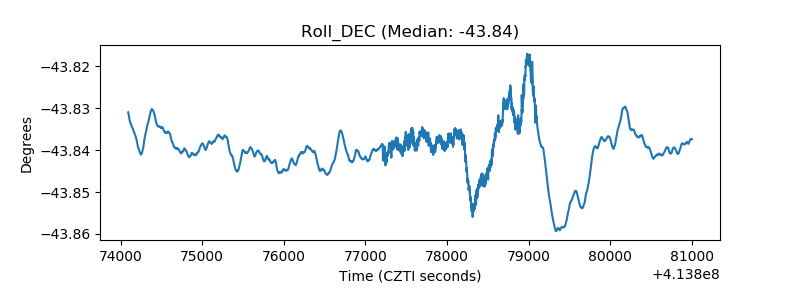 |
| _Roll_RA | 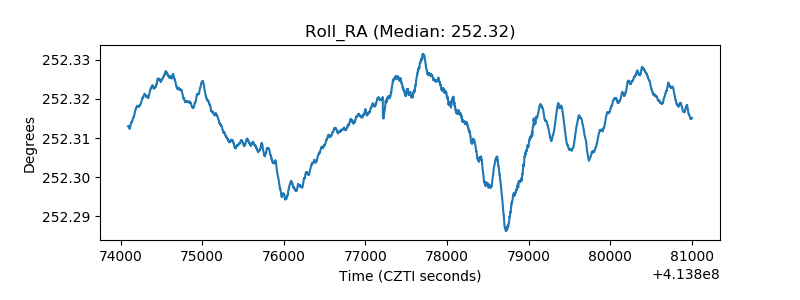 |
| Veto Counter | 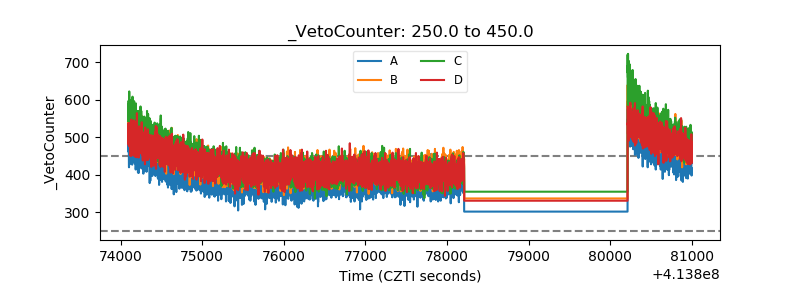 |