| Param | Original file | Final file |
|---|---|---|
| Filename | modeM0/AS1A12_032T03_9000005502_39881cztM0_level2.fits | modeM0/AS1A12_032T03_9000005502_39881cztM0_level2_quad_clean.evt |
| Size (bytes) | 321,379,200 | 90,403,200 |
| Size | 306.5 MB | 86.2 MB |
| Events in quadrant A | 3,267,923 | 604,133 |
| Events in quadrant B | 2,720,251 | 628,057 |
| Events in quadrant C | 2,736,339 | 607,025 |
| Events in quadrant D | 2,789,650 | 554,018 |
| Mode SS | |||
|---|---|---|---|
| Quadrant | BADHDUFLAG | Total packets | Discarded packets |
| A | 0 | 100 | 0 |
| B | 0 | 100 | 0 |
| C | 0 | 100 | 0 |
| D | 0 | 100 | 0 |
| Mode M9 | |||
|---|---|---|---|
| Quadrant | BADHDUFLAG | Total packets | Discarded packets |
| A | 0 | 21 | 0 |
| B | 0 | 21 | 0 |
| C | 0 | 21 | 0 |
| D | 0 | 22 | 0 |
| Mode M0 | |||
|---|---|---|---|
| Quadrant | BADHDUFLAG | Total packets | Discarded packets |
| A | 0 | 12851 | 2 |
| B | 0 | 11155 | 1 |
| C | 0 | 10801 | 1 |
| D | 0 | 11355 | 1 |
| Quadrant | Total seconds | Saturated seconds | Saturation percentage |
|---|---|---|---|
| A | 4908 | 95 | 1.935615% |
| B | 4908 | 25 | 0.509372% |
| C | 4908 | 52 | 1.059495% |
| D | 4908 | 87 | 1.772616% |
Noise dominated data is calculated using 1-second bins in cleaned event files. If a bin has >2000 counts, and if more than 50% of those come from <1% of pixels, then it is considered to be noise-dominated and hence unusable.
| Quadrant | # 1 sec bins | Bins with >0 counts | Bins with >2000 counts | High rate bins dominated by noise | Noise dominated (total time) | Noise dominated (detector-on time) | Marked lightcurve |
|---|---|---|---|---|---|---|---|
| A | 7000 | 4909 | 66 | 66 | 0.94% | 1.34% | 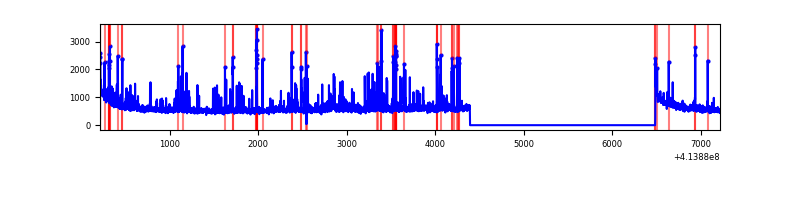 |
| B | 7000 | 4909 | 8 | 8 | 0.11% | 0.16% | 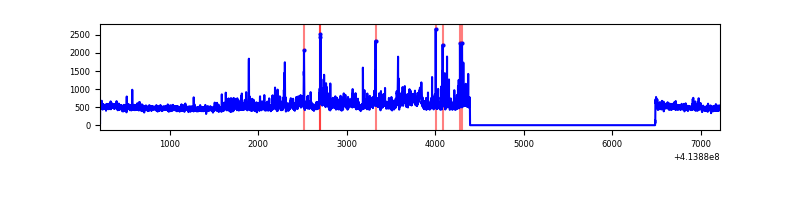 |
| C | 7000 | 4909 | 39 | 39 | 0.56% | 0.79% | 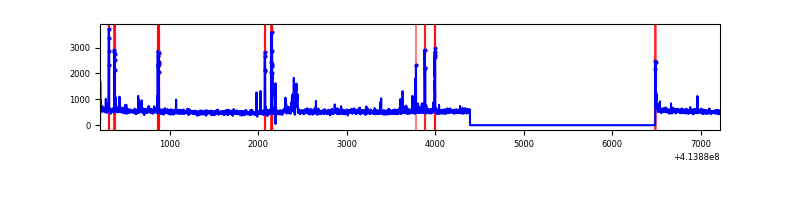 |
| D | 7000 | 4909 | 72 | 72 | 1.03% | 1.47% | 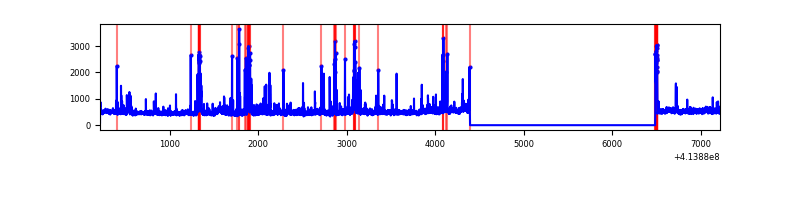 |
Top three noisy pixels from each quadrant. If the there are fewer than three noisy pixels in the level2.evt file, extra rows are filled as -1
| Pixel properties | Quadrant properties | ||||||
|---|---|---|---|---|---|---|---|
| Quadrant | DetID | PixID | Counts | Sigma | Mean | Median | Sigma |
| A | 10 | 83 | 480426 | 4107.55 | 579 | 569 | 116.8 |
| A | 14 | 250 | 231995 | 1980.99 | 579 | 569 | 116.8 |
| A | 9 | 143 | 182461 | 1556.98 | 579 | 569 | 116.8 |
| B | 0 | 230 | 131885 | 1201.58 | 577 | 563 | 109.3 |
| B | 4 | 170 | 128029 | 1166.3 | 577 | 563 | 109.3 |
| B | 5 | 255 | 57666 | 522.49 | 577 | 563 | 109.3 |
| C | 15 | 214 | 210066 | 1568.82 | 573 | 576 | 133.5 |
| C | 14 | 254 | 189929 | 1418.02 | 573 | 576 | 133.5 |
| C | 1 | 16 | 59552 | 441.66 | 573 | 576 | 133.5 |
| D | 2 | 249 | 156028 | 1109.96 | 572 | 555 | 140.1 |
| D | 12 | 233 | 102054 | 724.63 | 572 | 555 | 140.1 |
| D | 12 | 227 | 73475 | 520.59 | 572 | 555 | 140.1 |
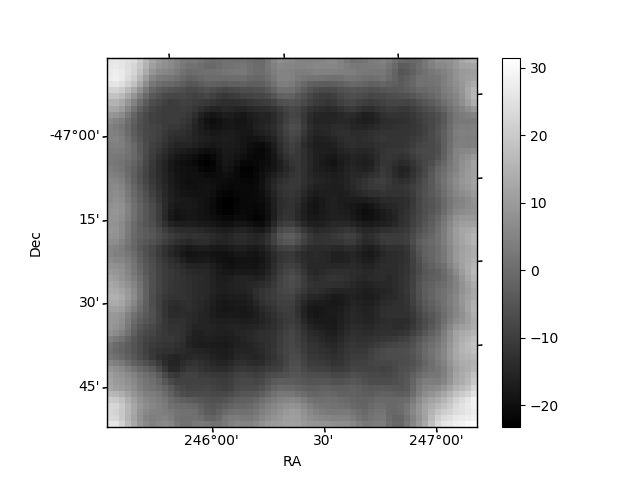
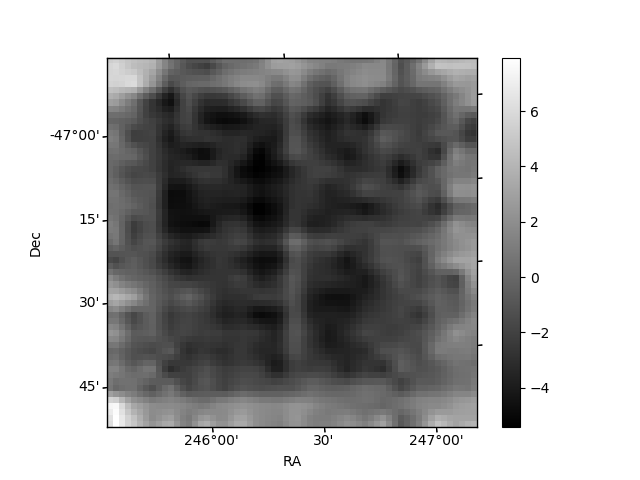
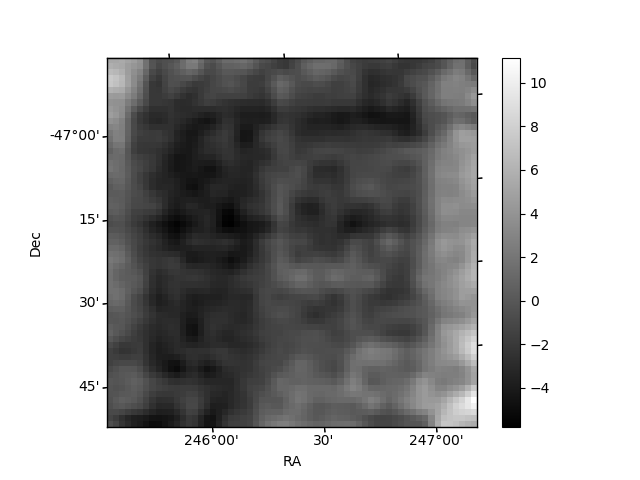
Histogram calculated using DETX and DETY for each event in the final _common_clean file
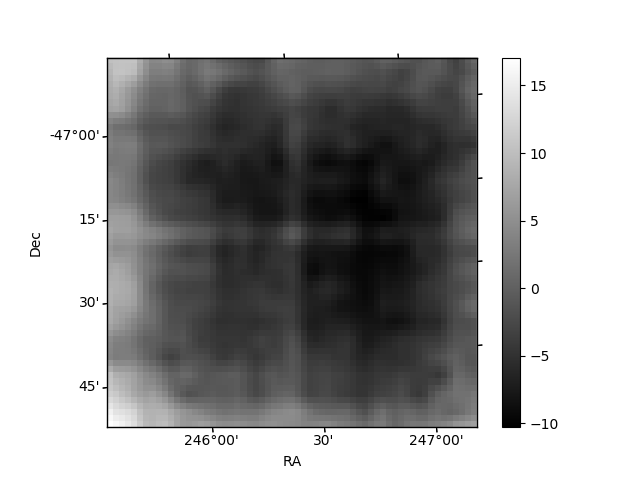
| Quadrant A | 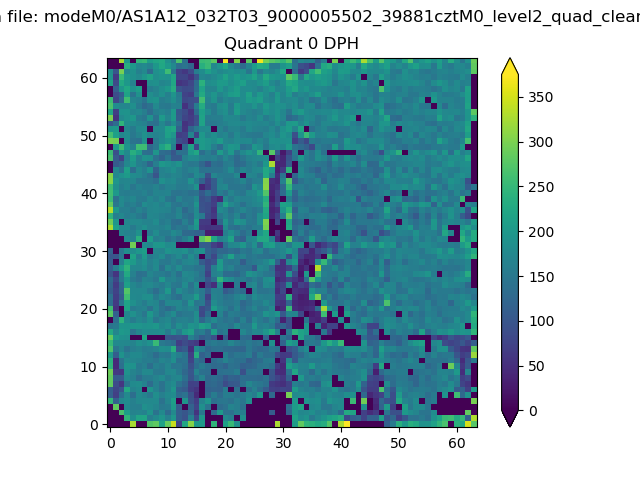 |
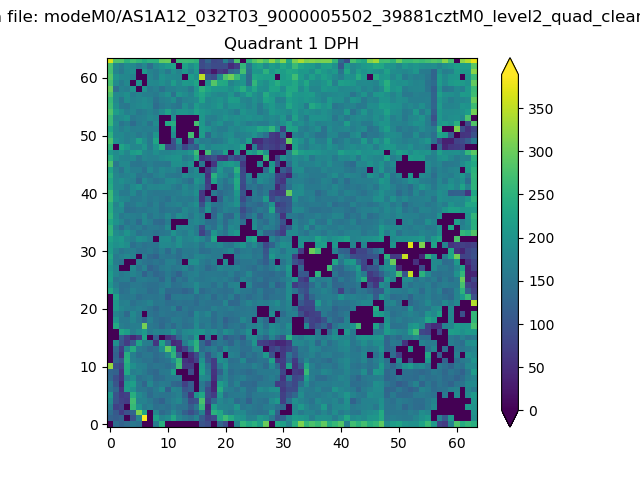 |
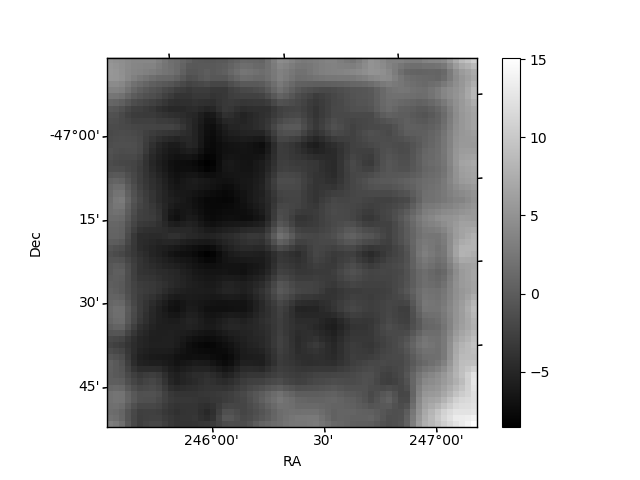
Quadrant B |
|---|---|---|---|
| Quadrant D | 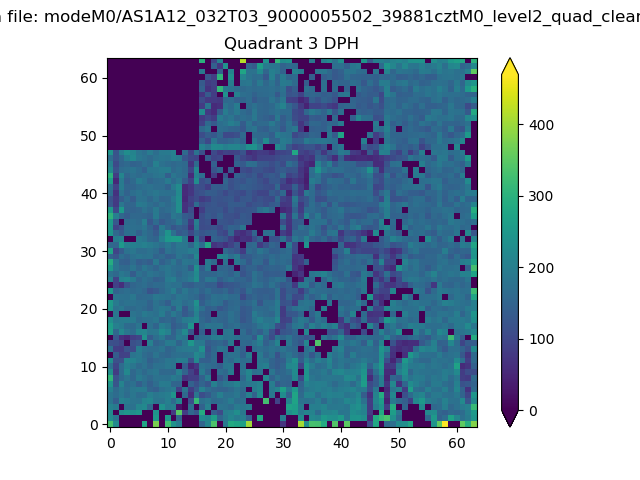 |
 |
Quadrant C |
| Plot type | Count rate plots | Images |
|---|---|---|
| Comparison with Poisson distribution Blue bars denote a histogram of data divided into 1 sec bins. Red curve is a Poisson curve with rate = median count rate of data. |
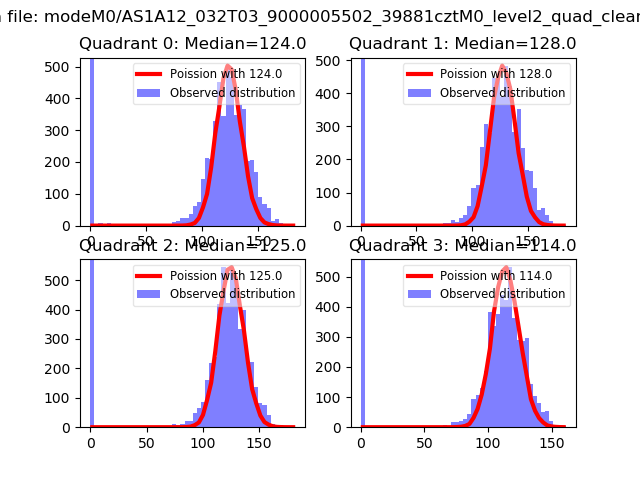 |
 |
| Quadrant-wise count rates Data is divided into 100 sec bins |
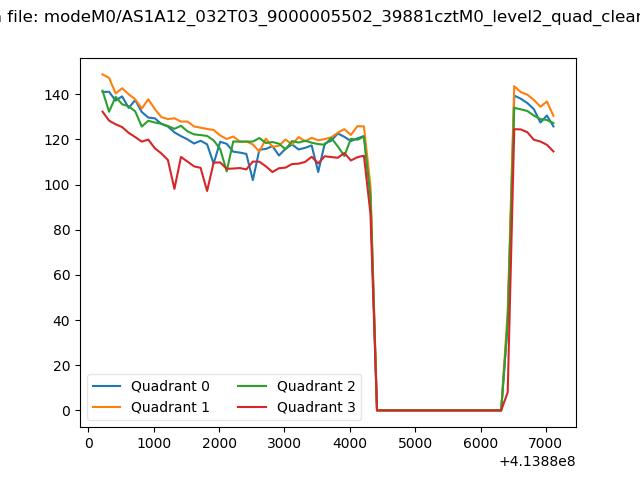 |
|
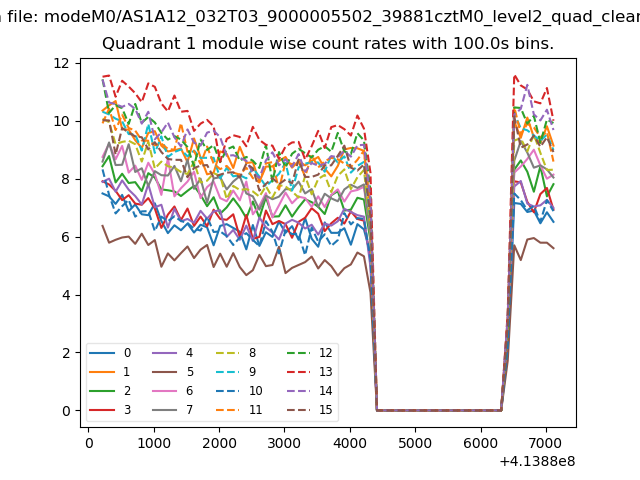
| Module-wise count rates for Quadrant A Data is divided into 100 sec bins |
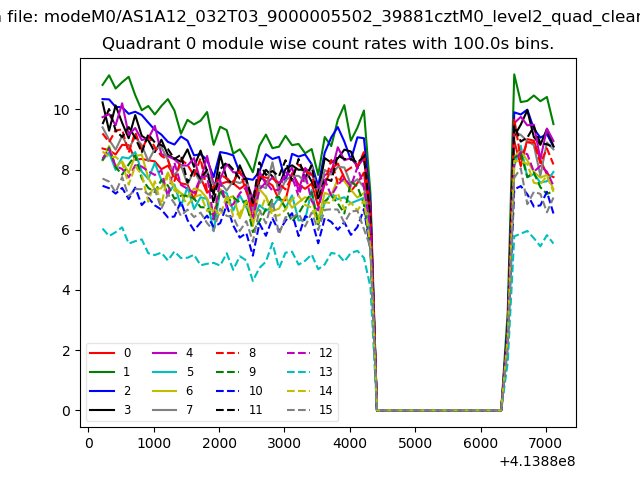 |
 |
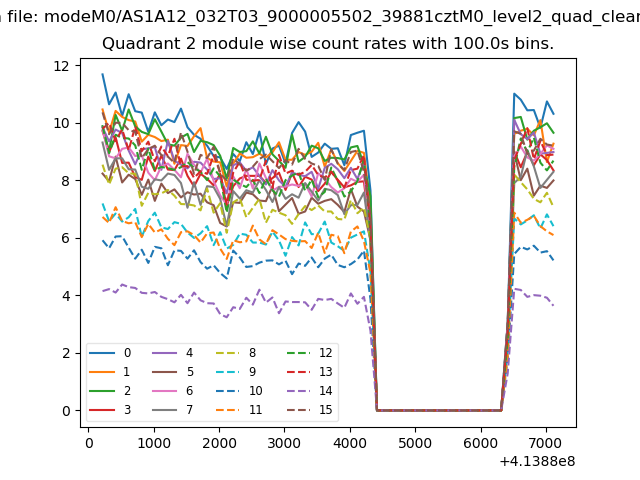
| Module-wise count rates for Quadrant B Data is divided into 100 sec bins |
 |
 |
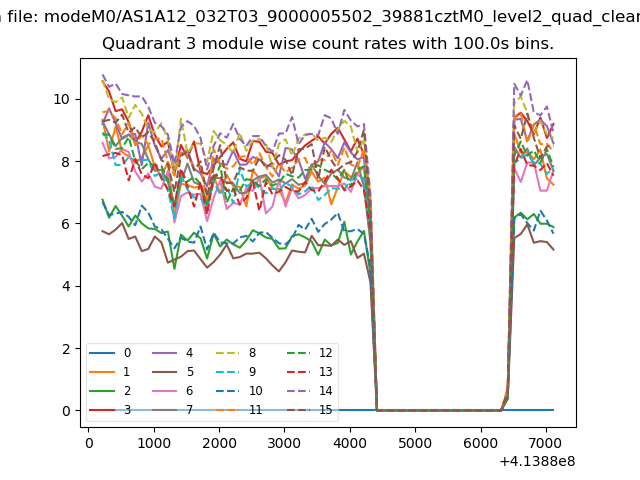
| Module-wise count rates for Quadrant C Data is divided into 100 sec bins |
 |
 |
| Module-wise count rates for Quadrant D Data is divided into 100 sec bins |
 |
 |
| Parameter | Plot |
|---|---|
| CZT HV Monitor | 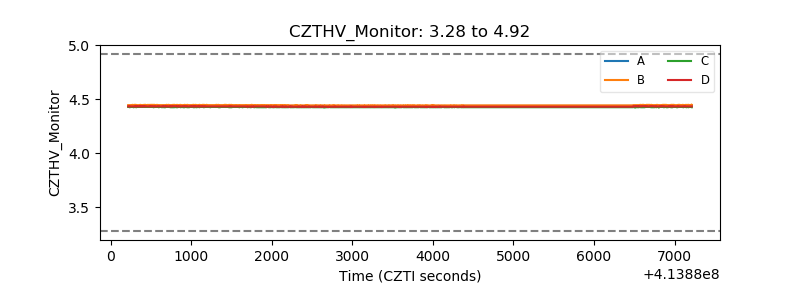 |
| D_VDD | 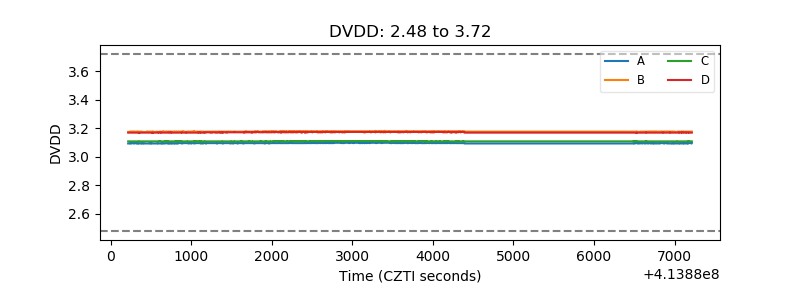 |
| Temperature 1 | 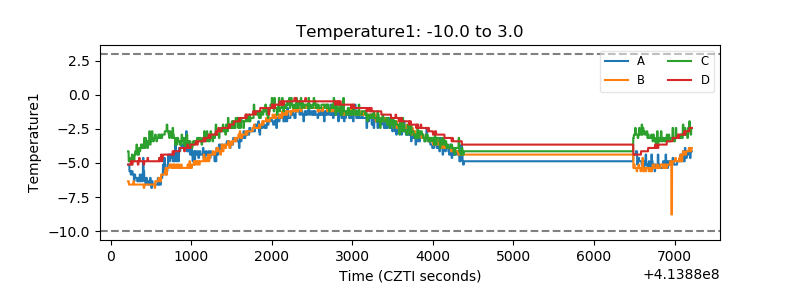 |
| Veto HV Monitor | 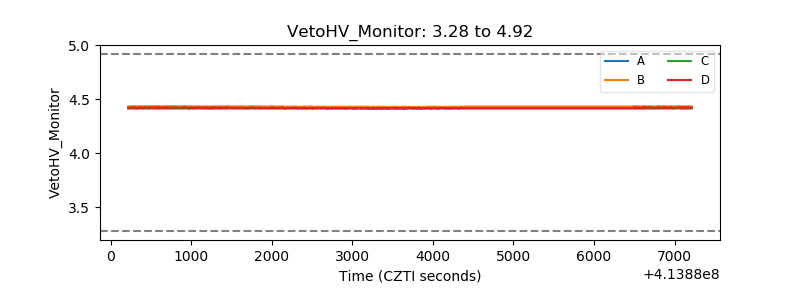 |
| Veto LLD | 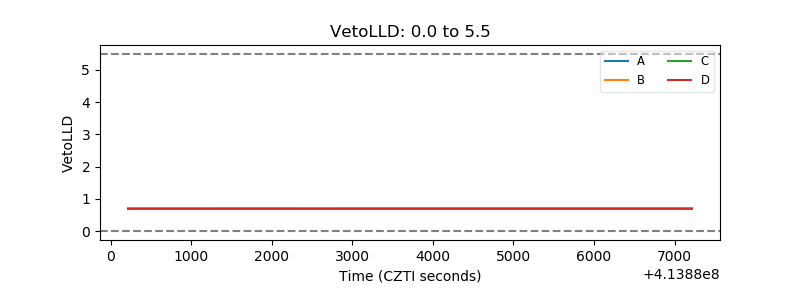 |
| Alpha Counter | 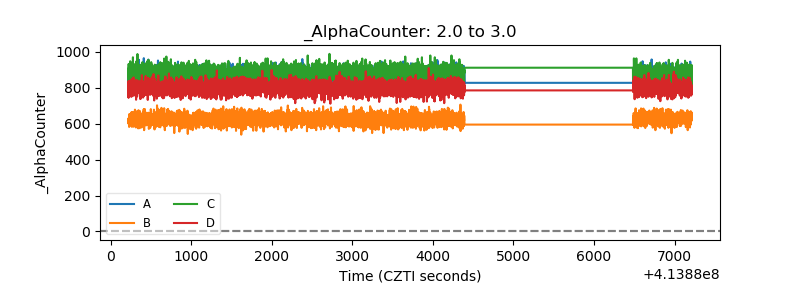 |
| _CPM_Rate | 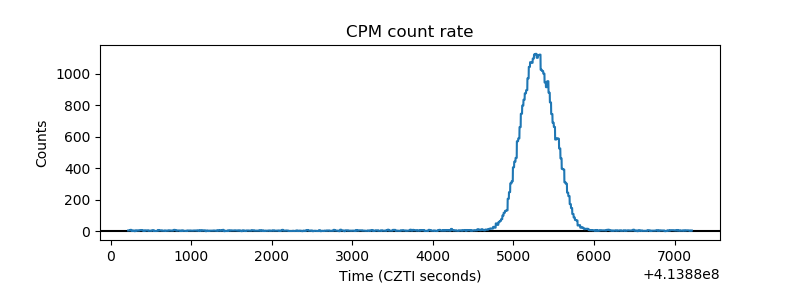 |
| CZT Counter | 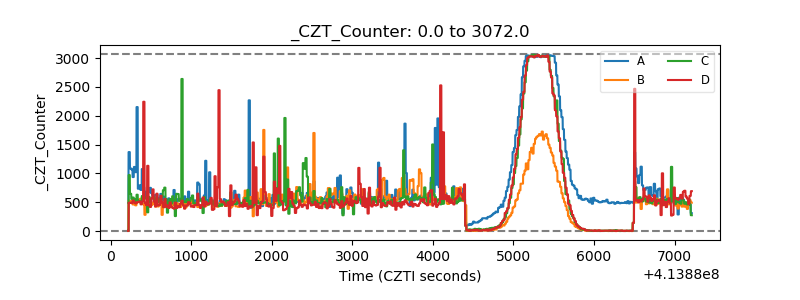 |
| +2.5 Volts monitor | 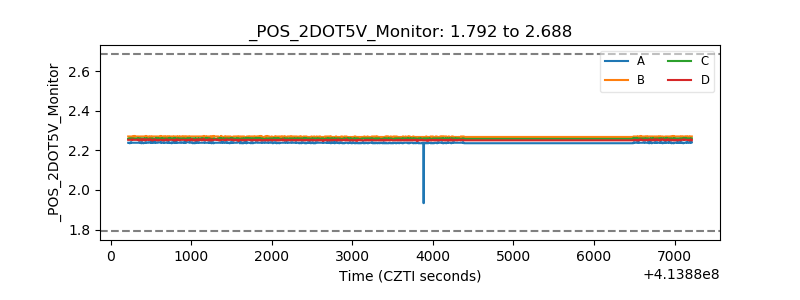 |
| +5 Volts monitor |  |
| _ROLL_ROT | 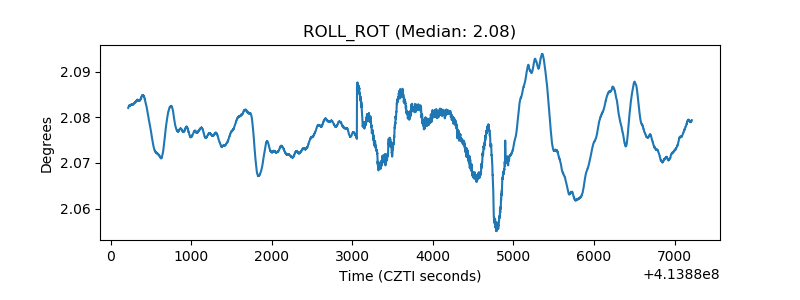 |
| _Roll_DEC | 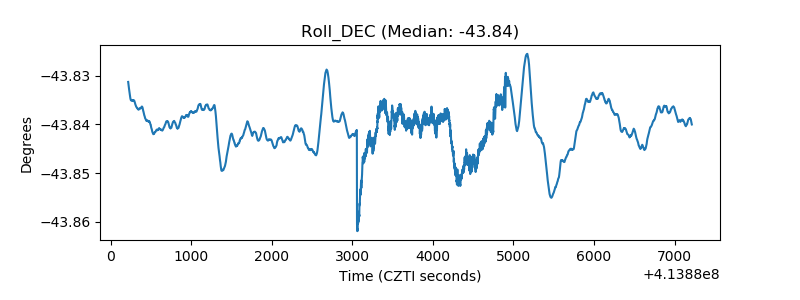 |
| _Roll_RA | 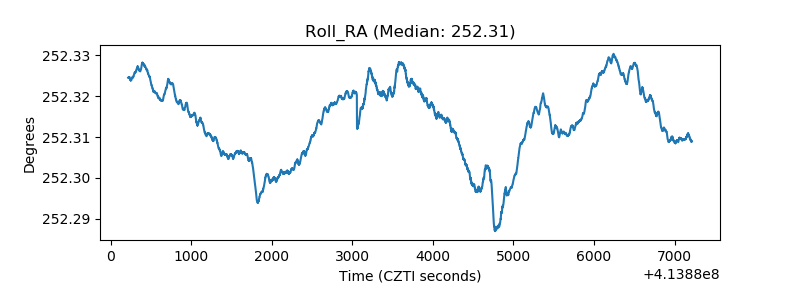 |
| Veto Counter | 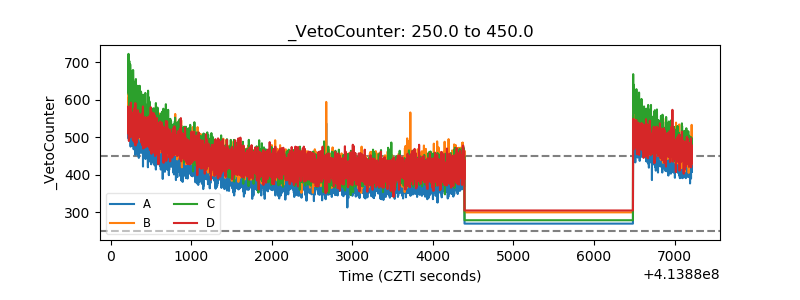 |