| Param | Original file | Final file |
|---|---|---|
| Filename | modeM0/AS1A12_032T03_9000005502_39882cztM0_level2.fits | modeM0/AS1A12_032T03_9000005502_39882cztM0_level2_quad_clean.evt |
| Size (bytes) | 322,683,840 | 88,781,760 |
| Size | 307.7 MB | 84.7 MB |
| Events in quadrant A | 2,991,927 | 599,169 |
| Events in quadrant B | 2,639,972 | 612,709 |
| Events in quadrant C | 2,622,807 | 596,293 |
| Events in quadrant D | 3,306,253 | 534,816 |
| Mode SS | |||
|---|---|---|---|
| Quadrant | BADHDUFLAG | Total packets | Discarded packets |
| A | 0 | 100 | 0 |
| B | 0 | 100 | 0 |
| C | 0 | 100 | 0 |
| D | 0 | 100 | 0 |
| Mode M9 | |||
|---|---|---|---|
| Quadrant | BADHDUFLAG | Total packets | Discarded packets |
| A | 0 | 22 | 0 |
| B | 0 | 22 | 0 |
| C | 0 | 22 | 0 |
| D | 0 | 22 | 0 |
| Mode M0 | |||
|---|---|---|---|
| Quadrant | BADHDUFLAG | Total packets | Discarded packets |
| A | 0 | 11939 | 3 |
| B | 0 | 10873 | 2 |
| C | 0 | 10470 | 2 |
| D | 0 | 12960 | 2 |
| Quadrant | Total seconds | Saturated seconds | Saturation percentage |
|---|---|---|---|
| A | 4926 | 24 | 0.487211% |
| B | 4926 | 31 | 0.629314% |
| C | 4926 | 17 | 0.345108% |
| D | 4927 | 194 | 3.937487% |
Noise dominated data is calculated using 1-second bins in cleaned event files. If a bin has >2000 counts, and if more than 50% of those come from <1% of pixels, then it is considered to be noise-dominated and hence unusable.
| Quadrant | # 1 sec bins | Bins with >0 counts | Bins with >2000 counts | High rate bins dominated by noise | Noise dominated (total time) | Noise dominated (detector-on time) | Marked lightcurve |
|---|---|---|---|---|---|---|---|
| A | 7079 | 4927 | 17 | 17 | 0.24% | 0.35% | 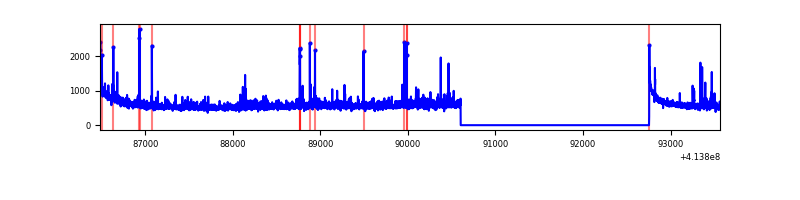 |
| B | 7079 | 4927 | 9 | 9 | 0.13% | 0.18% | 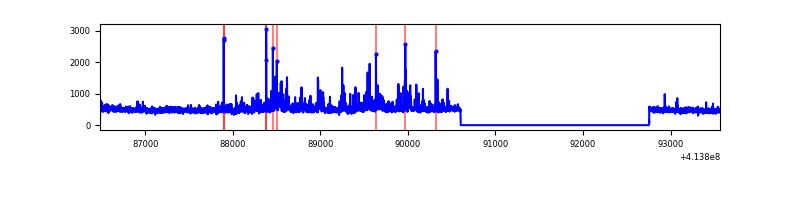 |
| C | 7079 | 4927 | 19 | 19 | 0.27% | 0.39% | 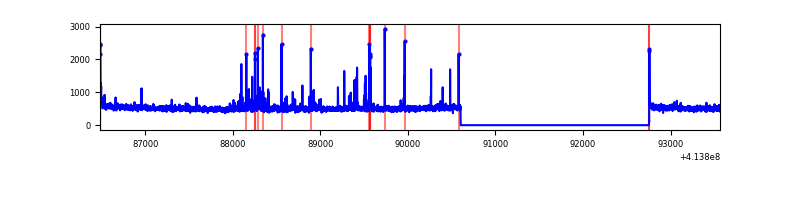 |
| D | 7080 | 4928 | 162 | 162 | 2.29% | 3.29% | 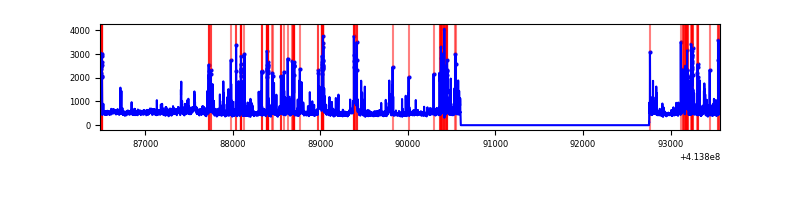 |
Top three noisy pixels from each quadrant. If the there are fewer than three noisy pixels in the level2.evt file, extra rows are filled as -1
| Pixel properties | Quadrant properties | ||||||
|---|---|---|---|---|---|---|---|
| Quadrant | DetID | PixID | Counts | Sigma | Mean | Median | Sigma |
| A | 10 | 83 | 488555 | 4172.55 | 578 | 567 | 117.0 |
| A | 6 | 10 | 105778 | 899.61 | 578 | 567 | 117.0 |
| A | 9 | 143 | 47892 | 404.65 | 578 | 567 | 117.0 |
| B | 0 | 230 | 100361 | 914.65 | 571 | 555 | 109.1 |
| B | 0 | 183 | 98943 | 901.66 | 571 | 555 | 109.1 |
| B | 0 | 221 | 74406 | 676.79 | 571 | 555 | 109.1 |
| C | 15 | 214 | 213676 | 1616.79 | 566 | 570 | 131.8 |
| C | 14 | 254 | 105104 | 793.08 | 566 | 570 | 131.8 |
| C | 1 | 16 | 33745 | 251.69 | 566 | 570 | 131.8 |
| D | 2 | 249 | 288035 | 2096.46 | 559 | 544 | 137.1 |
| D | 12 | 227 | 285078 | 2074.89 | 559 | 544 | 137.1 |
| D | 13 | 249 | 166249 | 1208.36 | 559 | 544 | 137.1 |
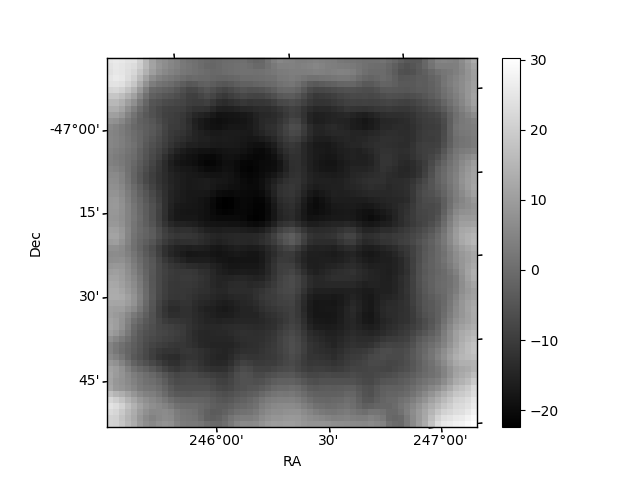
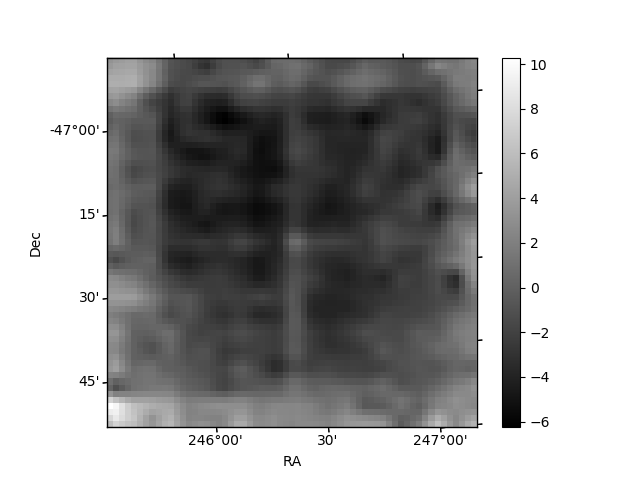
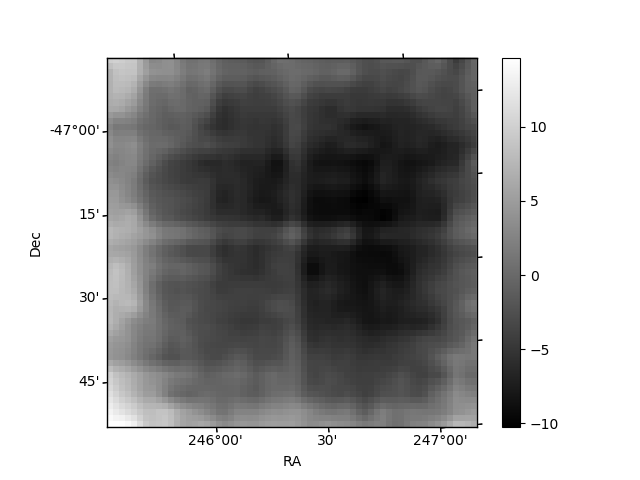
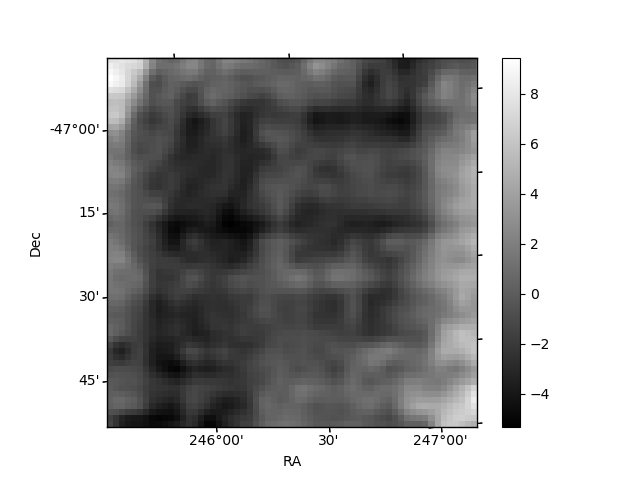
Histogram calculated using DETX and DETY for each event in the final _common_clean file
| Quadrant A | 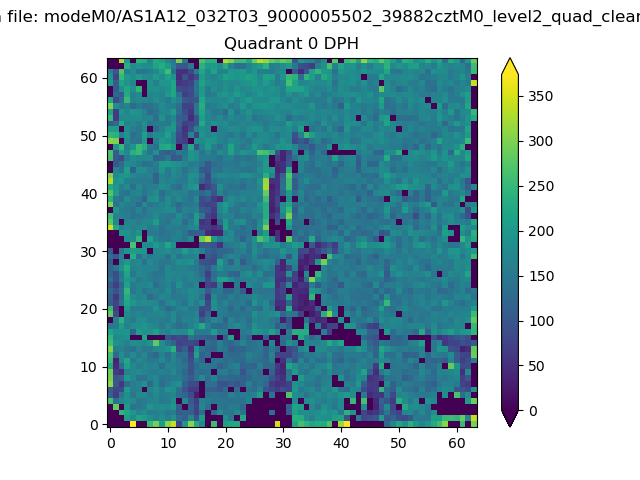 |
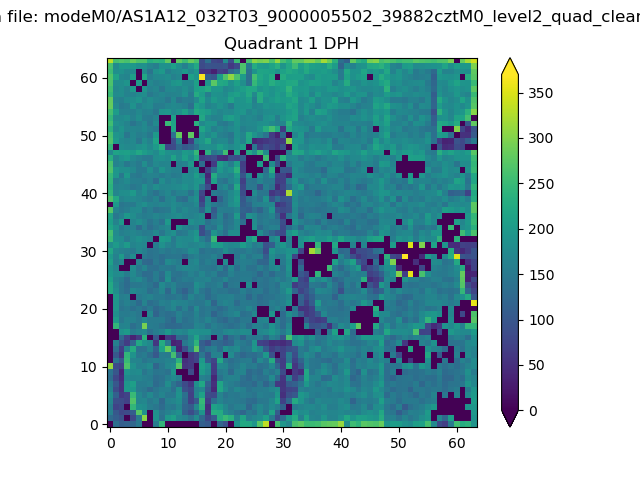 |
Quadrant B |
|---|---|---|---|
| Quadrant D | 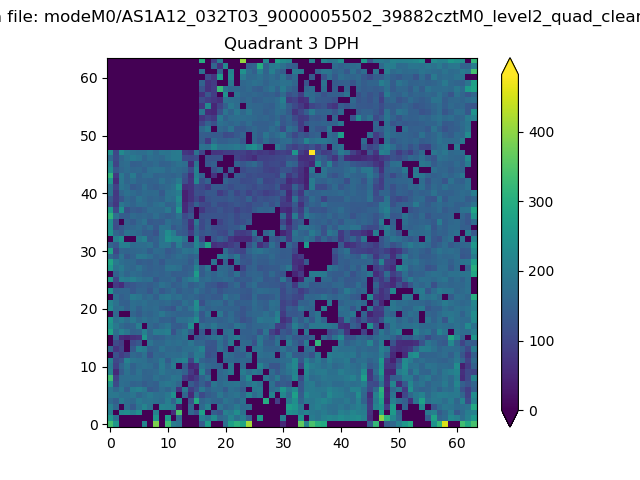 |
 |
Quadrant C |
| Plot type | Count rate plots | Images |
|---|---|---|
| Comparison with Poisson distribution Blue bars denote a histogram of data divided into 1 sec bins. Red curve is a Poisson curve with rate = median count rate of data. |
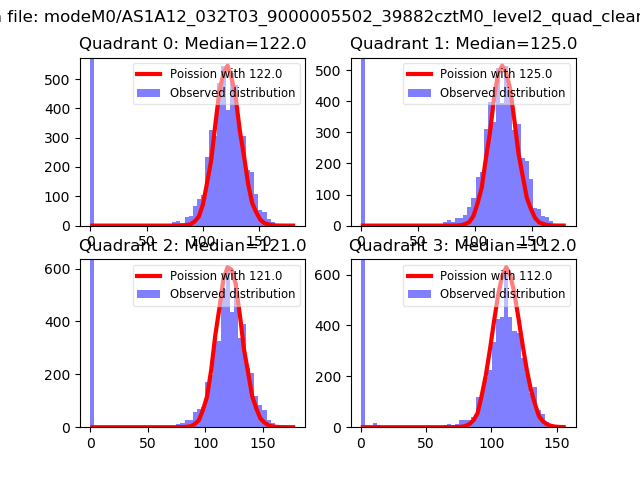 |
 |
| Quadrant-wise count rates Data is divided into 100 sec bins |
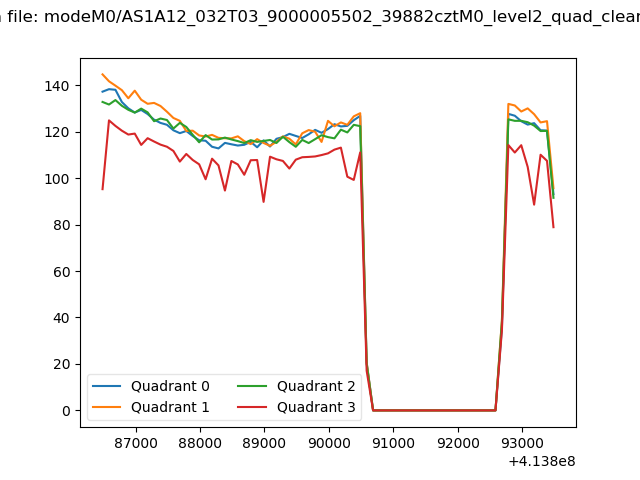 |
|
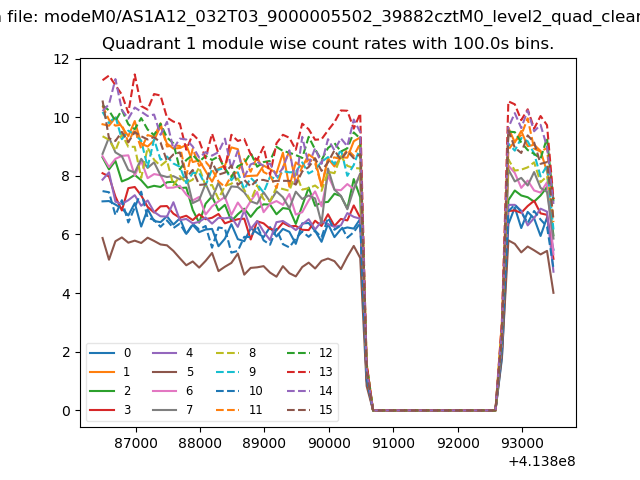
| Module-wise count rates for Quadrant A Data is divided into 100 sec bins |
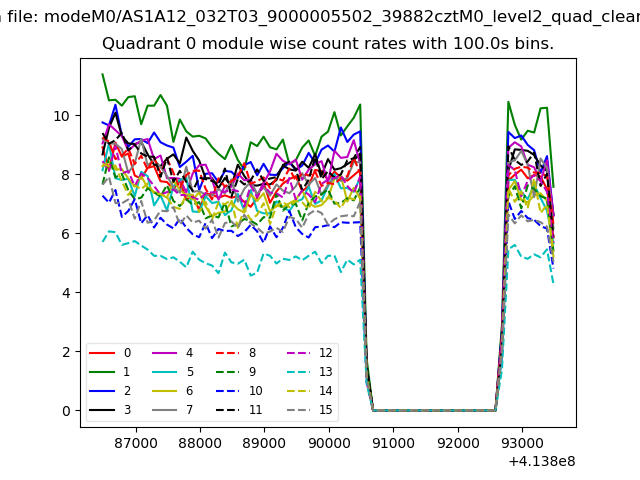 |
 |
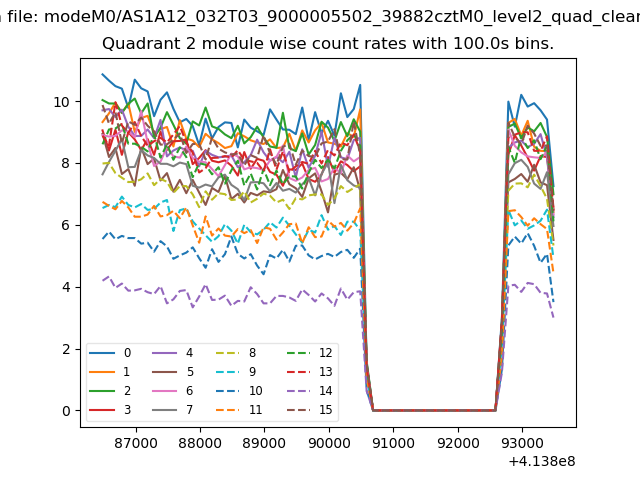
| Module-wise count rates for Quadrant B Data is divided into 100 sec bins |
 |
 |
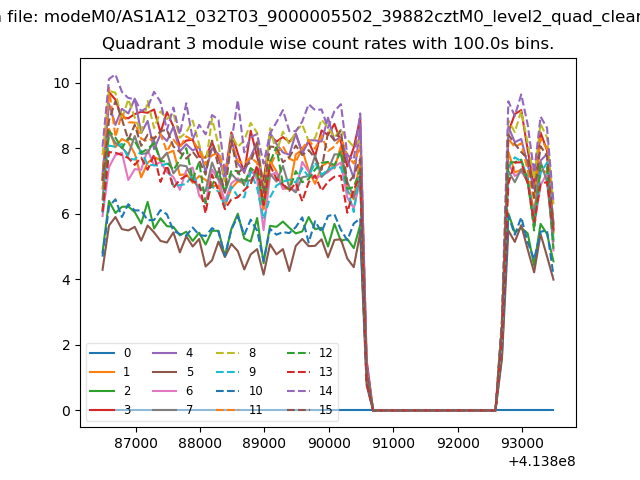
| Module-wise count rates for Quadrant C Data is divided into 100 sec bins |
 |
 |
| Module-wise count rates for Quadrant D Data is divided into 100 sec bins |
 |
 |
| Parameter | Plot |
|---|---|
| CZT HV Monitor | 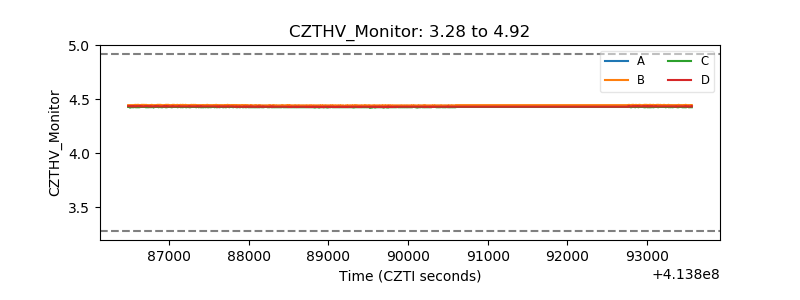 |
| D_VDD | 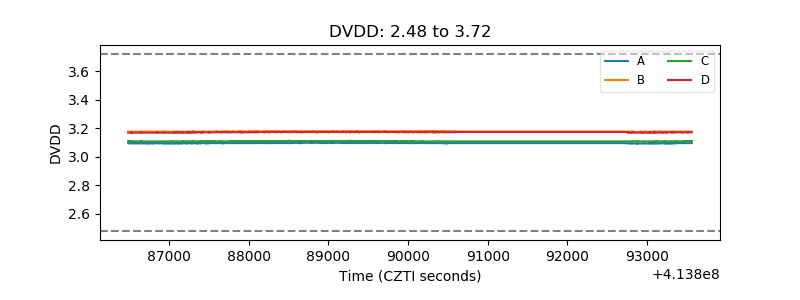 |
| Temperature 1 | 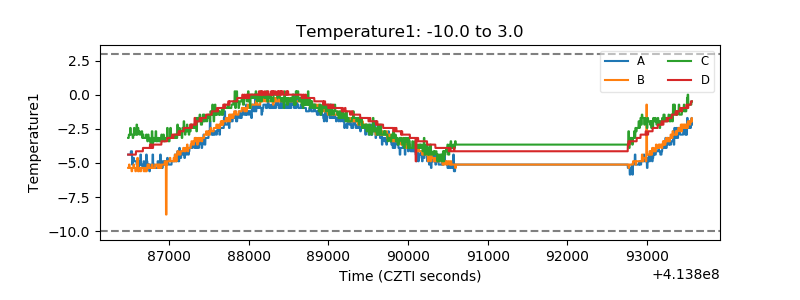 |
| Veto HV Monitor | 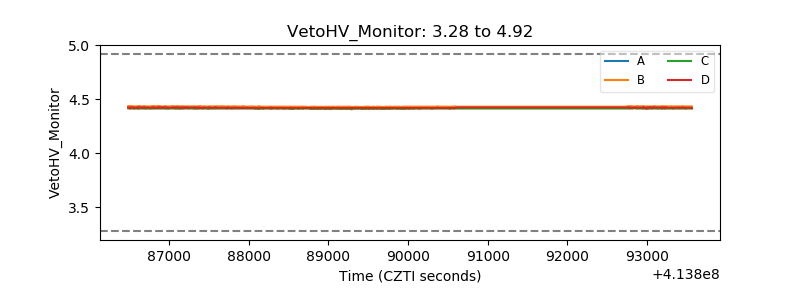 |
| Veto LLD | 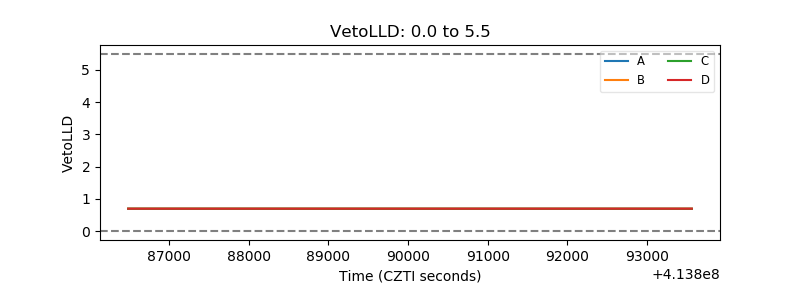 |
| Alpha Counter | 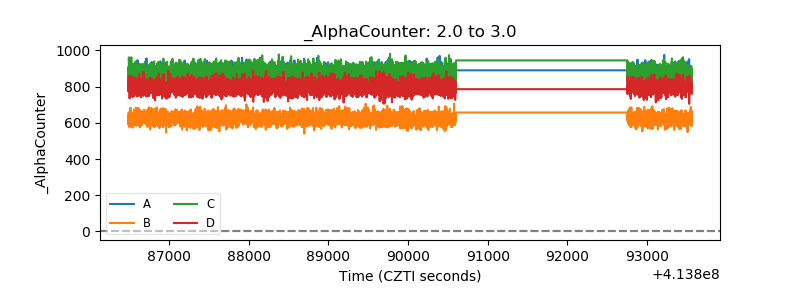 |
| _CPM_Rate | 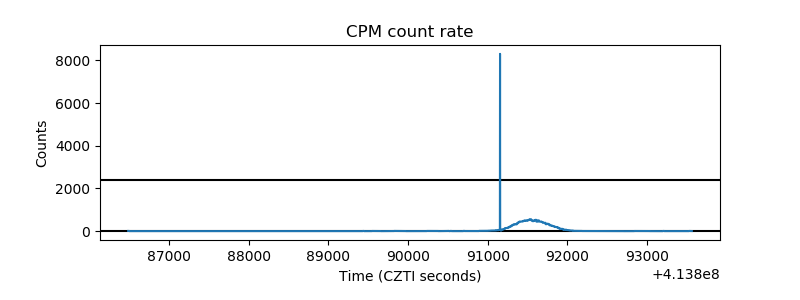 |
| CZT Counter | 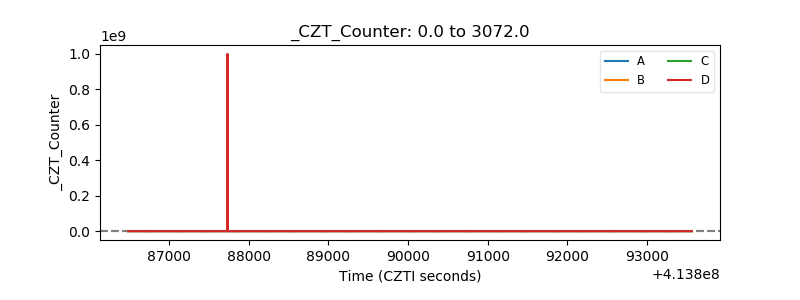 |
| +2.5 Volts monitor | 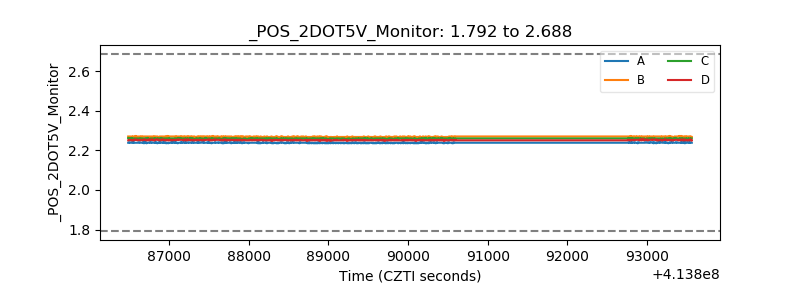 |
| +5 Volts monitor | 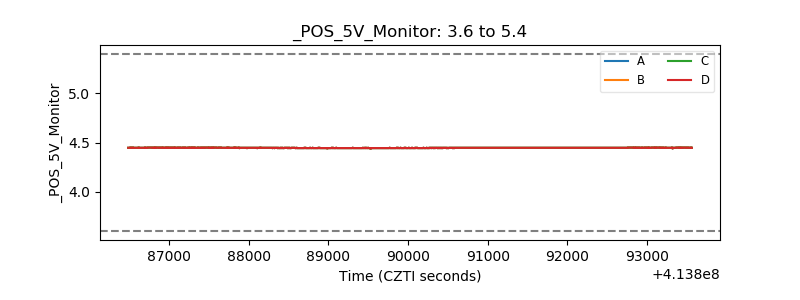 |
| _ROLL_ROT | 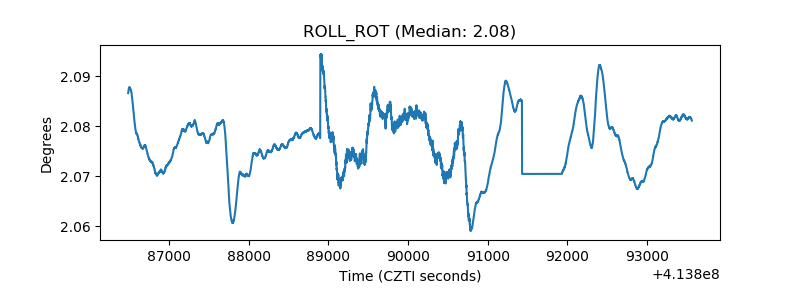 |
| _Roll_DEC | 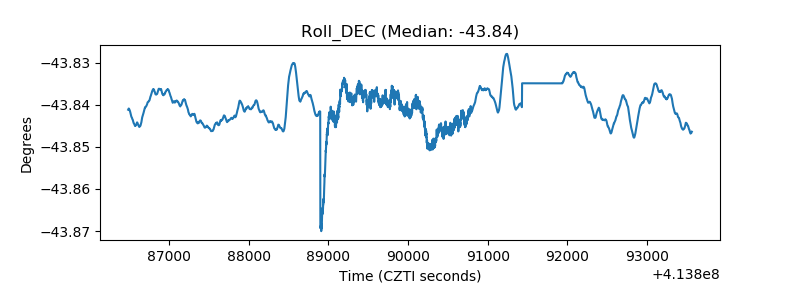 |
| _Roll_RA | 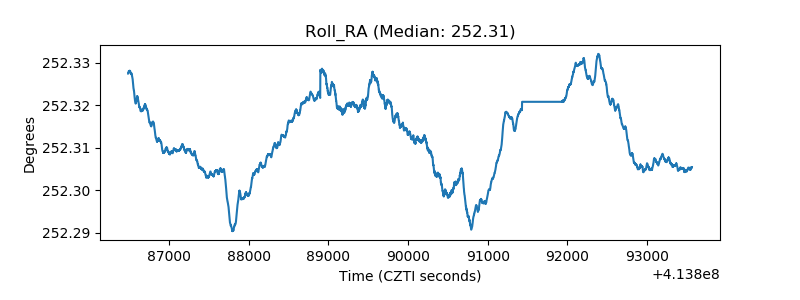 |
| Veto Counter | 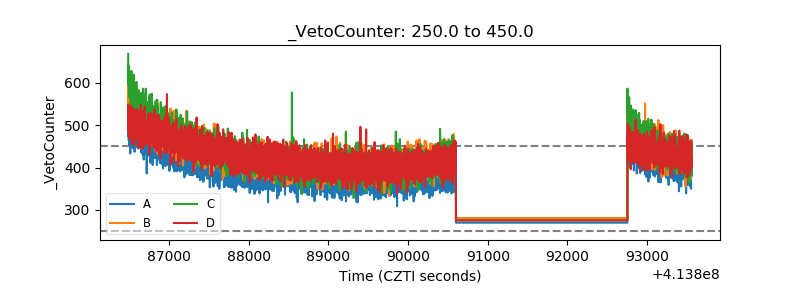 |