| Param | Original file | Final file |
|---|---|---|
| Filename | modeM0/AS1A12_032T03_9000005502_39883cztM0_level2.fits | modeM0/AS1A12_032T03_9000005502_39883cztM0_level2_quad_clean.evt |
| Size (bytes) | 366,307,200 | 88,957,440 |
| Size | 349.3 MB | 84.8 MB |
| Events in quadrant A | 3,211,841 | 599,971 |
| Events in quadrant B | 2,949,732 | 612,549 |
| Events in quadrant C | 2,720,145 | 599,209 |
| Events in quadrant D | 4,274,221 | 518,464 |
| Mode SS | |||
|---|---|---|---|
| Quadrant | BADHDUFLAG | Total packets | Discarded packets |
| A | 0 | 106 | 0 |
| B | 0 | 106 | 0 |
| C | 0 | 106 | 0 |
| D | 0 | 106 | 0 |
| Mode M9 | |||
|---|---|---|---|
| Quadrant | BADHDUFLAG | Total packets | Discarded packets |
| A | 0 | 28 | 0 |
| B | 0 | 28 | 0 |
| C | 0 | 28 | 0 |
| D | 0 | 29 | 0 |
| Mode M0 | |||
|---|---|---|---|
| Quadrant | BADHDUFLAG | Total packets | Discarded packets |
| A | 0 | 12804 | 3 |
| B | 0 | 12088 | 2 |
| C | 0 | 10950 | 2 |
| D | 0 | 16117 | 2 |
| Quadrant | Total seconds | Saturated seconds | Saturation percentage |
|---|---|---|---|
| A | 5186 | 33 | 0.636329% |
| B | 5186 | 44 | 0.848438% |
| C | 5186 | 24 | 0.462784% |
| D | 5186 | 415 | 8.002314% |
Noise dominated data is calculated using 1-second bins in cleaned event files. If a bin has >2000 counts, and if more than 50% of those come from <1% of pixels, then it is considered to be noise-dominated and hence unusable.
| Quadrant | # 1 sec bins | Bins with >0 counts | Bins with >2000 counts | High rate bins dominated by noise | Noise dominated (total time) | Noise dominated (detector-on time) | Marked lightcurve |
|---|---|---|---|---|---|---|---|
| A | 7278 | 5187 | 26 | 26 | 0.36% | 0.50% | 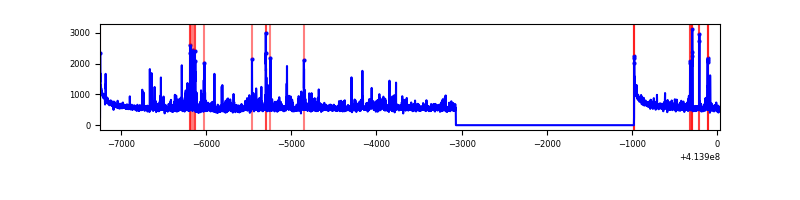 |
| B | 7278 | 5187 | 18 | 18 | 0.25% | 0.35% | 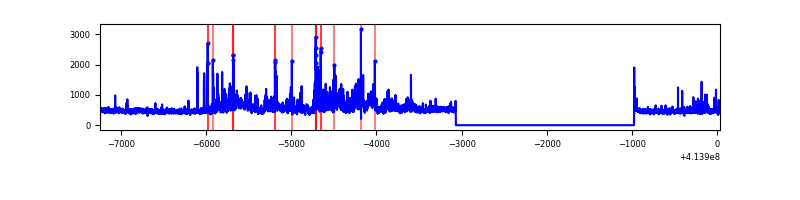 |
| C | 7278 | 5187 | 20 | 20 | 0.27% | 0.39% | 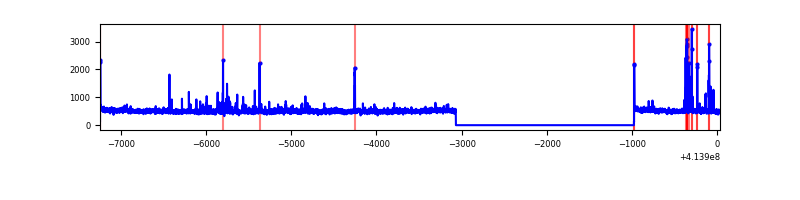 |
| D | 7278 | 5187 | 383 | 383 | 5.26% | 7.38% | 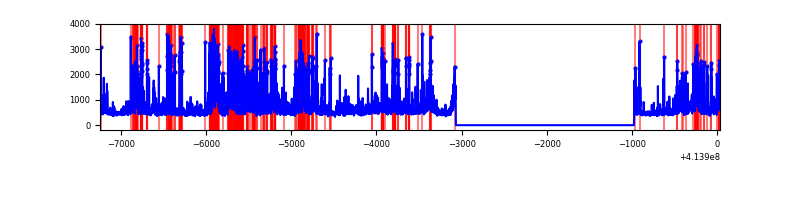 |
Top three noisy pixels from each quadrant. If the there are fewer than three noisy pixels in the level2.evt file, extra rows are filled as -1
| Pixel properties | Quadrant properties | ||||||
|---|---|---|---|---|---|---|---|
| Quadrant | DetID | PixID | Counts | Sigma | Mean | Median | Sigma |
| A | 10 | 83 | 514023 | 4270.74 | 591 | 580 | 120.2 |
| A | 6 | 10 | 140791 | 1166.25 | 591 | 580 | 120.2 |
| A | 14 | 250 | 72936 | 601.85 | 591 | 580 | 120.2 |
| B | 0 | 221 | 169702 | 1495.77 | 586 | 570 | 113.1 |
| B | 0 | 230 | 131499 | 1157.91 | 586 | 570 | 113.1 |
| B | 0 | 183 | 116365 | 1024.07 | 586 | 570 | 113.1 |
| C | 15 | 214 | 224249 | 1653.08 | 579 | 583 | 135.3 |
| C | 14 | 254 | 104878 | 770.83 | 579 | 583 | 135.3 |
| C | 1 | 16 | 48293 | 352.62 | 579 | 583 | 135.3 |
| D | 1 | 47 | 948045 | 6752.43 | 564 | 548 | 140.3 |
| D | 12 | 227 | 408195 | 2905.13 | 564 | 548 | 140.3 |
| D | 2 | 249 | 186850 | 1327.7 | 564 | 548 | 140.3 |
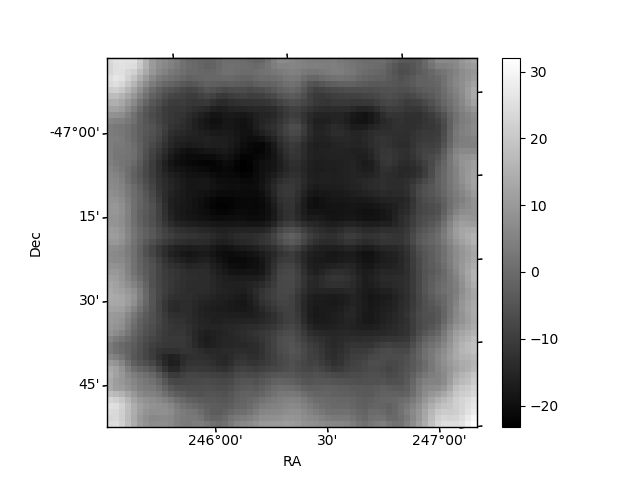
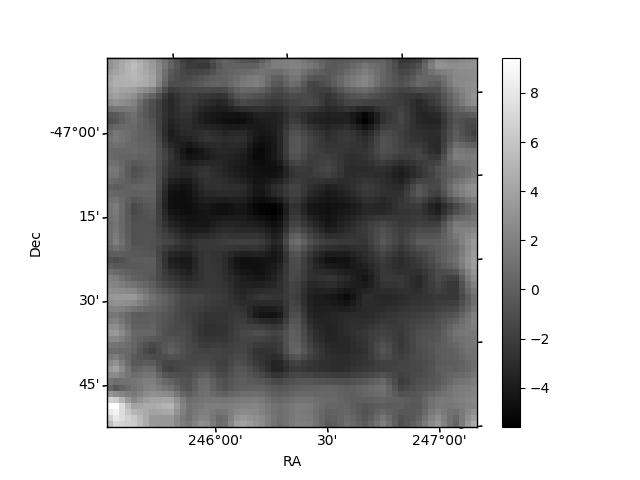
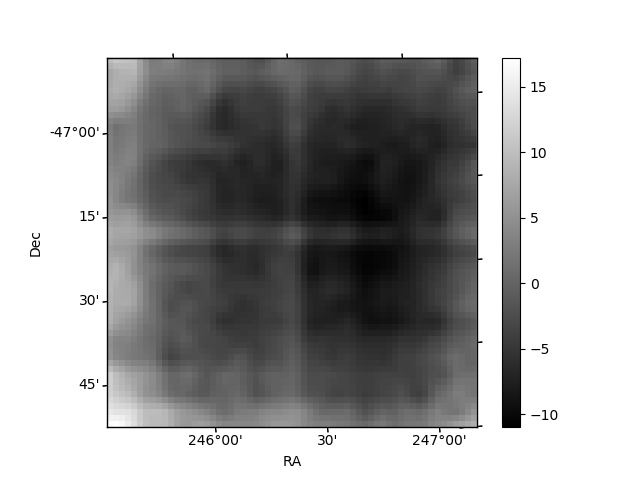
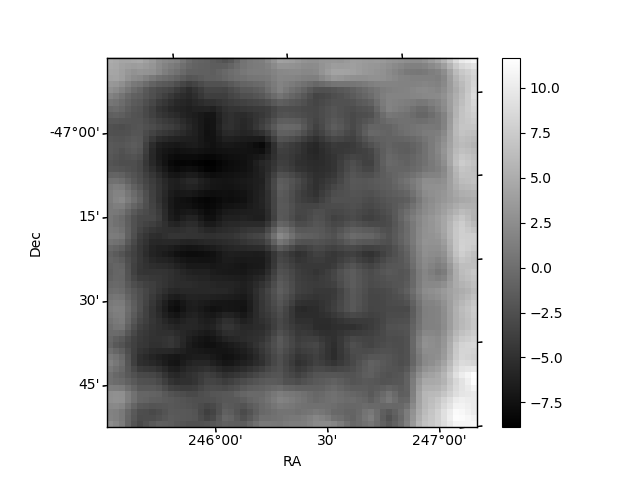
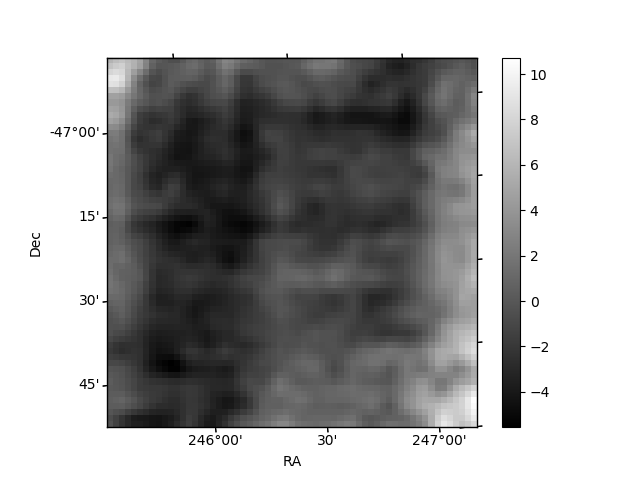
Histogram calculated using DETX and DETY for each event in the final _common_clean file
| Quadrant A | 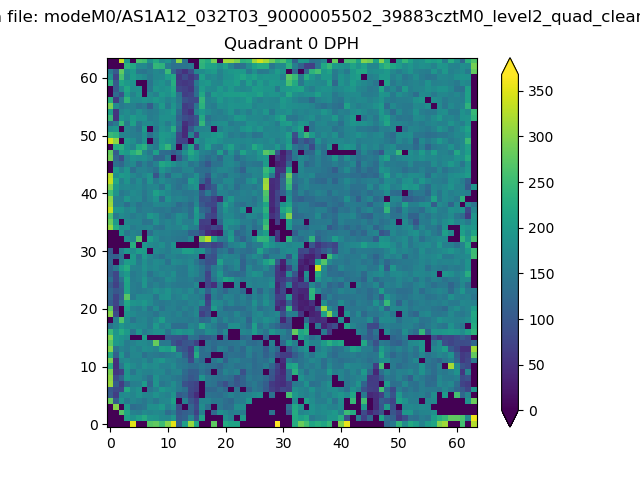 |
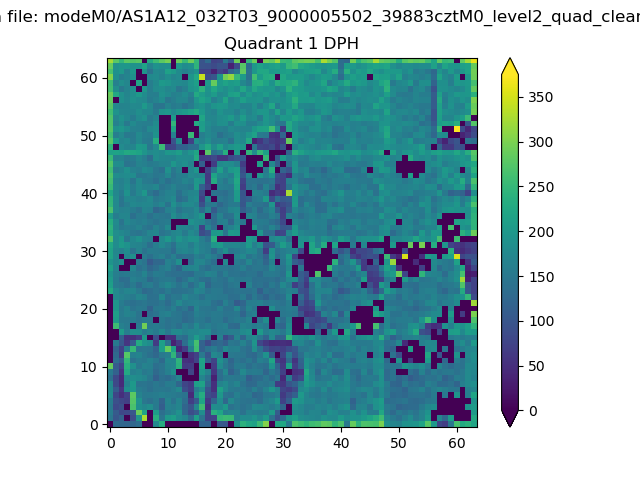 |
Quadrant B |
|---|---|---|---|
| Quadrant D | 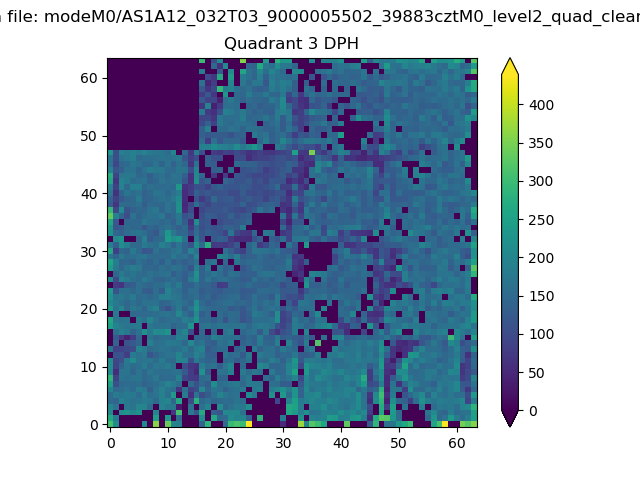 |
 |
Quadrant C |
| Plot type | Count rate plots | Images |
|---|---|---|
| Comparison with Poisson distribution Blue bars denote a histogram of data divided into 1 sec bins. Red curve is a Poisson curve with rate = median count rate of data. |
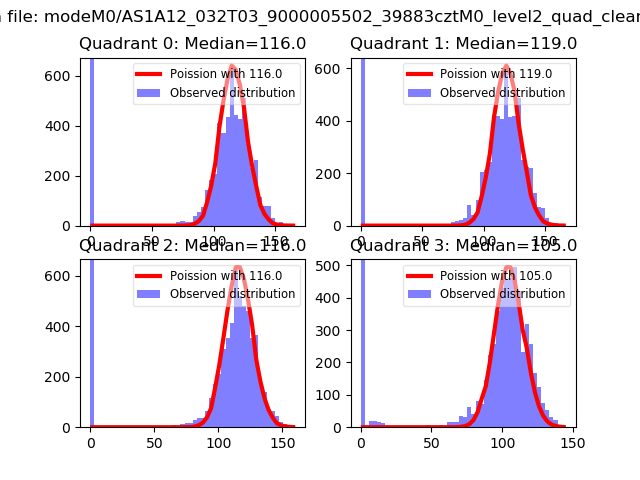 |
 |
| Quadrant-wise count rates Data is divided into 100 sec bins |
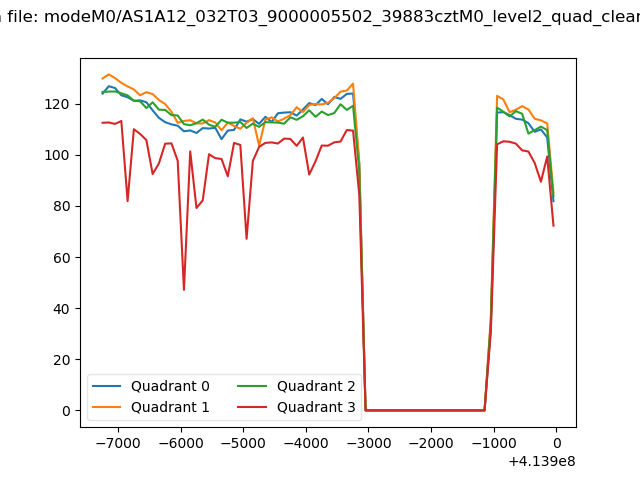 |
|
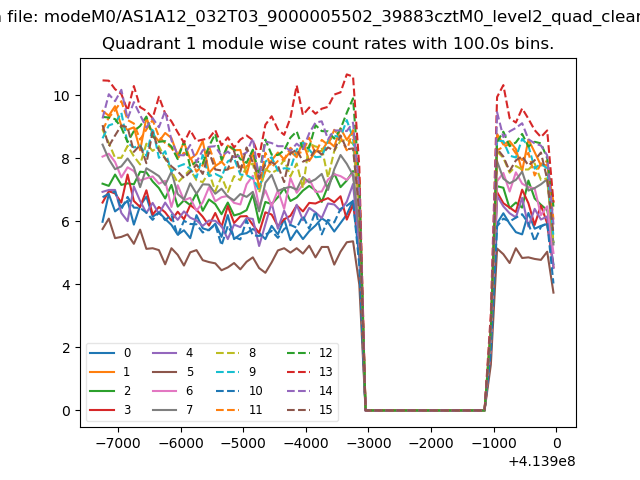
| Module-wise count rates for Quadrant A Data is divided into 100 sec bins |
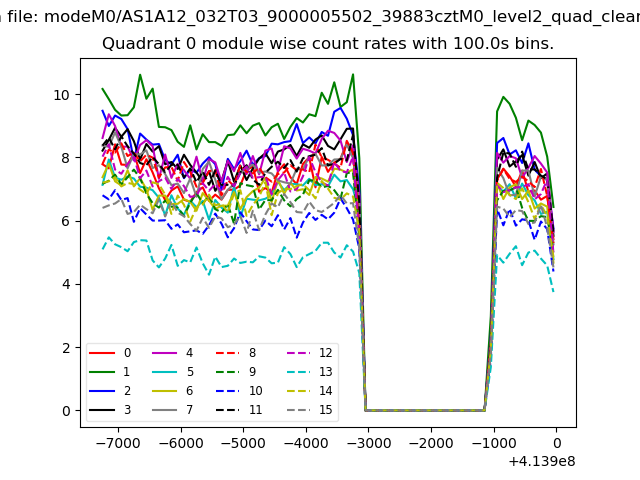 |
 |
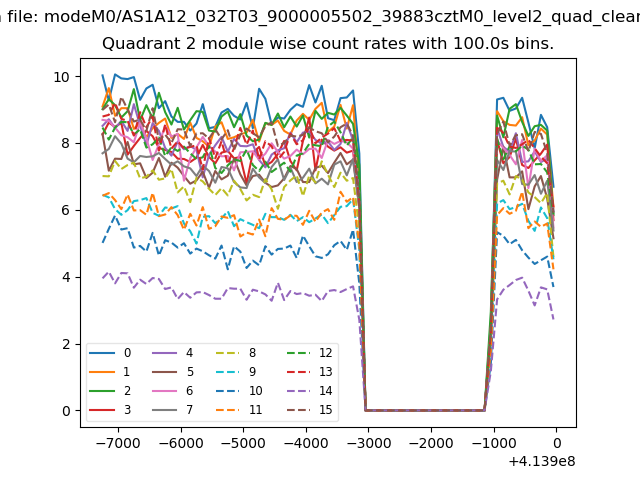
| Module-wise count rates for Quadrant B Data is divided into 100 sec bins |
 |
 |
| Module-wise count rates for Quadrant C Data is divided into 100 sec bins |
 |
 |
| Module-wise count rates for Quadrant D Data is divided into 100 sec bins |
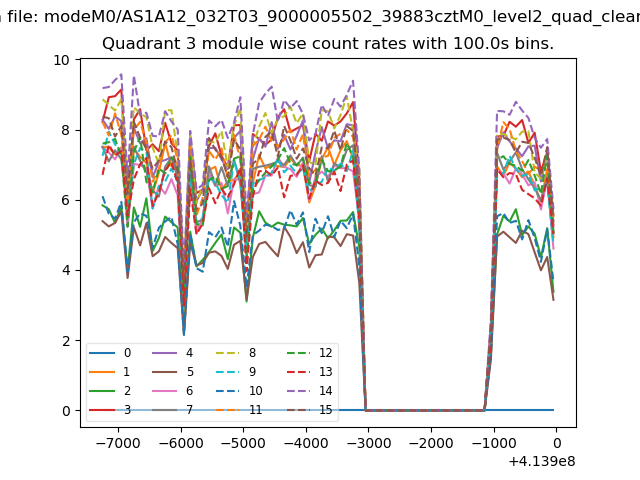 |
 |
| Parameter | Plot |
|---|---|
| CZT HV Monitor | 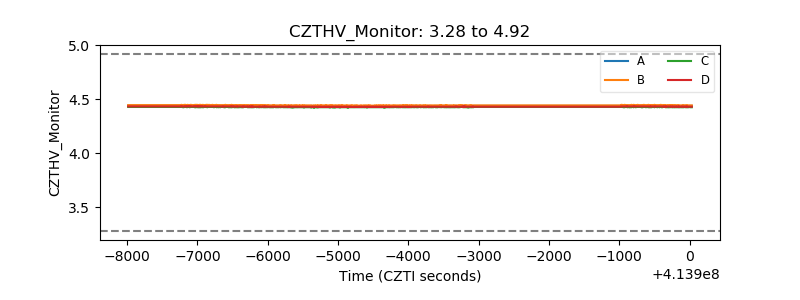 |
| D_VDD | 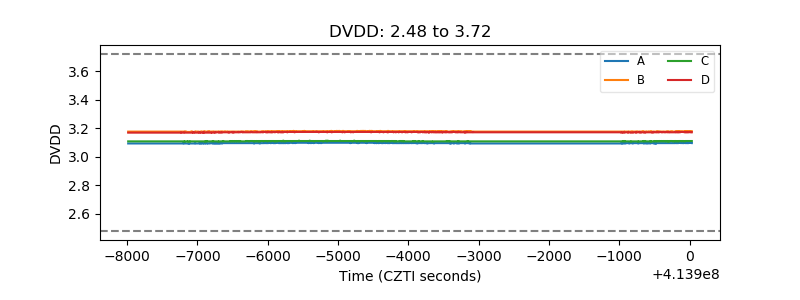 |
| Temperature 1 | 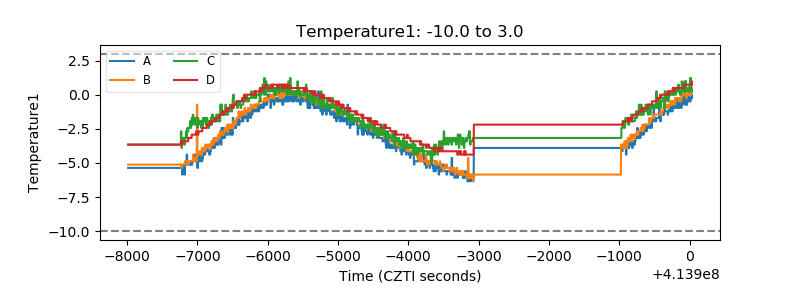 |
| Veto HV Monitor |  |
| Veto LLD | 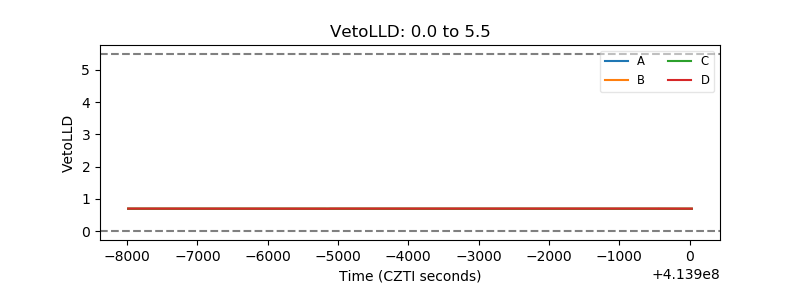 |
| Alpha Counter | 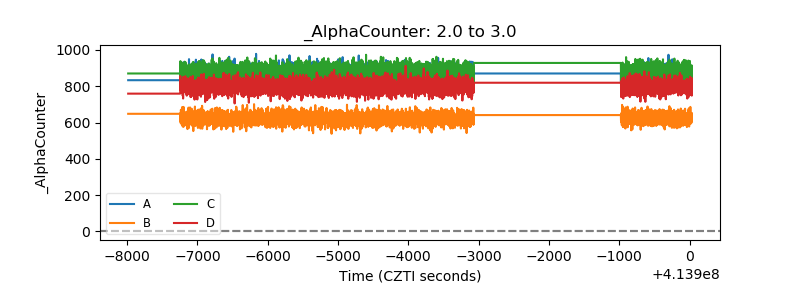 |
| _CPM_Rate | 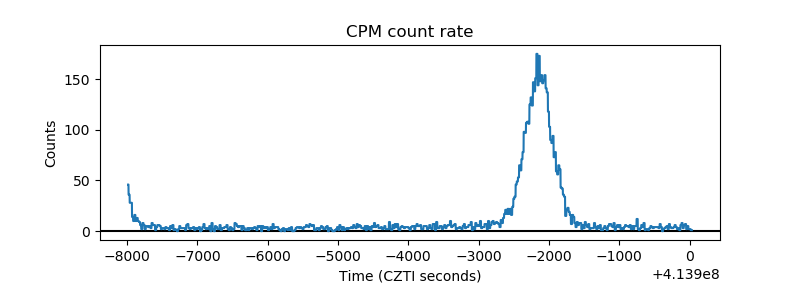 |
| CZT Counter | 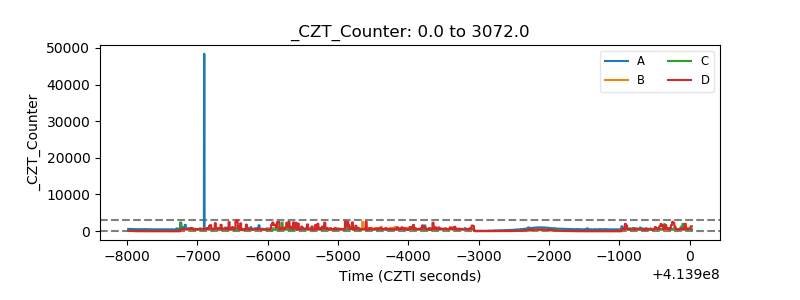 |
| +2.5 Volts monitor | 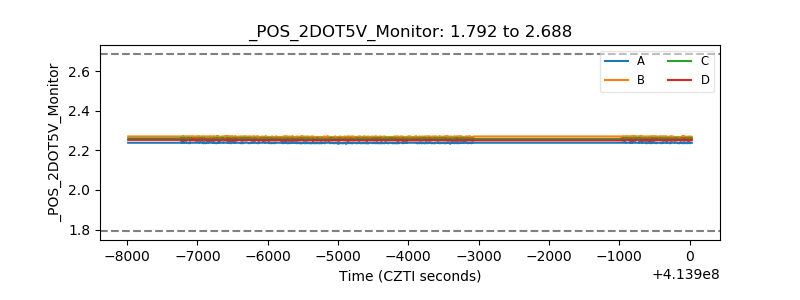 |
| +5 Volts monitor | 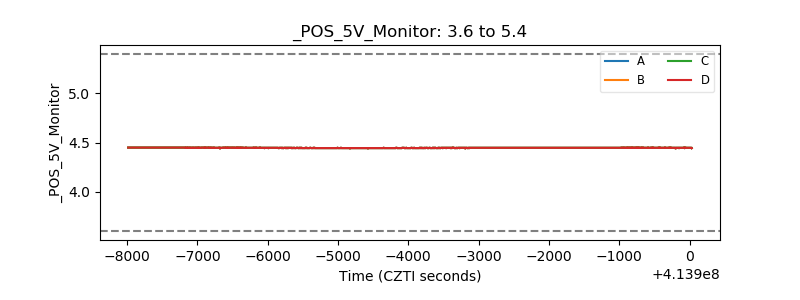 |
| _ROLL_ROT | 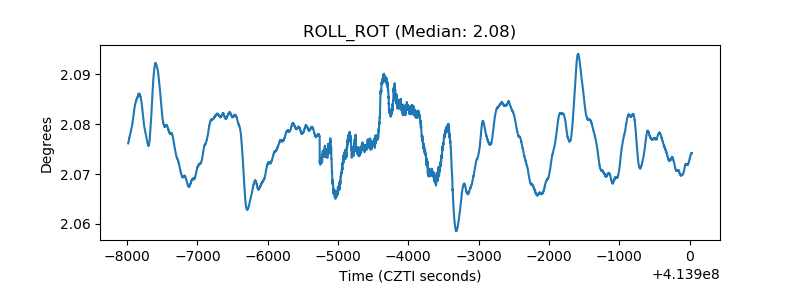 |
| _Roll_DEC | 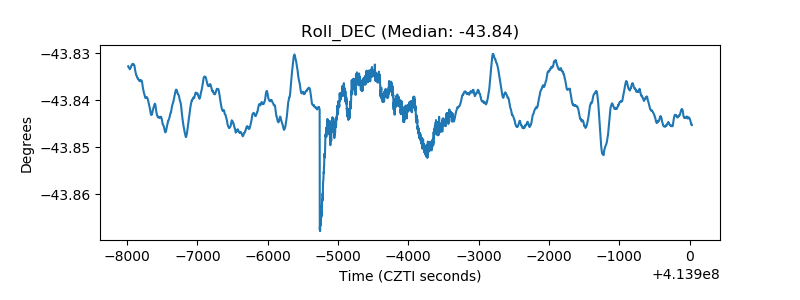 |
| _Roll_RA | 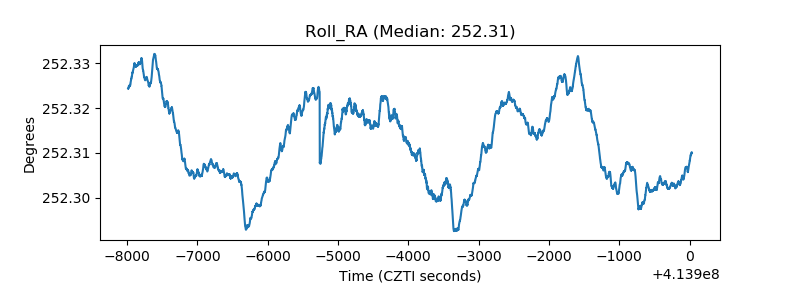 |
| Veto Counter | 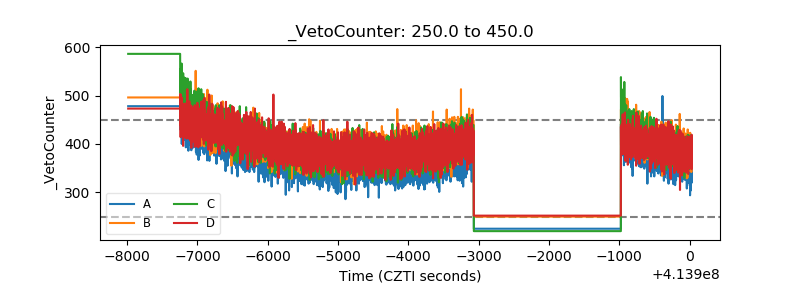 |