| Param | Original file | Final file |
|---|---|---|
| Filename | modeM0/AS1A12_032T03_9000005502_39884cztM0_level2.fits | modeM0/AS1A12_032T03_9000005502_39884cztM0_level2_quad_clean.evt |
| Size (bytes) | 411,701,760 | 89,619,840 |
| Size | 392.6 MB | 85.5 MB |
| Events in quadrant A | 3,336,806 | 601,242 |
| Events in quadrant B | 3,681,568 | 609,079 |
| Events in quadrant C | 3,019,126 | 599,655 |
| Events in quadrant D | 4,778,815 | 522,084 |
| Mode SS | |||
|---|---|---|---|
| Quadrant | BADHDUFLAG | Total packets | Discarded packets |
| A | 0 | 110 | 0 |
| B | 0 | 110 | 0 |
| C | 0 | 110 | 0 |
| D | 0 | 110 | 0 |
| Mode M9 | |||
|---|---|---|---|
| Quadrant | BADHDUFLAG | Total packets | Discarded packets |
| A | 0 | 25 | 0 |
| B | 0 | 25 | 0 |
| C | 0 | 25 | 0 |
| D | 0 | 26 | 0 |
| Mode M0 | |||
|---|---|---|---|
| Quadrant | BADHDUFLAG | Total packets | Discarded packets |
| A | 0 | 13186 | 3 |
| B | 0 | 14555 | 2 |
| C | 0 | 12151 | 2 |
| D | 0 | 17945 | 2 |
| Quadrant | Total seconds | Saturated seconds | Saturation percentage |
|---|---|---|---|
| A | 5451 | 69 | 1.265823% |
| B | 5451 | 129 | 2.366538% |
| C | 5451 | 66 | 1.210787% |
| D | 5451 | 439 | 8.053568% |
Noise dominated data is calculated using 1-second bins in cleaned event files. If a bin has >2000 counts, and if more than 50% of those come from <1% of pixels, then it is considered to be noise-dominated and hence unusable.
| Quadrant | # 1 sec bins | Bins with >0 counts | Bins with >2000 counts | High rate bins dominated by noise | Noise dominated (total time) | Noise dominated (detector-on time) | Marked lightcurve |
|---|---|---|---|---|---|---|---|
| A | 7333 | 5452 | 56 | 56 | 0.76% | 1.03% | 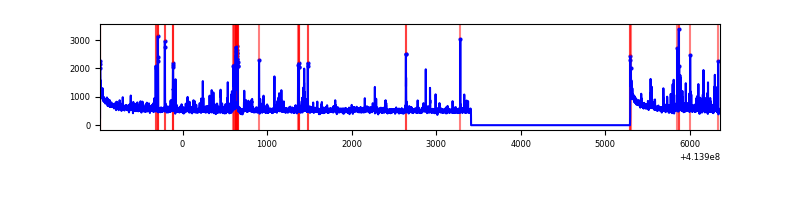 |
| B | 7333 | 5452 | 65 | 65 | 0.89% | 1.19% |  |
| C | 7333 | 5452 | 55 | 55 | 0.75% | 1.01% | 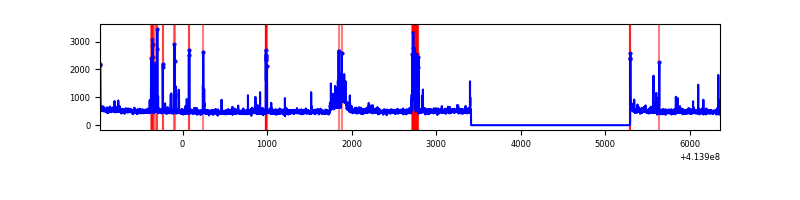 |
| D | 7333 | 5452 | 398 | 398 | 5.43% | 7.30% | 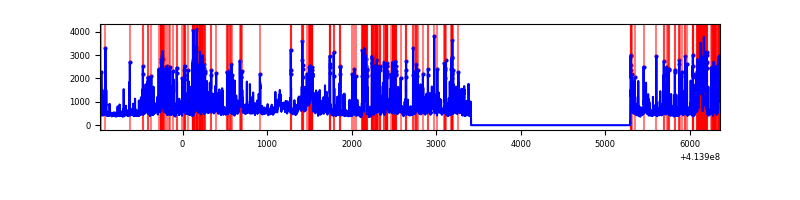 |
Top three noisy pixels from each quadrant. If the there are fewer than three noisy pixels in the level2.evt file, extra rows are filled as -1
| Pixel properties | Quadrant properties | ||||||
|---|---|---|---|---|---|---|---|
| Quadrant | DetID | PixID | Counts | Sigma | Mean | Median | Sigma |
| A | 10 | 83 | 551922 | 4457.03 | 605 | 593 | 123.7 |
| A | 14 | 250 | 208134 | 1677.8 | 605 | 593 | 123.7 |
| A | 9 | 143 | 76350 | 612.43 | 605 | 593 | 123.7 |
| B | 0 | 221 | 335588 | 2899.18 | 599 | 583 | 115.6 |
| B | 0 | 183 | 295621 | 2553.3 | 599 | 583 | 115.6 |
| B | 0 | 230 | 138332 | 1192.1 | 599 | 583 | 115.6 |
| C | 14 | 254 | 292619 | 2103.0 | 592 | 597 | 138.9 |
| C | 15 | 214 | 234630 | 1685.4 | 592 | 597 | 138.9 |
| C | 1 | 16 | 64272 | 458.56 | 592 | 597 | 138.9 |
| D | 12 | 227 | 701096 | 4879.12 | 577 | 560 | 143.6 |
| D | 2 | 250 | 573132 | 3987.88 | 577 | 560 | 143.6 |
| D | 1 | 47 | 338218 | 2351.74 | 577 | 560 | 143.6 |
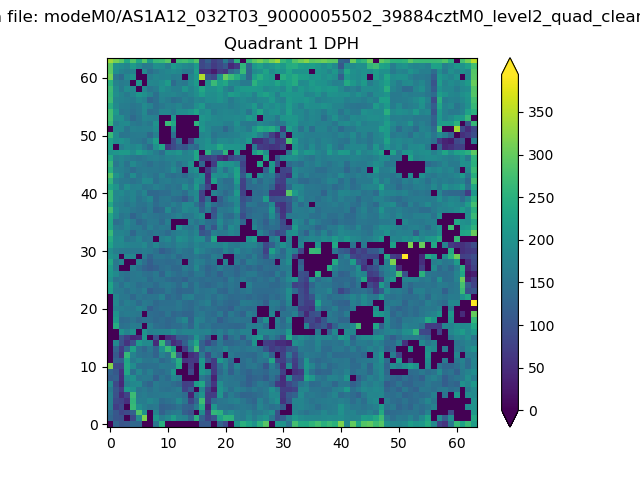
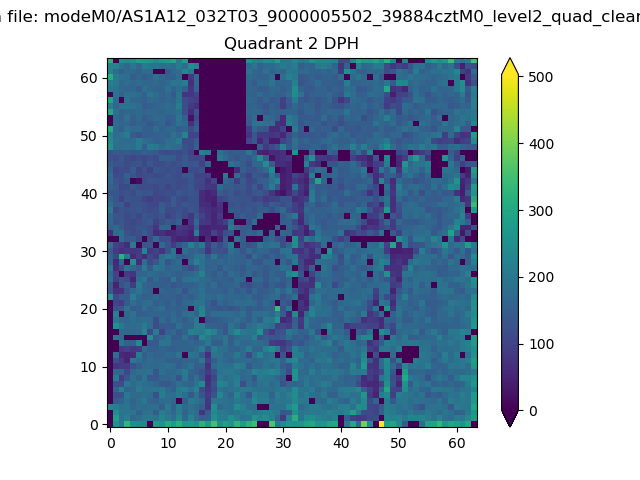
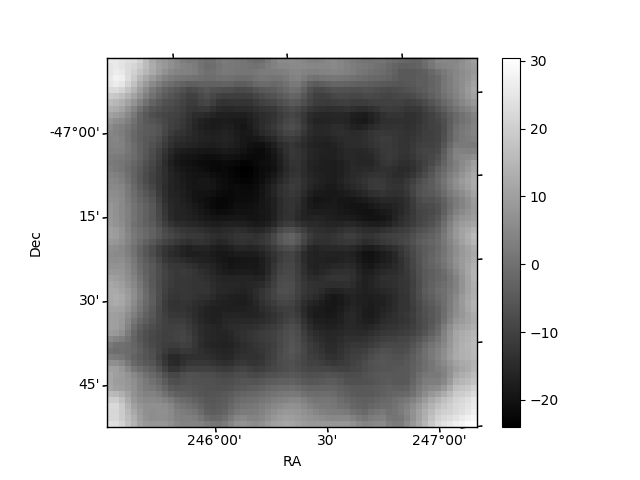
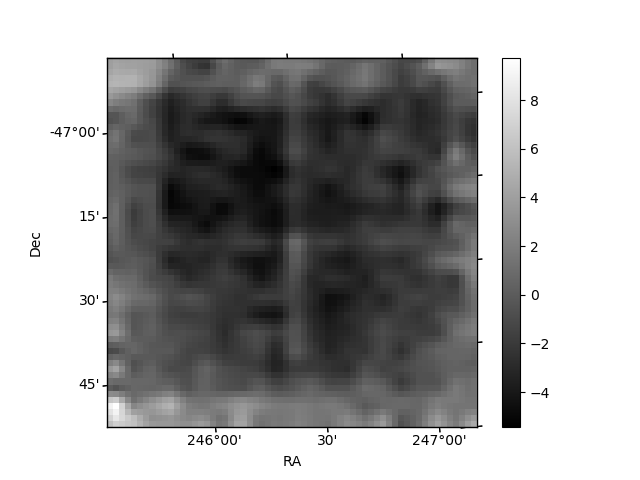
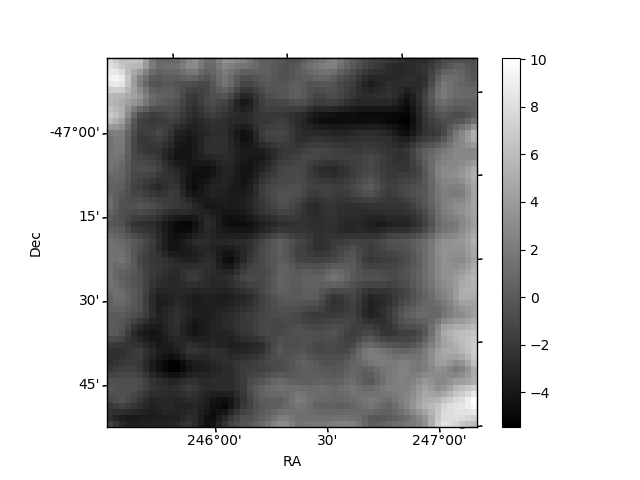
Histogram calculated using DETX and DETY for each event in the final _common_clean file
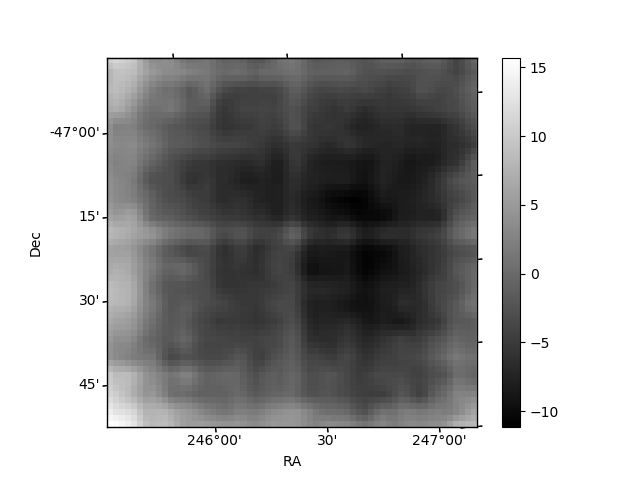
| Quadrant A | 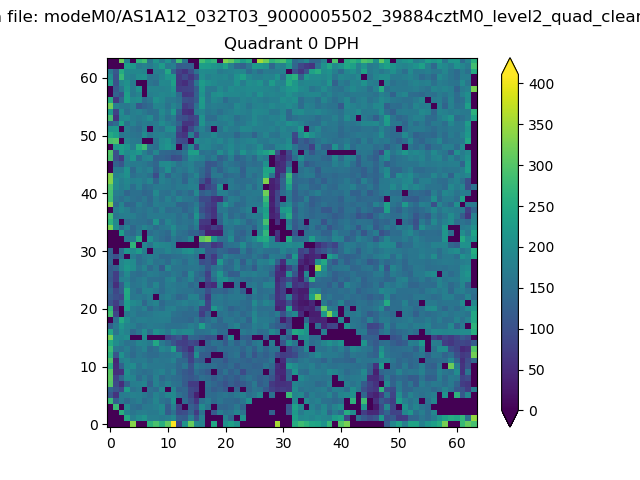 |
 |
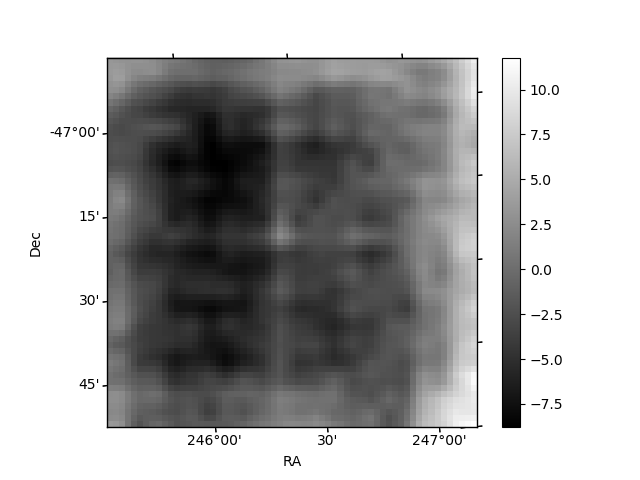
Quadrant B |
|---|---|---|---|
| Quadrant D | 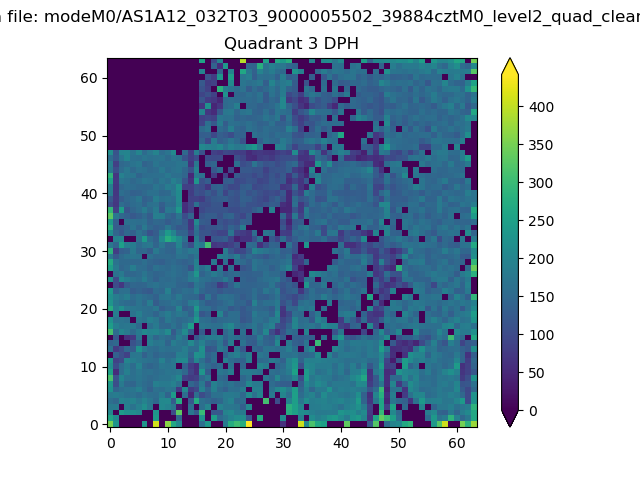 |
 |
Quadrant C |
| Plot type | Count rate plots | Images |
|---|---|---|
| Comparison with Poisson distribution Blue bars denote a histogram of data divided into 1 sec bins. Red curve is a Poisson curve with rate = median count rate of data. |
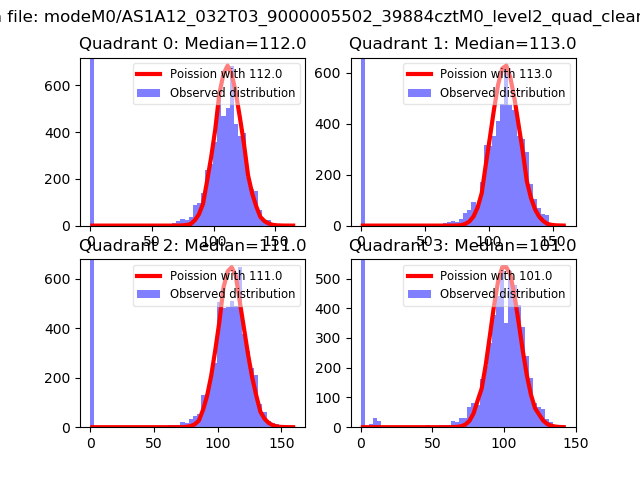 |
 |
| Quadrant-wise count rates Data is divided into 100 sec bins |
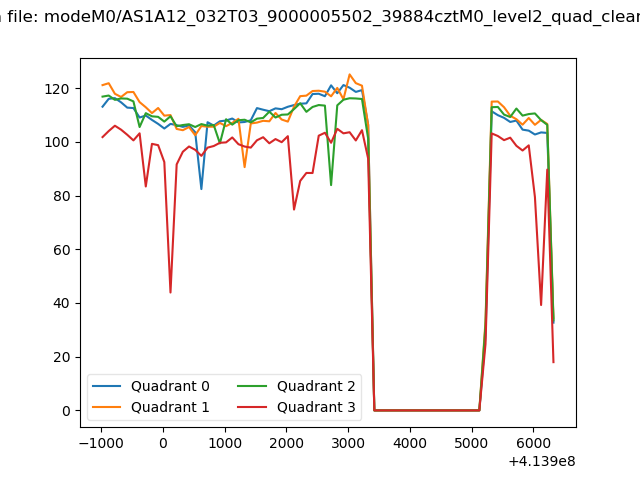 |
|
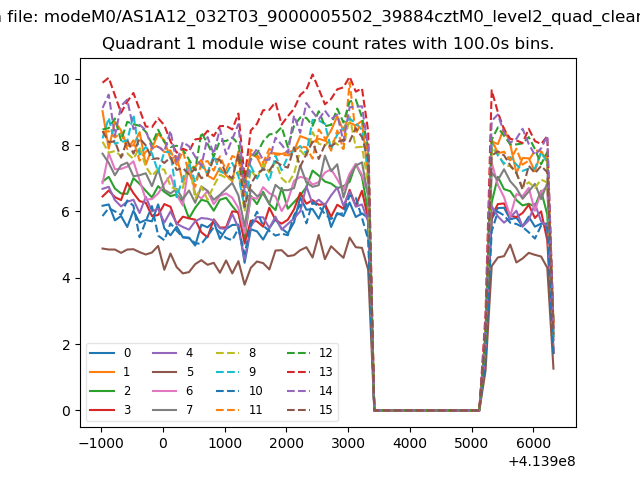
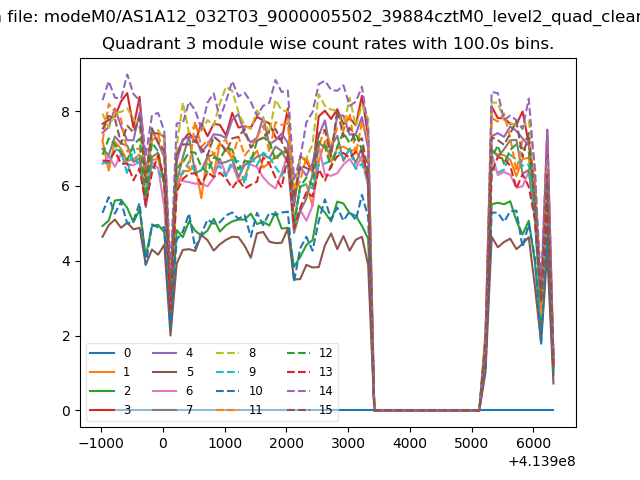
| Module-wise count rates for Quadrant A Data is divided into 100 sec bins |
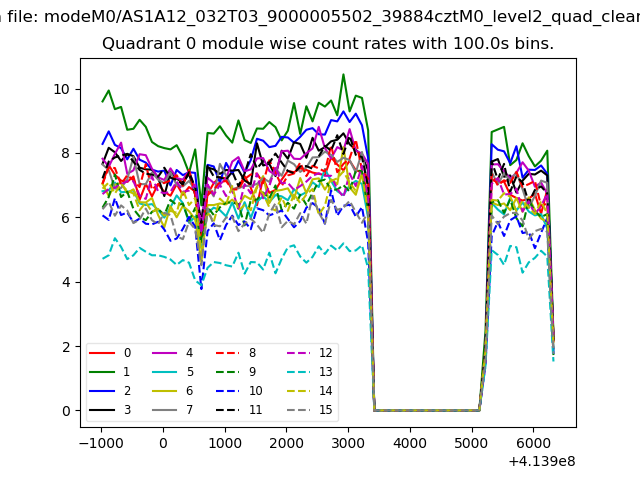 |
 |
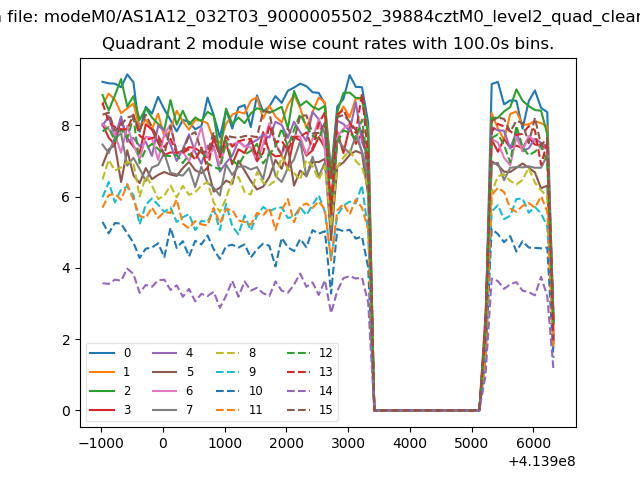
| Module-wise count rates for Quadrant B Data is divided into 100 sec bins |
 |
 |
| Module-wise count rates for Quadrant C Data is divided into 100 sec bins |
 |
 |
| Module-wise count rates for Quadrant D Data is divided into 100 sec bins |
 |
 |
| Parameter | Plot |
|---|---|
| CZT HV Monitor | 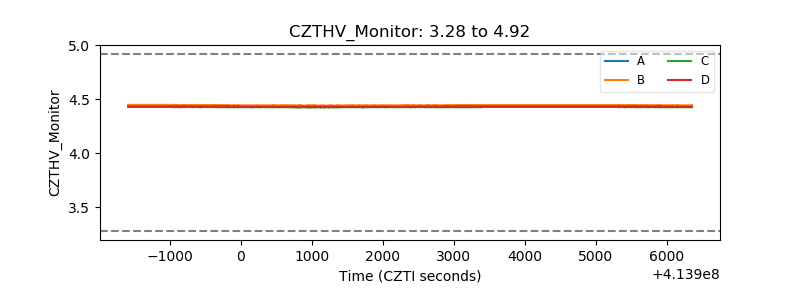 |
| D_VDD | 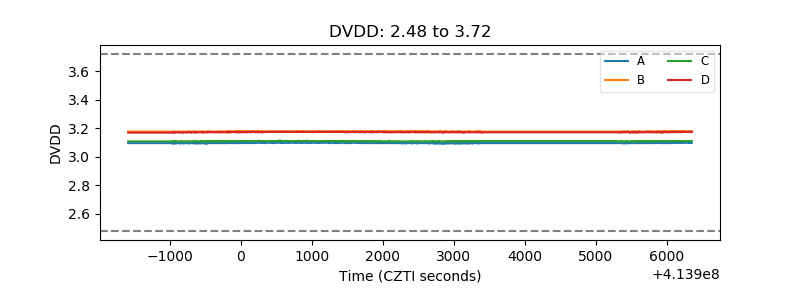 |
| Temperature 1 | 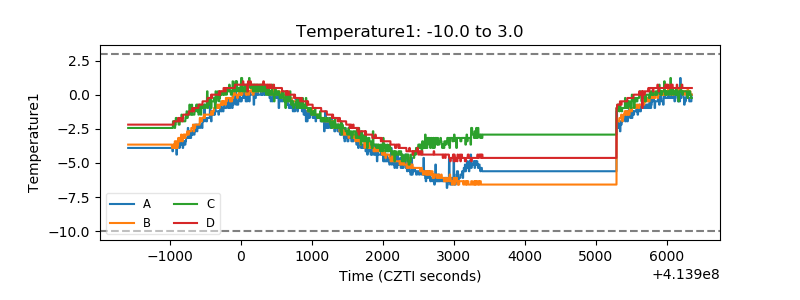 |
| Veto HV Monitor | 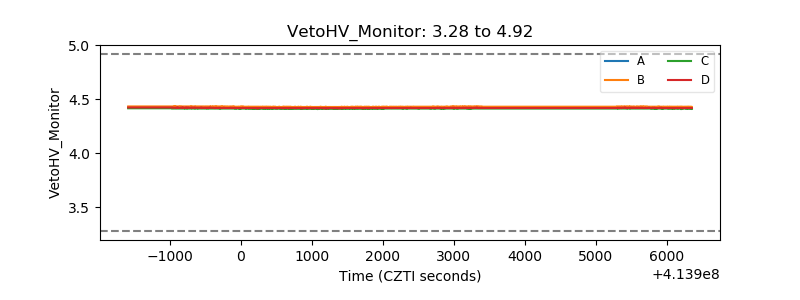 |
| Veto LLD | 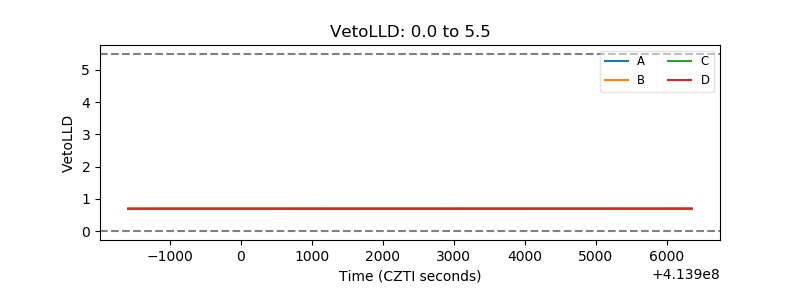 |
| Alpha Counter | 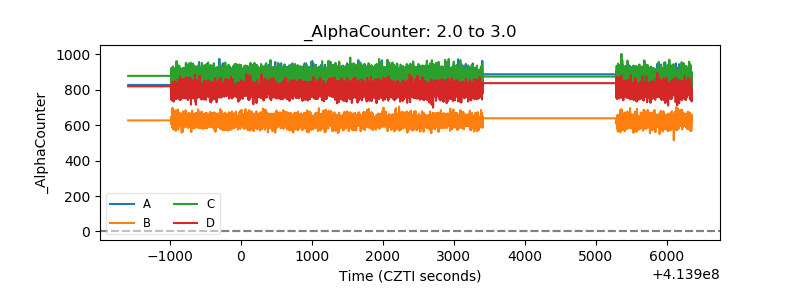 |
| _CPM_Rate | 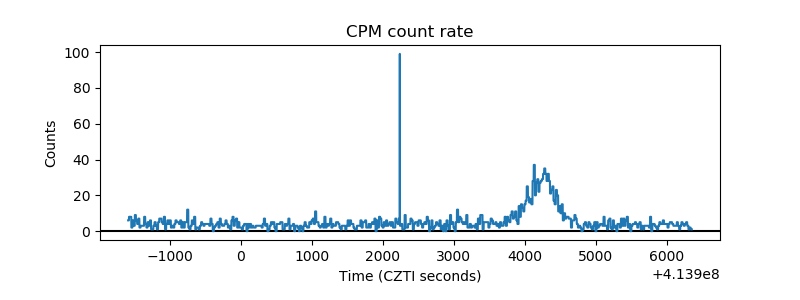 |
| CZT Counter | 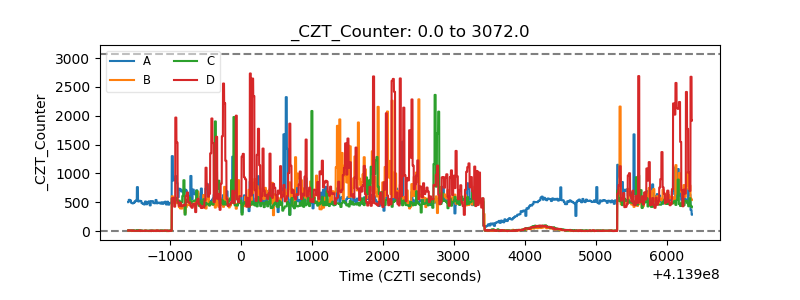 |
| +2.5 Volts monitor | 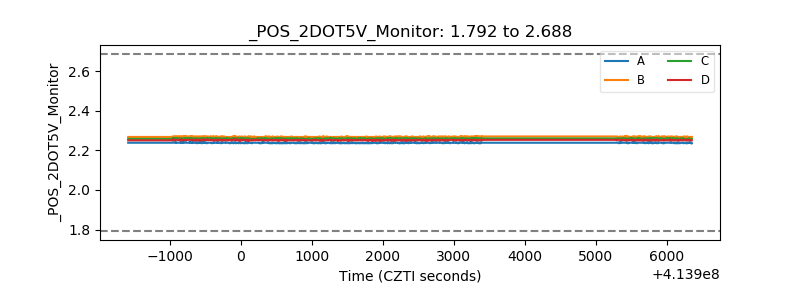 |
| +5 Volts monitor | 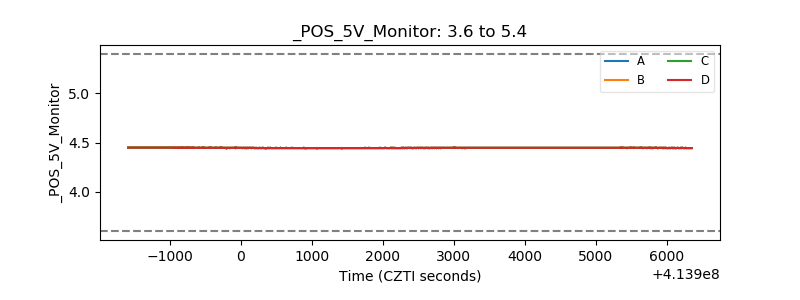 |
| _ROLL_ROT | 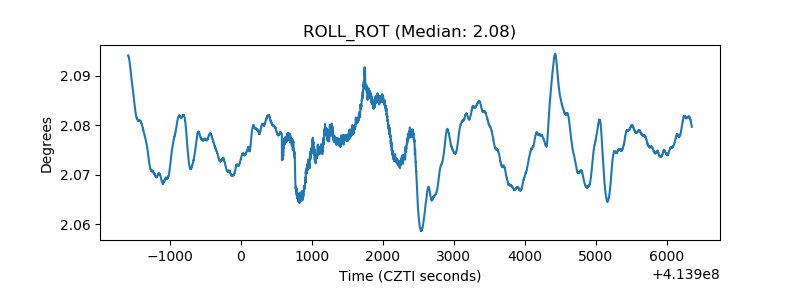 |
| _Roll_DEC | 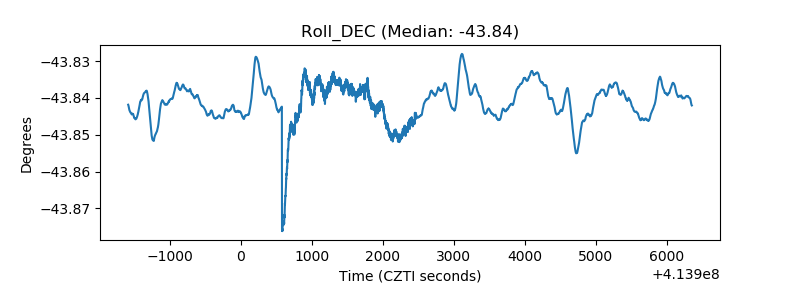 |
| _Roll_RA | 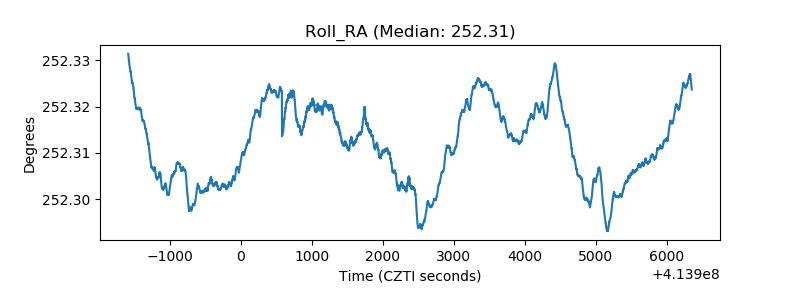 |
| Veto Counter | 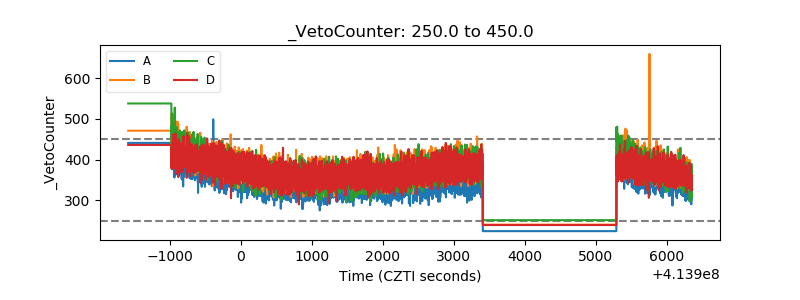 |