| Param | Original file | Final file |
|---|---|---|
| Filename | modeM0/AS1A12_032T03_9000005502_39885cztM0_level2.fits | modeM0/AS1A12_032T03_9000005502_39885cztM0_level2_quad_clean.evt |
| Size (bytes) | 447,482,880 | 91,080,000 |
| Size | 426.8 MB | 86.9 MB |
| Events in quadrant A | 3,625,848 | 615,126 |
| Events in quadrant B | 3,754,057 | 625,784 |
| Events in quadrant C | 2,839,242 | 621,806 |
| Events in quadrant D | 5,901,892 | 495,884 |
| Mode SS | |||
|---|---|---|---|
| Quadrant | BADHDUFLAG | Total packets | Discarded packets |
| A | 0 | 116 | 0 |
| B | 0 | 116 | 0 |
| C | 0 | 116 | 0 |
| D | 0 | 116 | 0 |
| Mode M9 | |||
|---|---|---|---|
| Quadrant | BADHDUFLAG | Total packets | Discarded packets |
| A | 0 | 21 | 0 |
| B | 0 | 21 | 0 |
| C | 0 | 21 | 0 |
| D | 0 | 22 | 0 |
| Mode M0 | |||
|---|---|---|---|
| Quadrant | BADHDUFLAG | Total packets | Discarded packets |
| A | 0 | 14334 | 3 |
| B | 0 | 14975 | 2 |
| C | 0 | 11783 | 2 |
| D | 0 | 21440 | 2 |
| Quadrant | Total seconds | Saturated seconds | Saturation percentage |
|---|---|---|---|
| A | 5705 | 106 | 1.858019% |
| B | 5705 | 161 | 2.822086% |
| C | 5705 | 15 | 0.262927% |
| D | 5705 | 956 | 16.757230% |
Noise dominated data is calculated using 1-second bins in cleaned event files. If a bin has >2000 counts, and if more than 50% of those come from <1% of pixels, then it is considered to be noise-dominated and hence unusable.
| Quadrant | # 1 sec bins | Bins with >0 counts | Bins with >2000 counts | High rate bins dominated by noise | Noise dominated (total time) | Noise dominated (detector-on time) | Marked lightcurve |
|---|---|---|---|---|---|---|---|
| A | 7228 | 5706 | 76 | 76 | 1.05% | 1.33% | 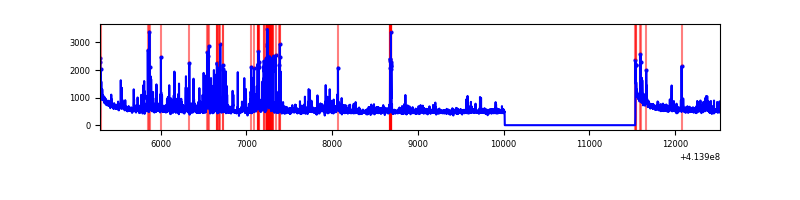 |
| B | 7228 | 5706 | 94 | 94 | 1.30% | 1.65% | 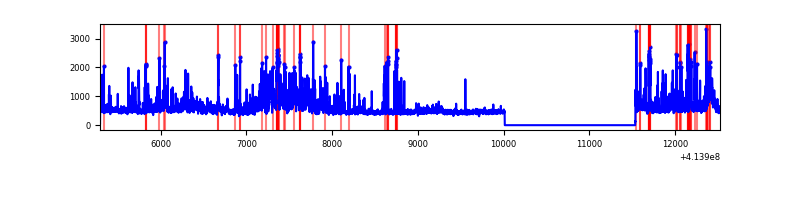 |
| C | 7228 | 5706 | 10 | 10 | 0.14% | 0.18% | 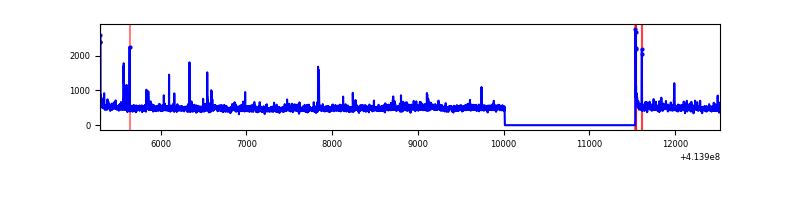 |
| D | 7228 | 5706 | 879 | 879 | 12.16% | 15.40% | 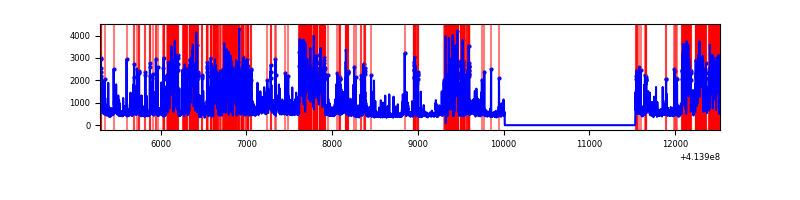 |
Top three noisy pixels from each quadrant. If the there are fewer than three noisy pixels in the level2.evt file, extra rows are filled as -1
| Pixel properties | Quadrant properties | ||||||
|---|---|---|---|---|---|---|---|
| Quadrant | DetID | PixID | Counts | Sigma | Mean | Median | Sigma |
| A | 10 | 83 | 572658 | 4490.88 | 623 | 611 | 127.4 |
| A | 14 | 250 | 377913 | 2962.03 | 623 | 611 | 127.4 |
| A | 6 | 10 | 90765 | 707.76 | 623 | 611 | 127.4 |
| B | 0 | 221 | 277785 | 2322.28 | 620 | 604 | 119.4 |
| B | 5 | 255 | 249226 | 2083.01 | 620 | 604 | 119.4 |
| B | 0 | 183 | 222693 | 1860.71 | 620 | 604 | 119.4 |
| C | 15 | 214 | 245320 | 1696.48 | 614 | 618 | 144.2 |
| C | 1 | 16 | 66990 | 460.15 | 614 | 618 | 144.2 |
| C | 14 | 254 | 43409 | 296.66 | 614 | 618 | 144.2 |
| D | 2 | 250 | 1158113 | 8116.73 | 572 | 555 | 142.6 |
| D | 12 | 227 | 1023582 | 7173.41 | 572 | 555 | 142.6 |
| D | 12 | 233 | 850688 | 5961.08 | 572 | 555 | 142.6 |
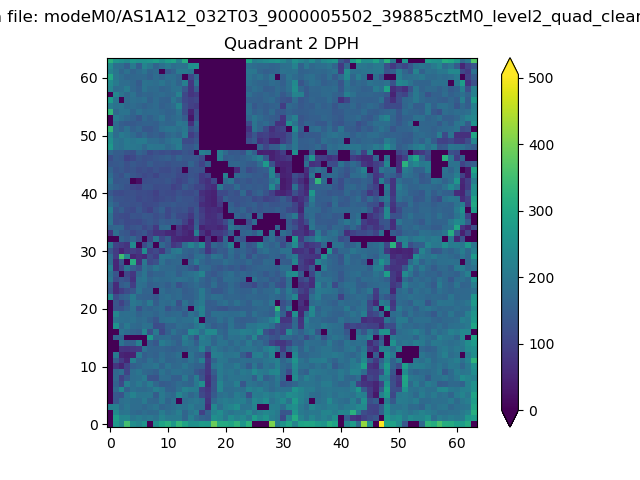
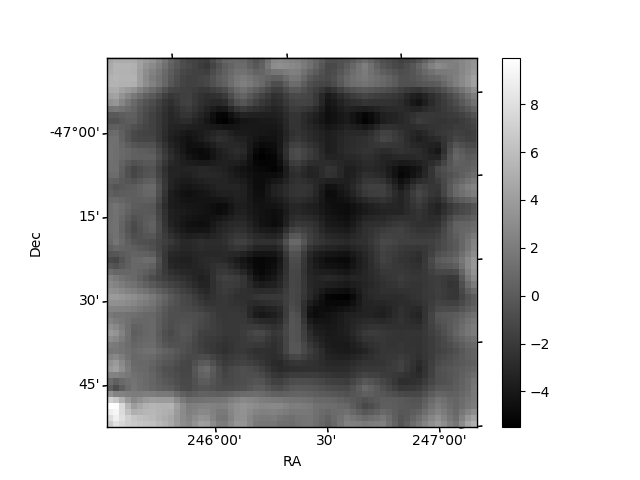
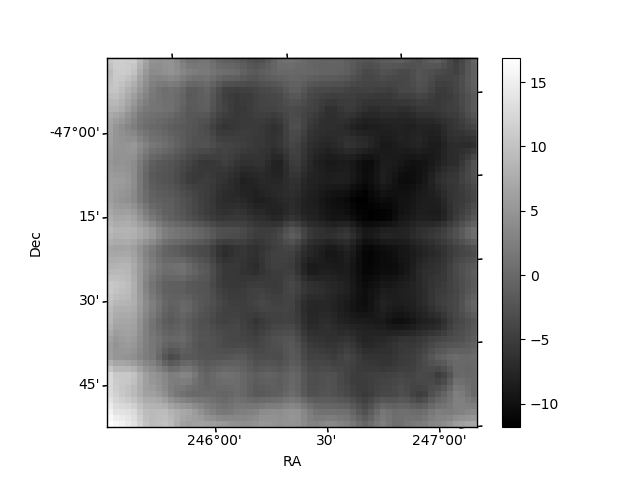
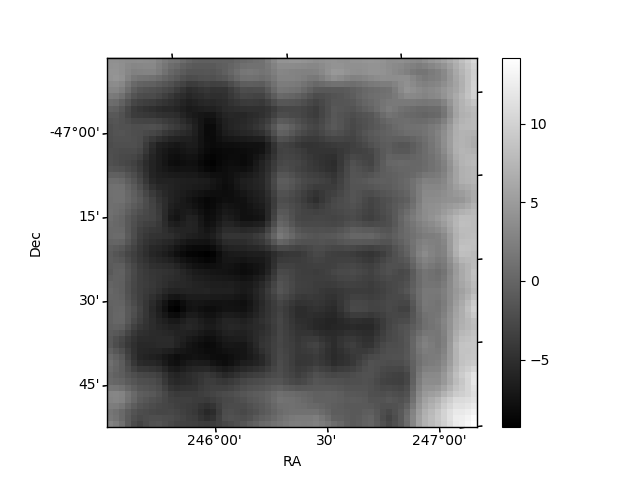
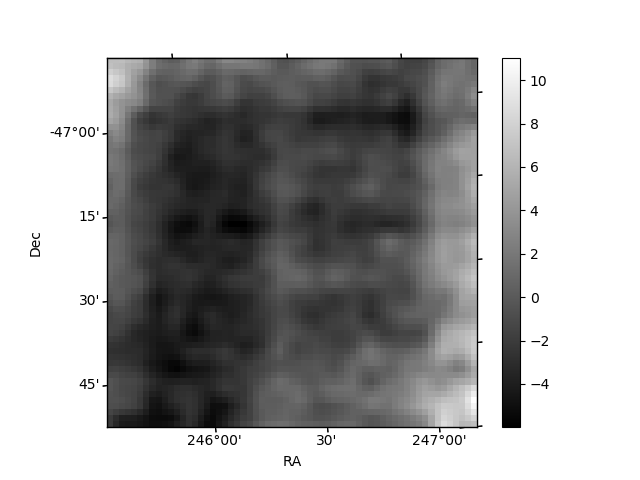
Histogram calculated using DETX and DETY for each event in the final _common_clean file
| Quadrant A | 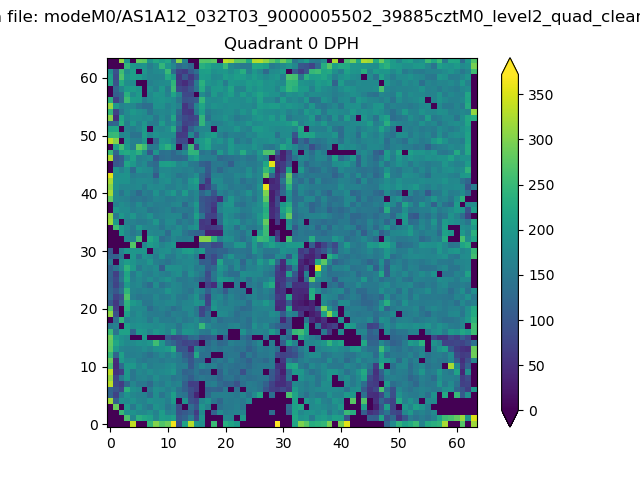 |
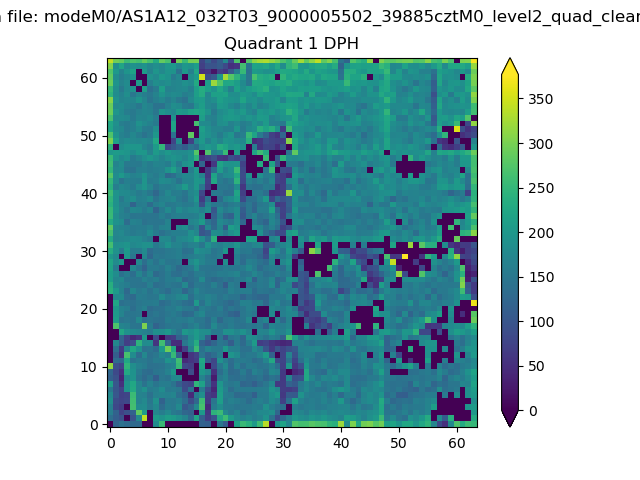 |
Quadrant B |
|---|---|---|---|
| Quadrant D | 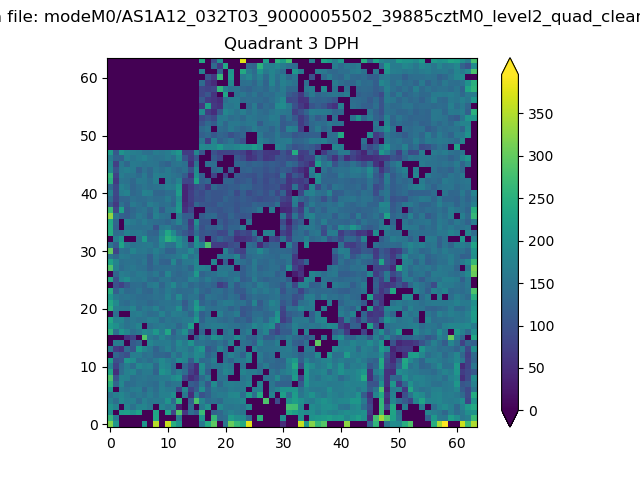 |
 |
Quadrant C |
| Plot type | Count rate plots | Images |
|---|---|---|
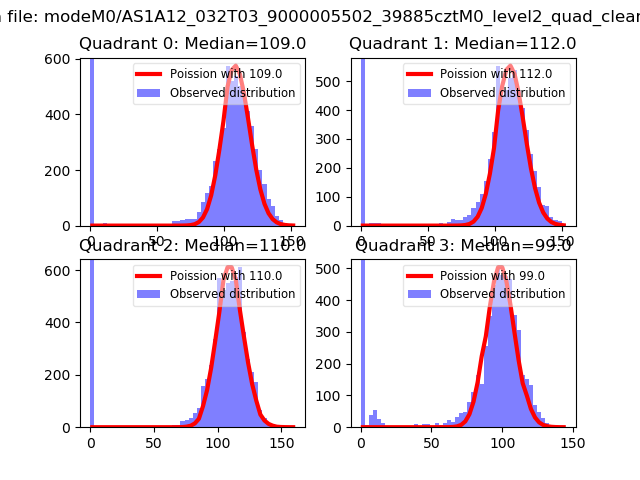
| Comparison with Poisson distribution Blue bars denote a histogram of data divided into 1 sec bins. Red curve is a Poisson curve with rate = median count rate of data. |
 |
 |
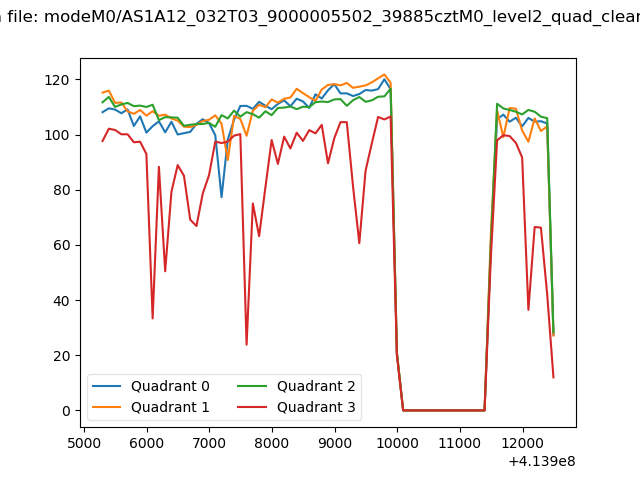
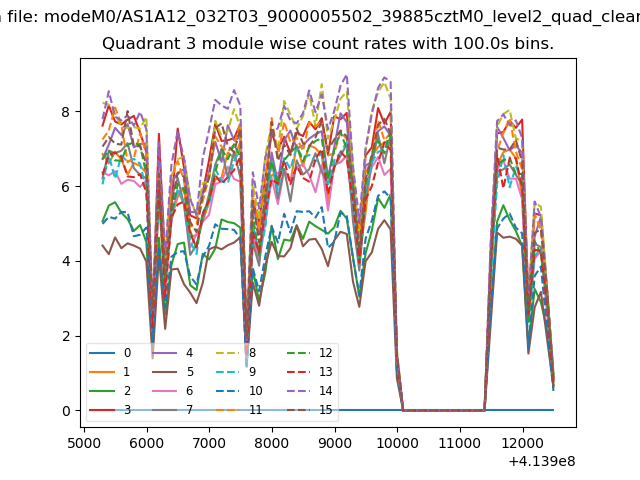
| Quadrant-wise count rates Data is divided into 100 sec bins |
 |
|
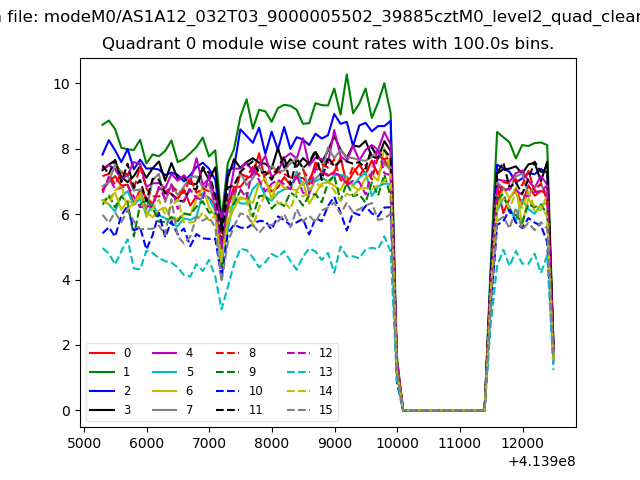
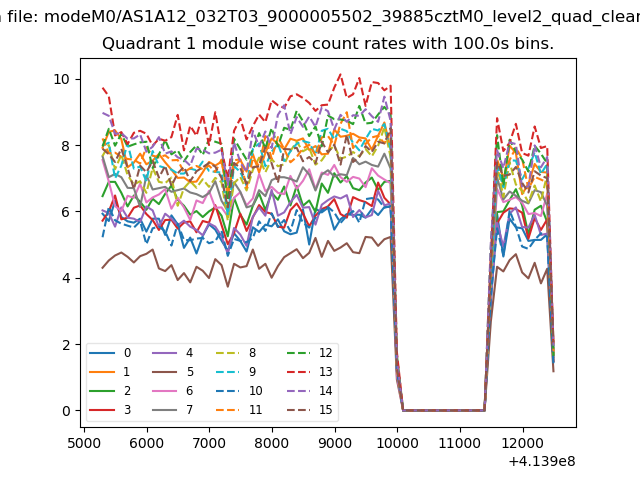
| Module-wise count rates for Quadrant A Data is divided into 100 sec bins |
 |
 |
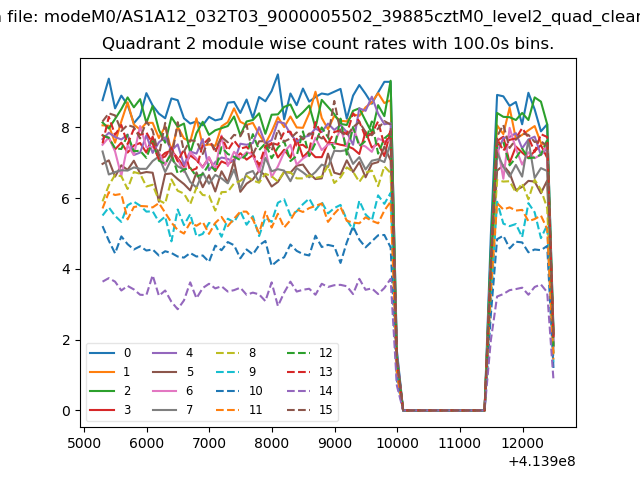
| Module-wise count rates for Quadrant B Data is divided into 100 sec bins |
 |
 |
| Module-wise count rates for Quadrant C Data is divided into 100 sec bins |
 |
 |
| Module-wise count rates for Quadrant D Data is divided into 100 sec bins |
 |
 |
| Parameter | Plot |
|---|---|
| CZT HV Monitor | 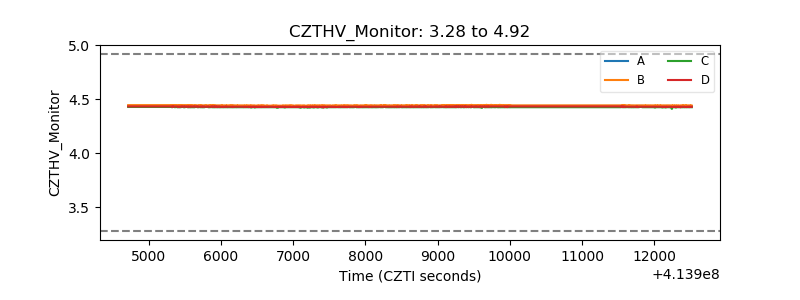 |
| D_VDD | 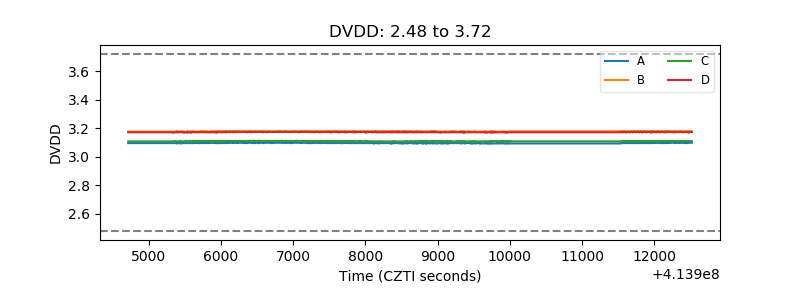 |
| Temperature 1 | 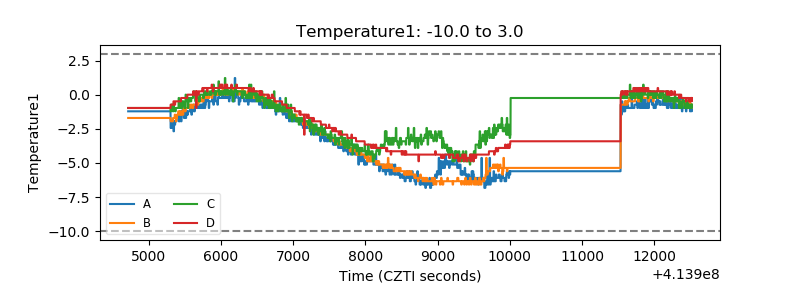 |
| Veto HV Monitor | 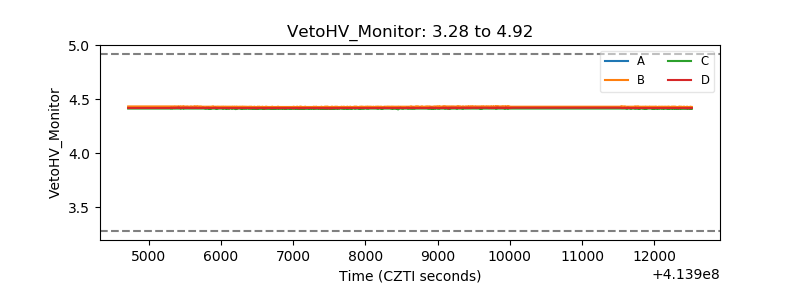 |
| Veto LLD | 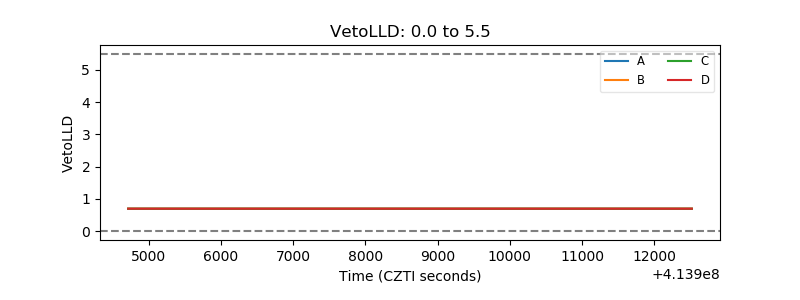 |
| Alpha Counter | 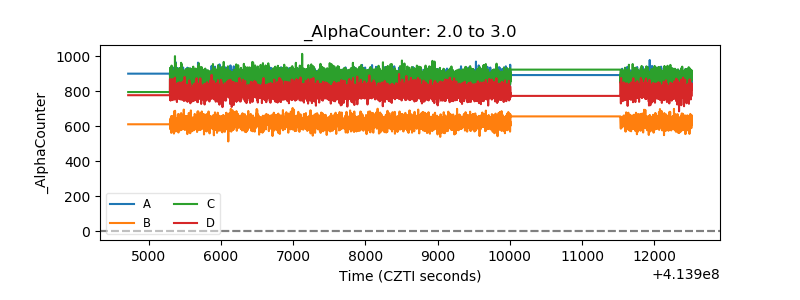 |
| _CPM_Rate |  |
| CZT Counter | 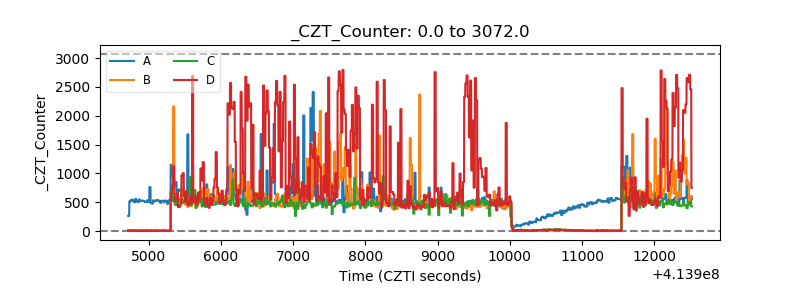 |
| +2.5 Volts monitor | 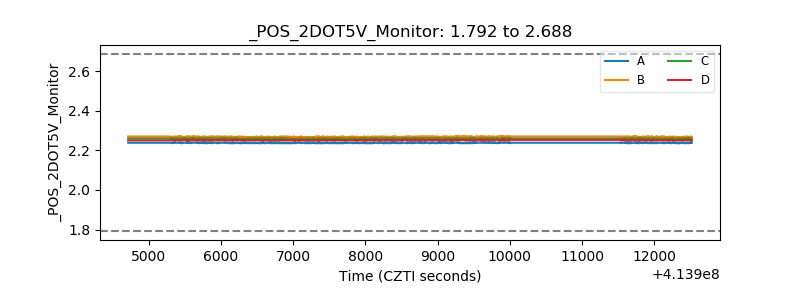 |
| +5 Volts monitor | 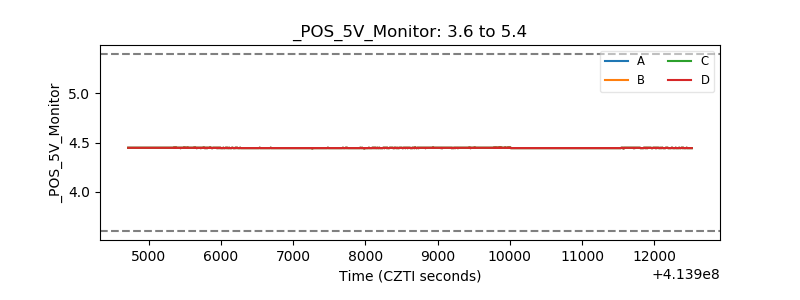 |
| _ROLL_ROT | 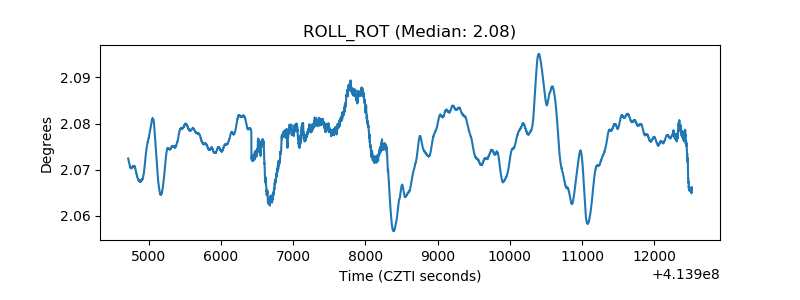 |
| _Roll_DEC | 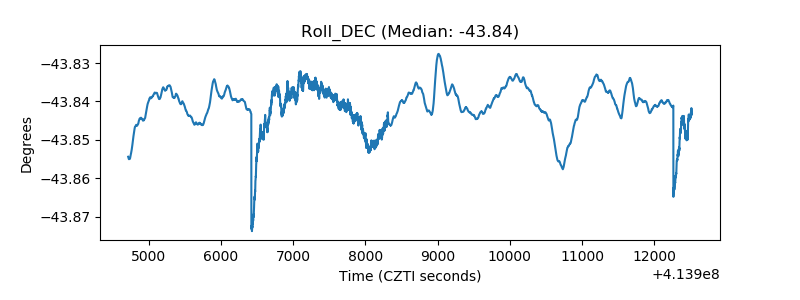 |
| _Roll_RA |  |
| Veto Counter | 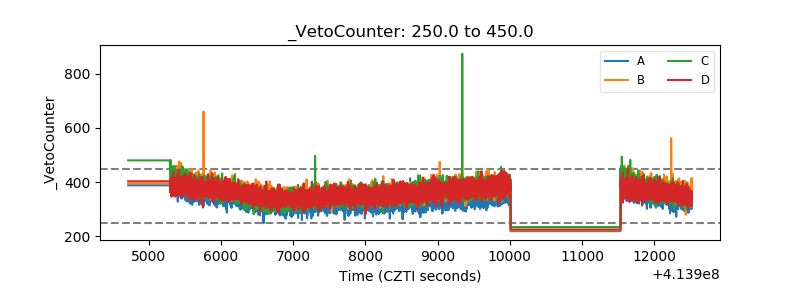 |