| Param | Original file | Final file |
|---|---|---|
| Filename | modeM0/AS1A12_032T03_9000005502_39886cztM0_level2.fits | modeM0/AS1A12_032T03_9000005502_39886cztM0_level2_quad_clean.evt |
| Size (bytes) | 479,687,040 | 92,911,680 |
| Size | 457.5 MB | 88.6 MB |
| Events in quadrant A | 5,316,103 | 559,894 |
| Events in quadrant B | 3,775,657 | 650,176 |
| Events in quadrant C | 3,039,851 | 644,068 |
| Events in quadrant D | 5,160,966 | 542,232 |
| Mode SS | |||
|---|---|---|---|
| Quadrant | BADHDUFLAG | Total packets | Discarded packets |
| A | 0 | 120 | 0 |
| B | 0 | 120 | 0 |
| C | 0 | 120 | 0 |
| D | 0 | 120 | 0 |
| Mode M9 | |||
|---|---|---|---|
| Quadrant | BADHDUFLAG | Total packets | Discarded packets |
| A | 0 | 19 | 0 |
| B | 0 | 19 | 0 |
| C | 0 | 19 | 0 |
| D | 0 | 20 | 0 |
| Mode M0 | |||
|---|---|---|---|
| Quadrant | BADHDUFLAG | Total packets | Discarded packets |
| A | 0 | 19591 | 3 |
| B | 0 | 15255 | 2 |
| C | 0 | 12597 | 2 |
| D | 0 | 19435 | 2 |
| Quadrant | Total seconds | Saturated seconds | Saturation percentage |
|---|---|---|---|
| A | 5966 | 993 | 16.644318% |
| B | 5966 | 170 | 2.849480% |
| C | 5966 | 17 | 0.284948% |
| D | 5966 | 689 | 11.548776% |
Noise dominated data is calculated using 1-second bins in cleaned event files. If a bin has >2000 counts, and if more than 50% of those come from <1% of pixels, then it is considered to be noise-dominated and hence unusable.
| Quadrant | # 1 sec bins | Bins with >0 counts | Bins with >2000 counts | High rate bins dominated by noise | Noise dominated (total time) | Noise dominated (detector-on time) | Marked lightcurve |
|---|---|---|---|---|---|---|---|
| A | 7278 | 5967 | 605 | 605 | 8.31% | 10.14% | 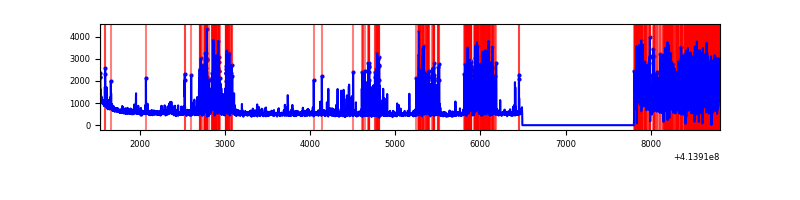 |
| B | 7278 | 5967 | 104 | 104 | 1.43% | 1.74% | 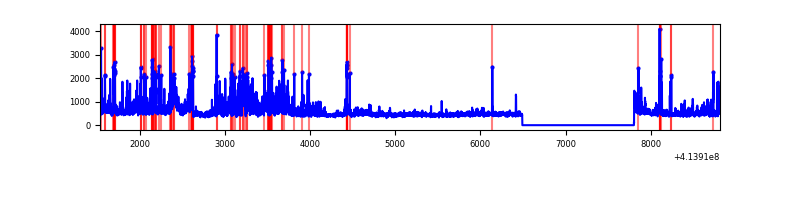 |
| C | 7278 | 5967 | 14 | 14 | 0.19% | 0.23% | 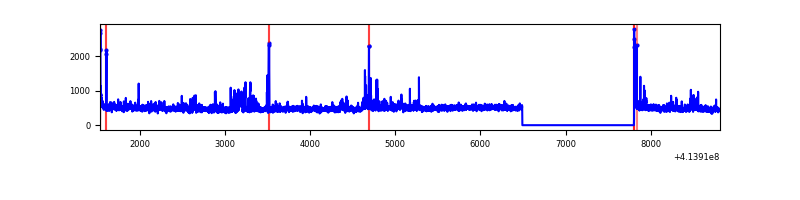 |
| D | 7278 | 5967 | 643 | 643 | 8.83% | 10.78% | 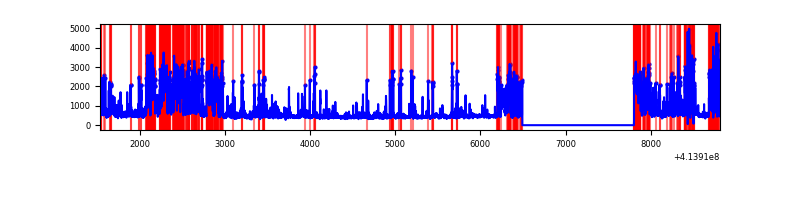 |
Top three noisy pixels from each quadrant. If the there are fewer than three noisy pixels in the level2.evt file, extra rows are filled as -1
| Pixel properties | Quadrant properties | ||||||
|---|---|---|---|---|---|---|---|
| Quadrant | DetID | PixID | Counts | Sigma | Mean | Median | Sigma |
| A | 14 | 250 | 2285563 | 18604.72 | 595 | 582 | 122.8 |
| A | 10 | 83 | 519105 | 4221.91 | 595 | 582 | 122.8 |
| A | 6 | 10 | 100274 | 811.71 | 595 | 582 | 122.8 |
| B | 0 | 221 | 366483 | 2928.26 | 647 | 629 | 124.9 |
| B | 5 | 255 | 266401 | 2127.22 | 647 | 629 | 124.9 |
| B | 0 | 183 | 172462 | 1375.34 | 647 | 629 | 124.9 |
| C | 15 | 214 | 253449 | 1684.23 | 639 | 642 | 150.1 |
| C | 15 | 159 | 67370 | 444.55 | 639 | 642 | 150.1 |
| C | 1 | 16 | 51511 | 338.9 | 639 | 642 | 150.1 |
| D | 12 | 233 | 1377134 | 9062.32 | 612 | 594 | 151.9 |
| D | 12 | 227 | 748361 | 4922.85 | 612 | 594 | 151.9 |
| D | 2 | 250 | 120862 | 791.77 | 612 | 594 | 151.9 |
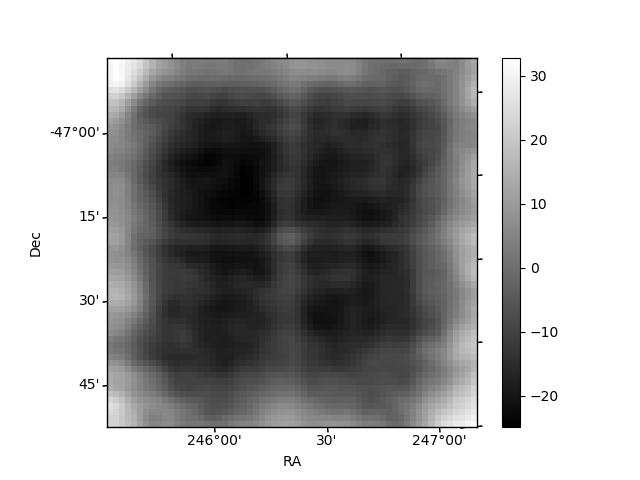
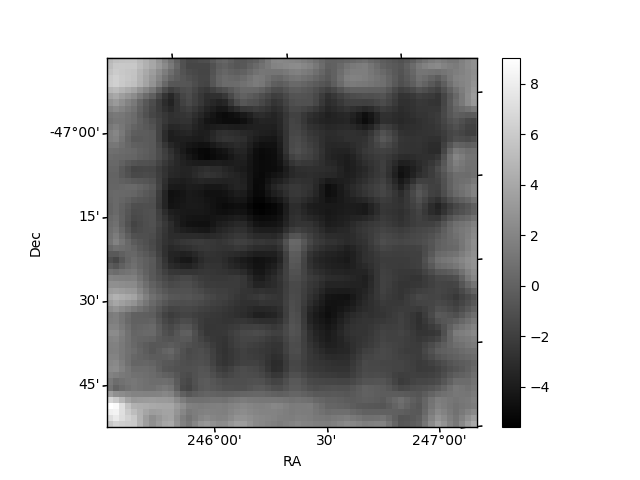
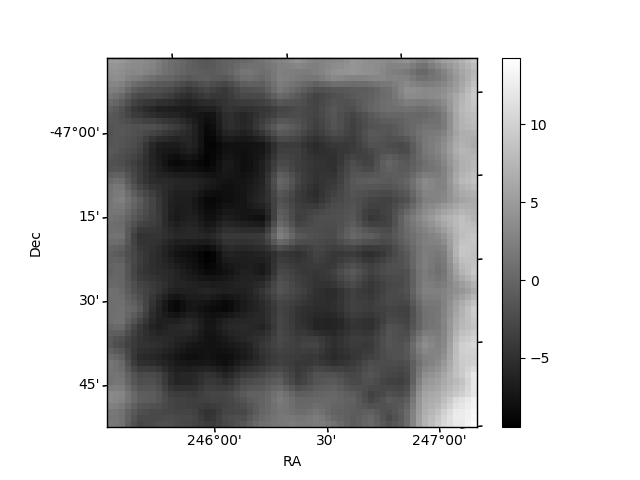
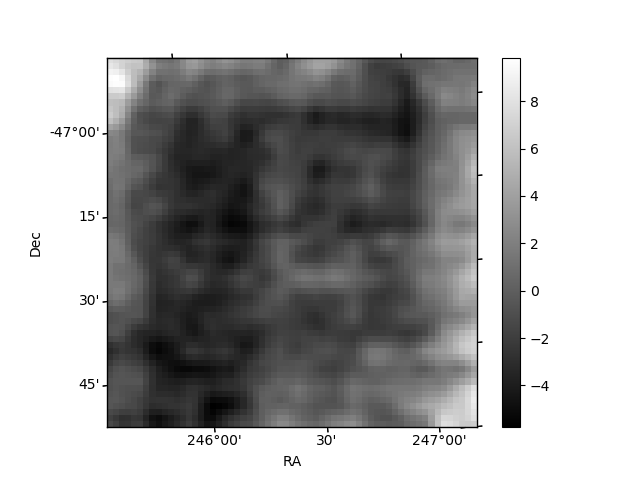
Histogram calculated using DETX and DETY for each event in the final _common_clean file
| Quadrant A | 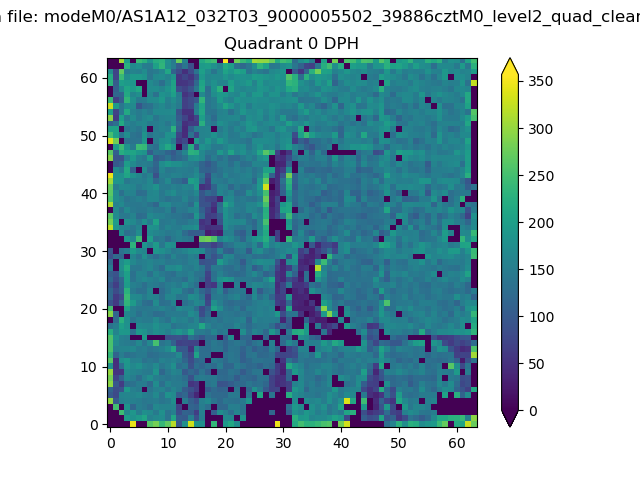 |
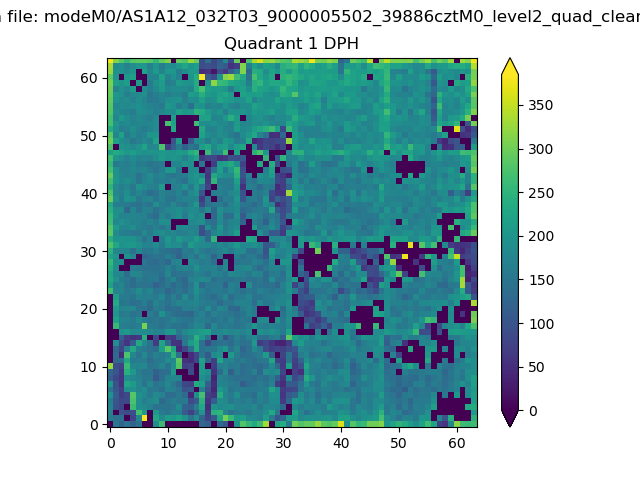 |
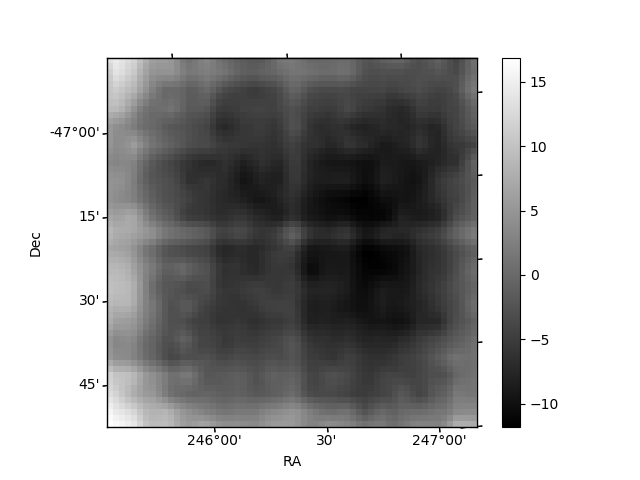
Quadrant B |
|---|---|---|---|
| Quadrant D | 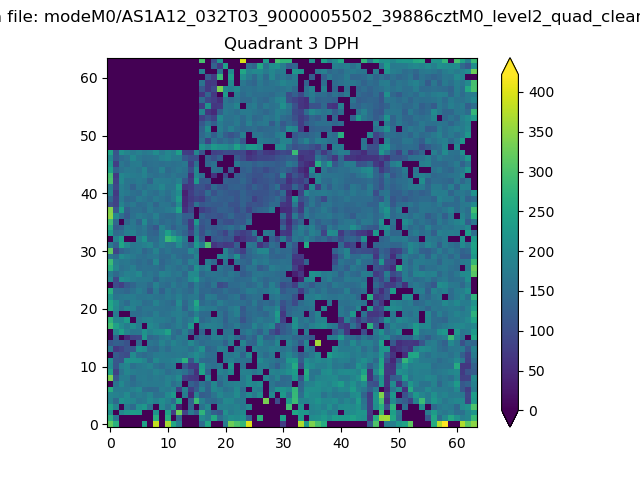 |
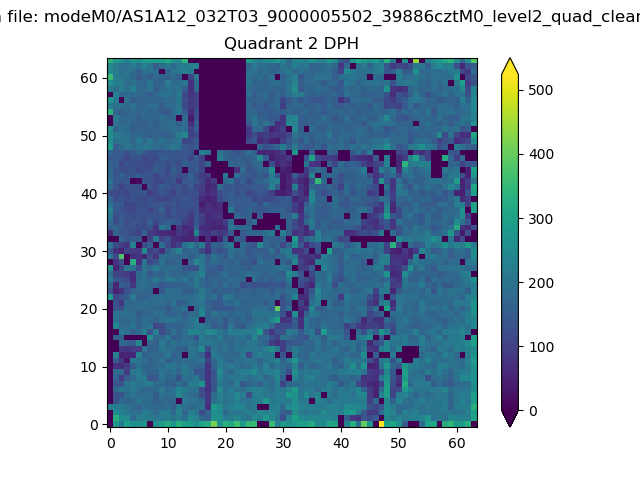 |
Quadrant C |
| Plot type | Count rate plots | Images |
|---|---|---|
| Comparison with Poisson distribution Blue bars denote a histogram of data divided into 1 sec bins. Red curve is a Poisson curve with rate = median count rate of data. |
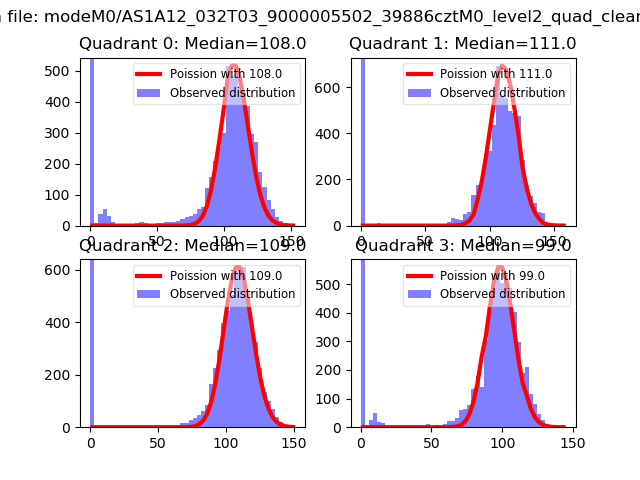 |
 |
| Quadrant-wise count rates Data is divided into 100 sec bins |
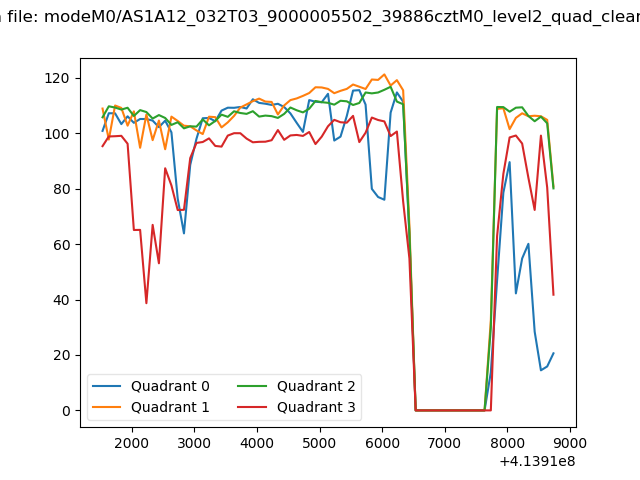 |
|
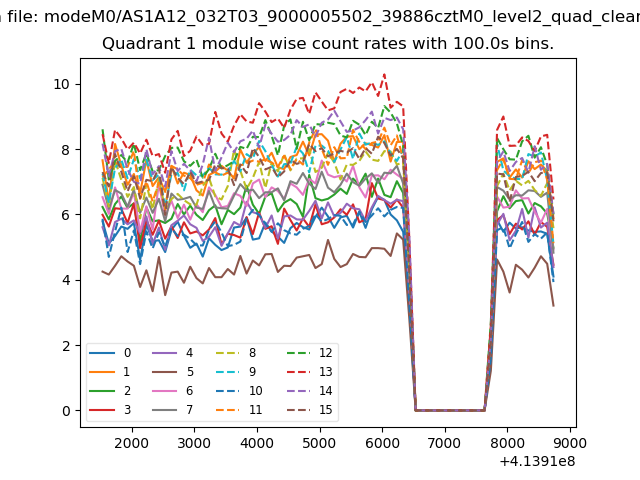
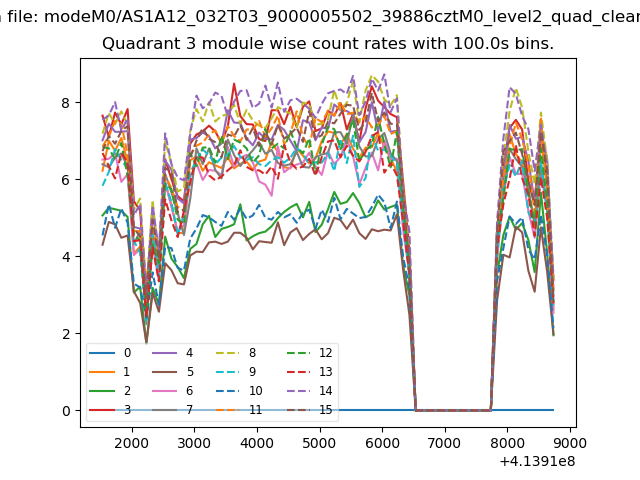
| Module-wise count rates for Quadrant A Data is divided into 100 sec bins |
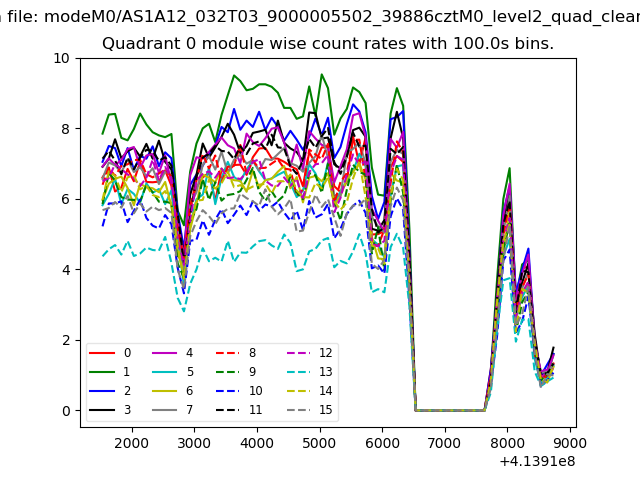 |
 |
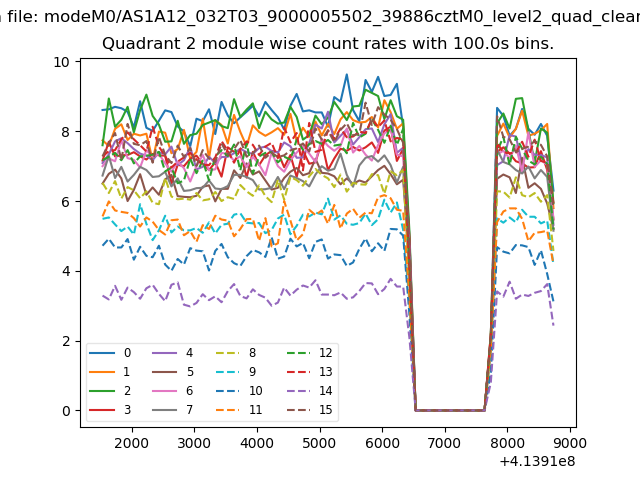
| Module-wise count rates for Quadrant B Data is divided into 100 sec bins |
 |
 |
| Module-wise count rates for Quadrant C Data is divided into 100 sec bins |
 |
 |
| Module-wise count rates for Quadrant D Data is divided into 100 sec bins |
 |
 |
| Parameter | Plot |
|---|---|
| CZT HV Monitor | 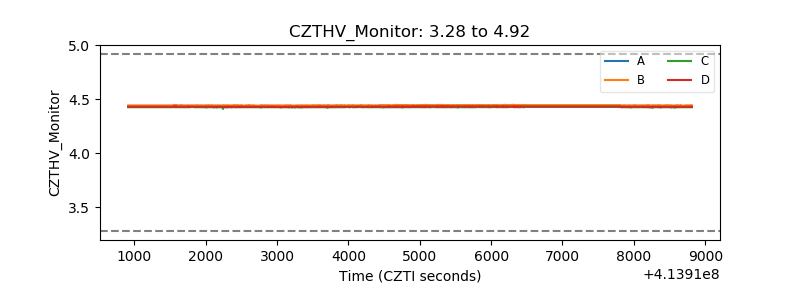 |
| D_VDD | 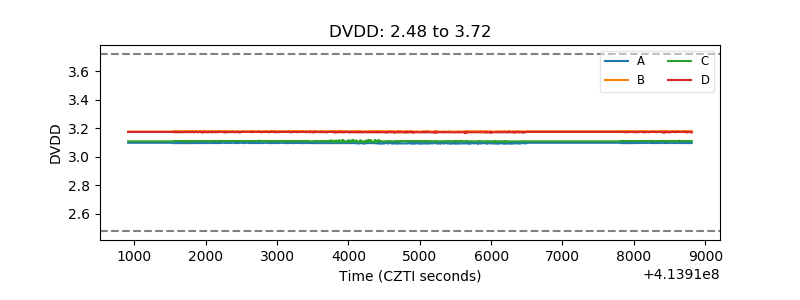 |
| Temperature 1 | 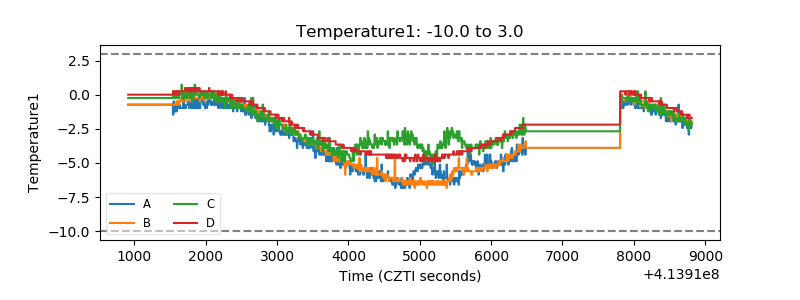 |
| Veto HV Monitor | 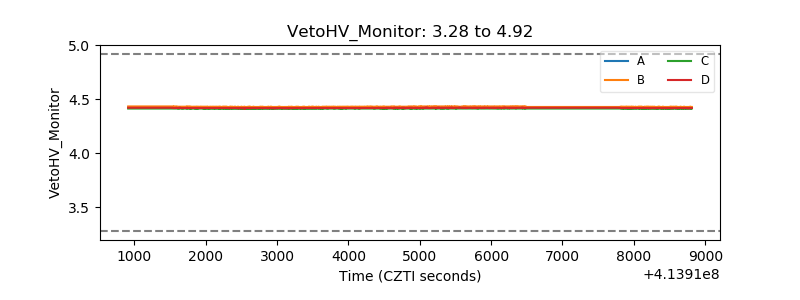 |
| Veto LLD | 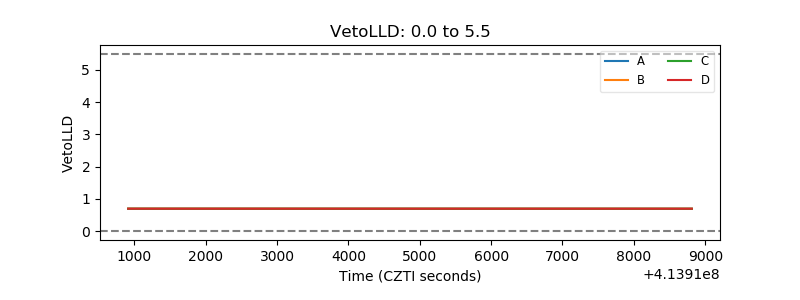 |
| Alpha Counter | 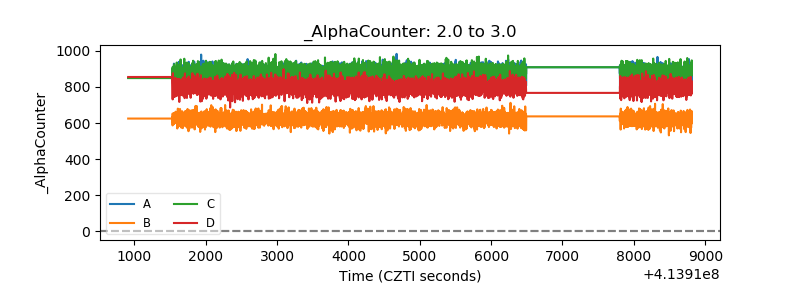 |
| _CPM_Rate | 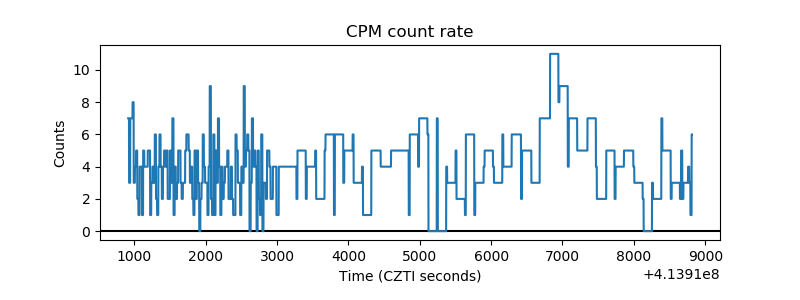 |
| CZT Counter | 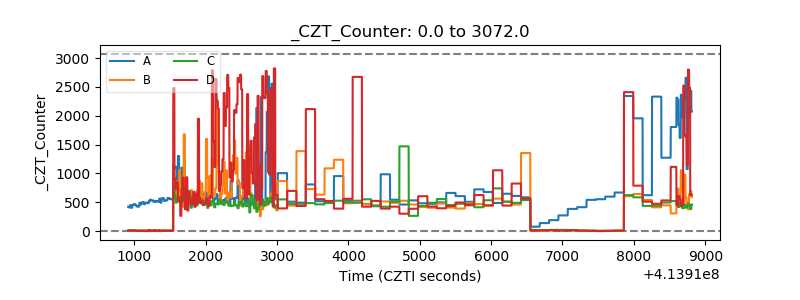 |
| +2.5 Volts monitor |  |
| +5 Volts monitor | 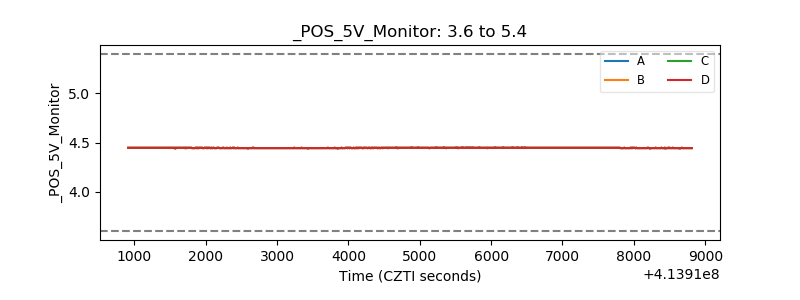 |
| _ROLL_ROT | 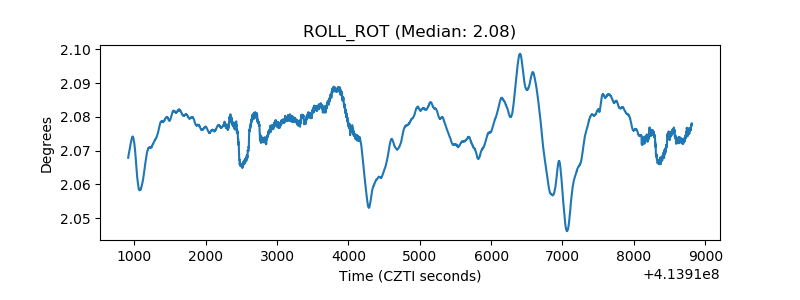 |
| _Roll_DEC | 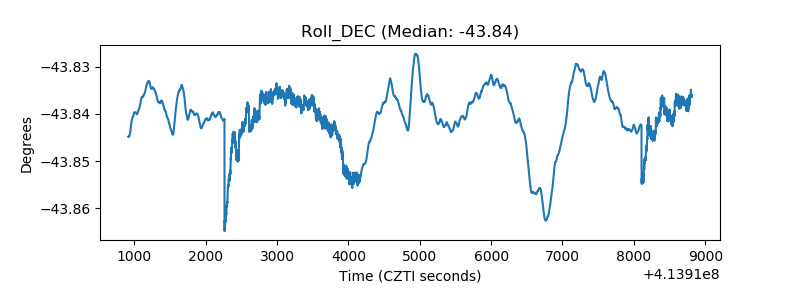 |
| _Roll_RA | 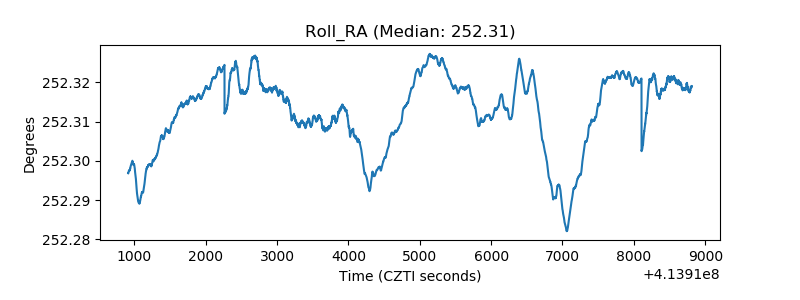 |
| Veto Counter | 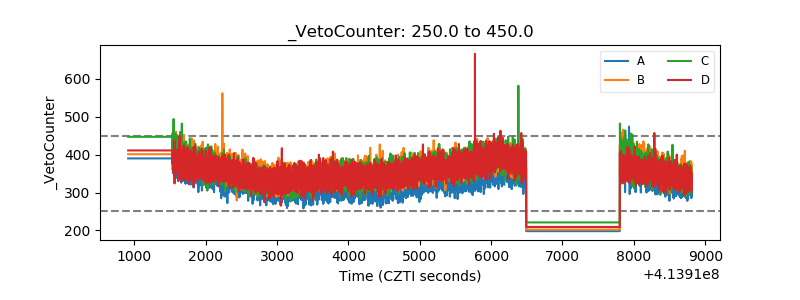 |