| Param | Original file | Final file |
|---|---|---|
| Filename | modeM0/AS1A12_032T03_9000005502_39887cztM0_level2.fits | modeM0/AS1A12_032T03_9000005502_39887cztM0_level2_quad_clean.evt |
| Size (bytes) | 434,134,080 | 92,851,200 |
| Size | 414.0 MB | 88.5 MB |
| Events in quadrant A | 4,599,358 | 560,580 |
| Events in quadrant B | 3,455,431 | 647,770 |
| Events in quadrant C | 2,907,351 | 635,242 |
| Events in quadrant D | 4,648,773 | 554,997 |
| Mode SS | |||
|---|---|---|---|
| Quadrant | BADHDUFLAG | Total packets | Discarded packets |
| A | 0 | 120 | 0 |
| B | 0 | 120 | 0 |
| C | 0 | 120 | 0 |
| D | 0 | 120 | 0 |
| Mode M9 | |||
|---|---|---|---|
| Quadrant | BADHDUFLAG | Total packets | Discarded packets |
| A | 0 | 21 | 0 |
| B | 0 | 21 | 0 |
| C | 0 | 21 | 0 |
| D | 0 | 22 | 0 |
| Mode M0 | |||
|---|---|---|---|
| Quadrant | BADHDUFLAG | Total packets | Discarded packets |
| A | 0 | 17248 | 3 |
| B | 0 | 14276 | 2 |
| C | 0 | 12253 | 2 |
| D | 0 | 17739 | 2 |
| Quadrant | Total seconds | Saturated seconds | Saturation percentage |
|---|---|---|---|
| A | 5902 | 871 | 14.757709% |
| B | 5902 | 145 | 2.456794% |
| C | 5902 | 12 | 0.203321% |
| D | 5902 | 458 | 7.760081% |
Noise dominated data is calculated using 1-second bins in cleaned event files. If a bin has >2000 counts, and if more than 50% of those come from <1% of pixels, then it is considered to be noise-dominated and hence unusable.
| Quadrant | # 1 sec bins | Bins with >0 counts | Bins with >2000 counts | High rate bins dominated by noise | Noise dominated (total time) | Noise dominated (detector-on time) | Marked lightcurve |
|---|---|---|---|---|---|---|---|
| A | 7185 | 5903 | 432 | 432 | 6.01% | 7.32% | 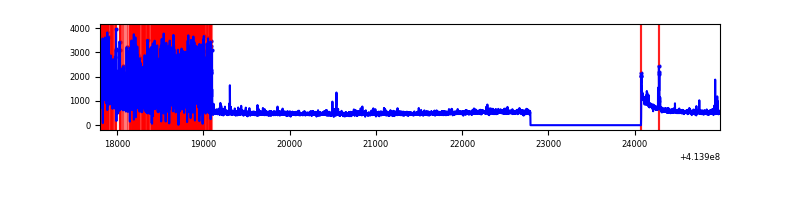 |
| B | 7185 | 5903 | 57 | 57 | 0.79% | 0.97% | 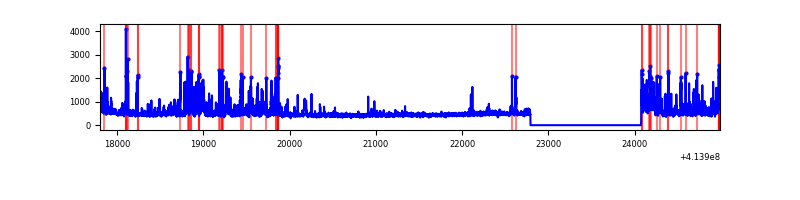 |
| C | 7185 | 5903 | 8 | 8 | 0.11% | 0.14% | 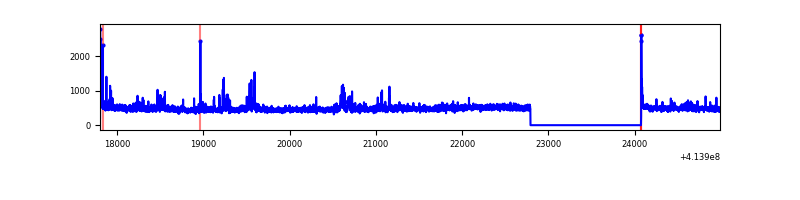 |
| D | 7185 | 5903 | 437 | 437 | 6.08% | 7.40% | 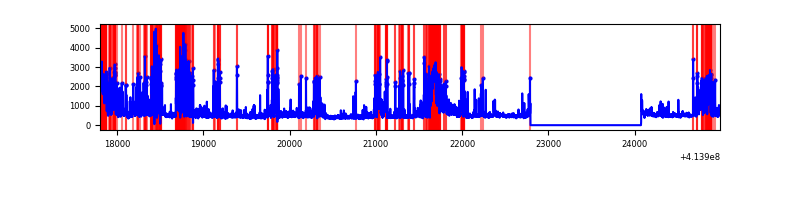 |
Top three noisy pixels from each quadrant. If the there are fewer than three noisy pixels in the level2.evt file, extra rows are filled as -1
| Pixel properties | Quadrant properties | ||||||
|---|---|---|---|---|---|---|---|
| Quadrant | DetID | PixID | Counts | Sigma | Mean | Median | Sigma |
| A | 14 | 250 | 1680705 | 13638.9 | 593 | 579 | 123.2 |
| A | 10 | 83 | 510587 | 4140.14 | 593 | 579 | 123.2 |
| A | 6 | 10 | 58563 | 470.7 | 593 | 579 | 123.2 |
| B | 0 | 183 | 279857 | 2241.77 | 643 | 625 | 124.6 |
| B | 0 | 221 | 160258 | 1281.59 | 643 | 625 | 124.6 |
| B | 4 | 141 | 121564 | 970.94 | 643 | 625 | 124.6 |
| C | 15 | 214 | 247900 | 1654.22 | 635 | 640 | 149.5 |
| C | 14 | 254 | 50745 | 335.21 | 635 | 640 | 149.5 |
| C | 15 | 159 | 33705 | 221.21 | 635 | 640 | 149.5 |
| D | 12 | 227 | 1344761 | 8817.94 | 614 | 596 | 152.4 |
| D | 12 | 233 | 262315 | 1716.92 | 614 | 596 | 152.4 |
| D | 1 | 52 | 146033 | 954.09 | 614 | 596 | 152.4 |
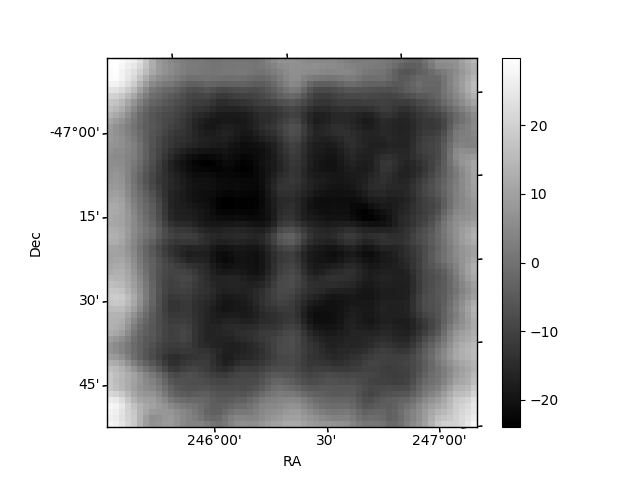
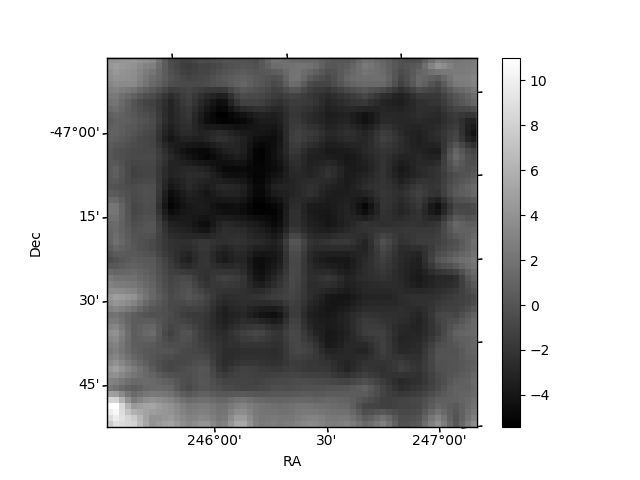
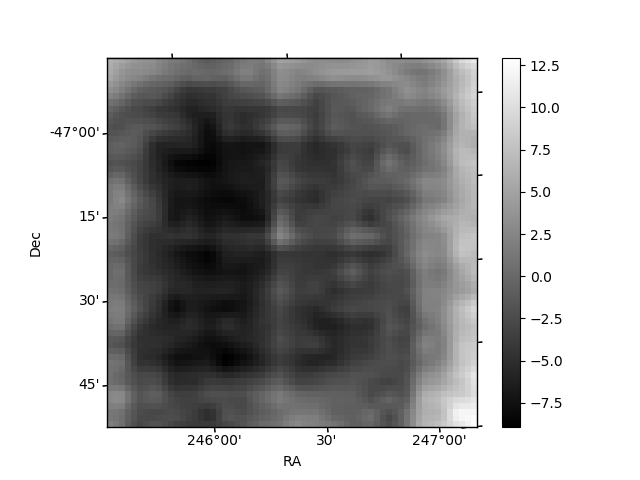
Histogram calculated using DETX and DETY for each event in the final _common_clean file
| Quadrant A | 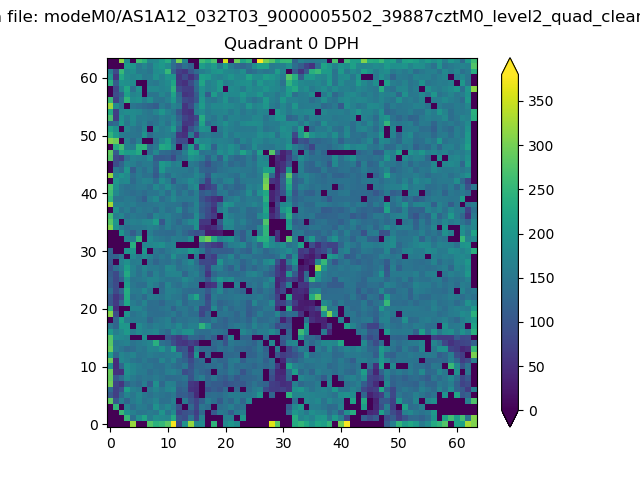 |
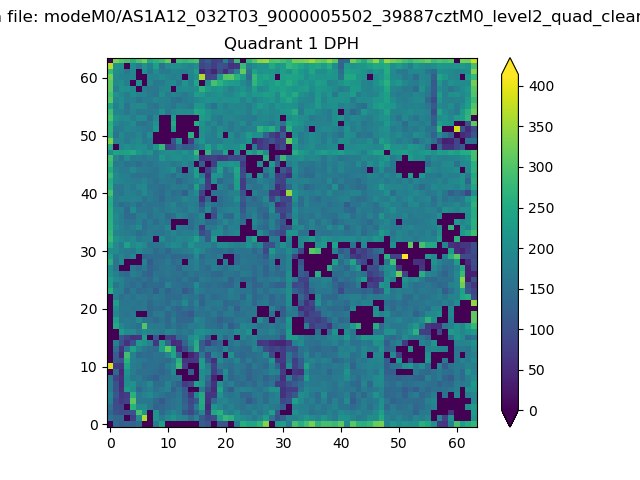 |
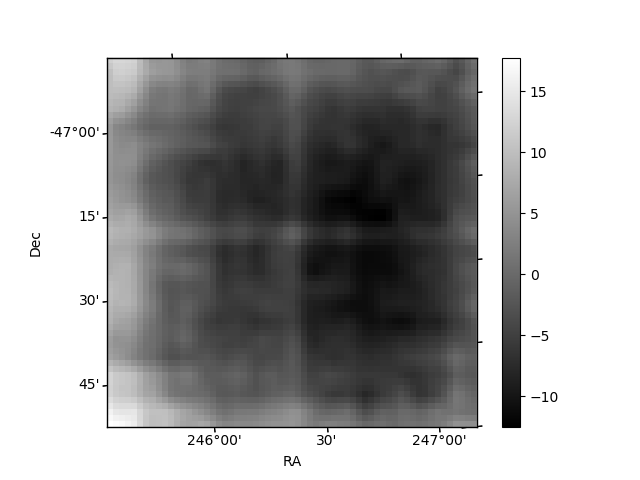
Quadrant B |
|---|---|---|---|
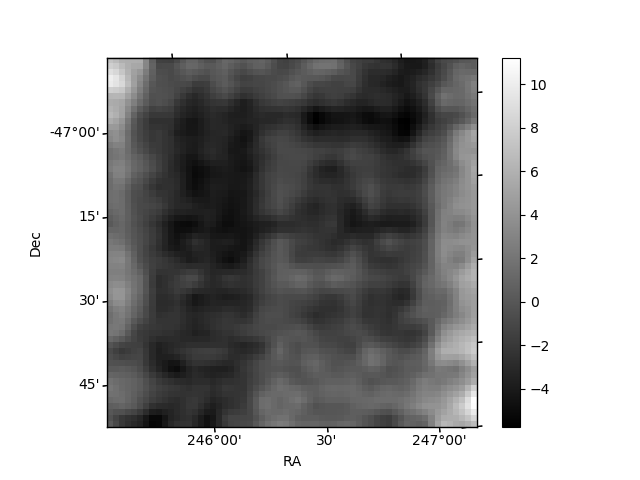
| Quadrant D | 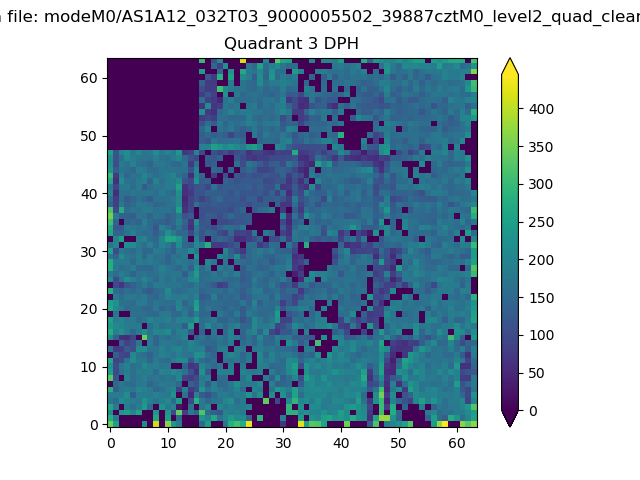 |
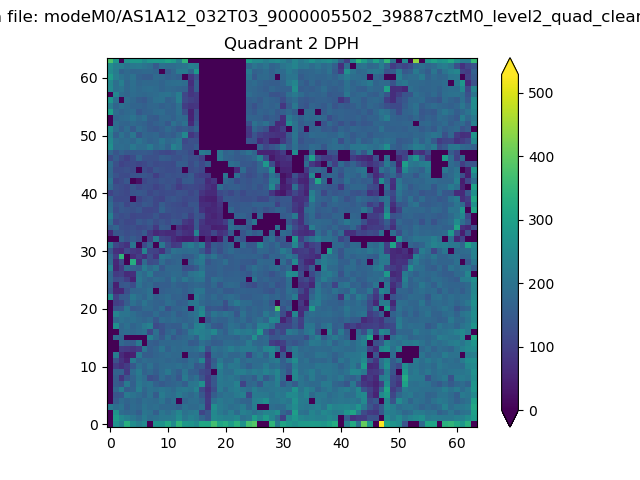 |
Quadrant C |
| Plot type | Count rate plots | Images |
|---|---|---|
| Comparison with Poisson distribution Blue bars denote a histogram of data divided into 1 sec bins. Red curve is a Poisson curve with rate = median count rate of data. |
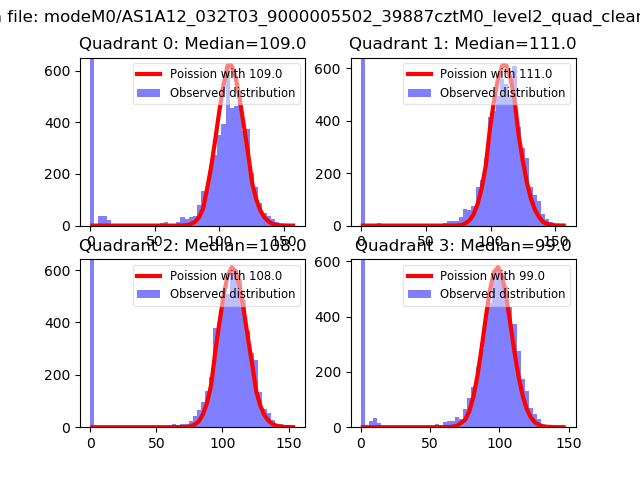 |
 |
| Quadrant-wise count rates Data is divided into 100 sec bins |
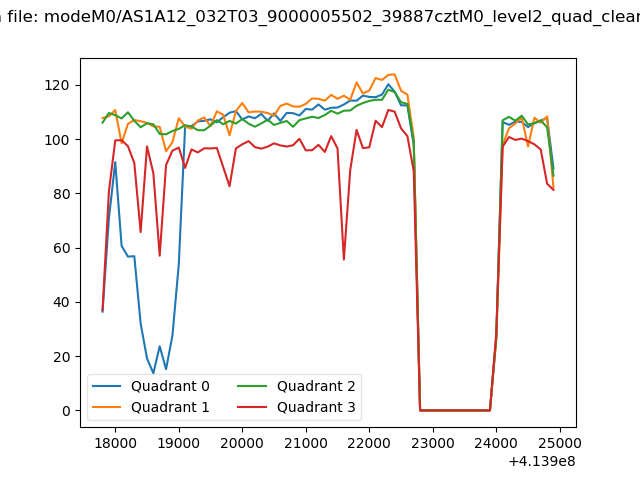 |
|
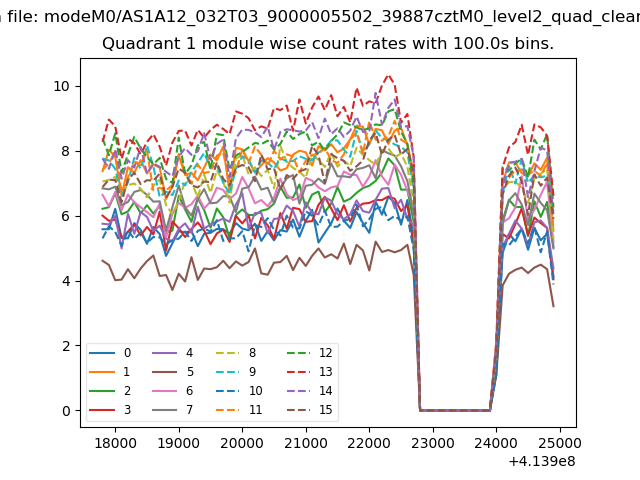
| Module-wise count rates for Quadrant A Data is divided into 100 sec bins |
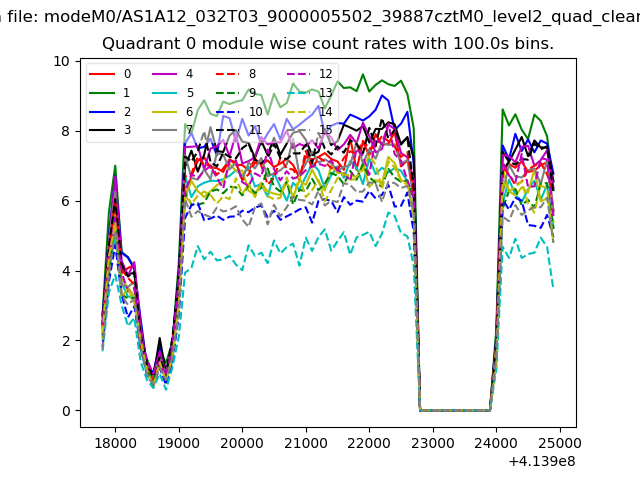 |
 |
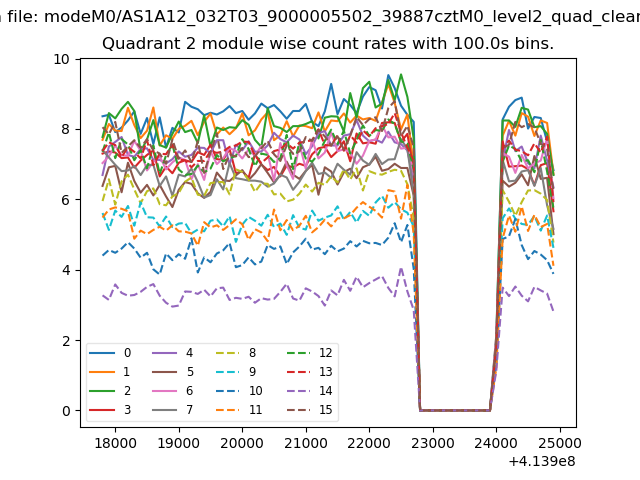
| Module-wise count rates for Quadrant B Data is divided into 100 sec bins |
 |
 |
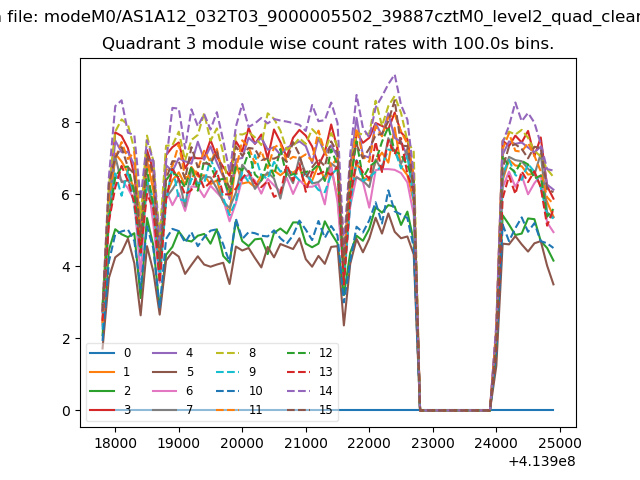
| Module-wise count rates for Quadrant C Data is divided into 100 sec bins |
 |
 |
| Module-wise count rates for Quadrant D Data is divided into 100 sec bins |
 |
 |
| Parameter | Plot |
|---|---|
| CZT HV Monitor | 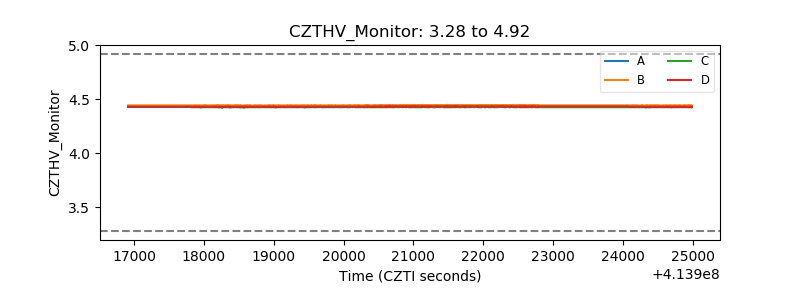 |
| D_VDD | 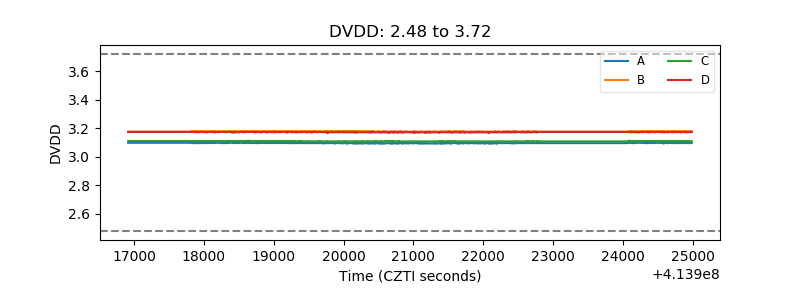 |
| Temperature 1 | 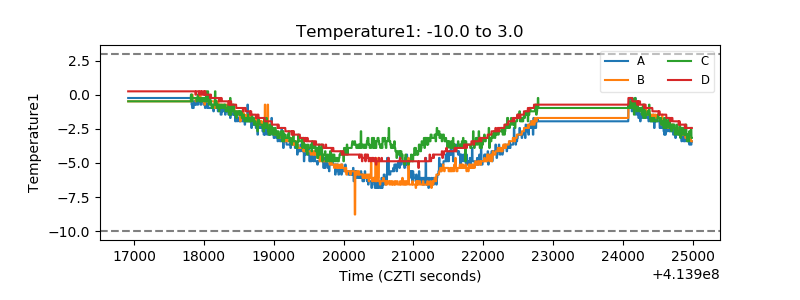 |
| Veto HV Monitor | 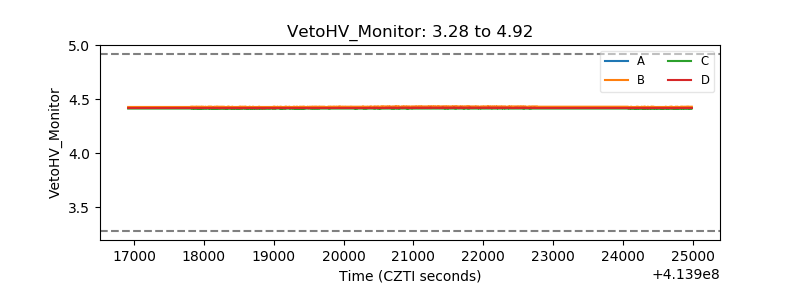 |
| Veto LLD | 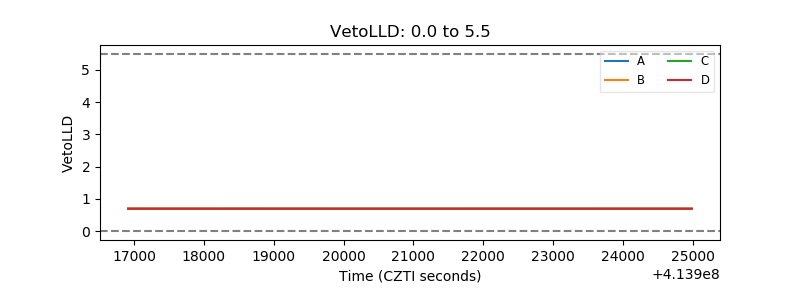 |
| Alpha Counter | 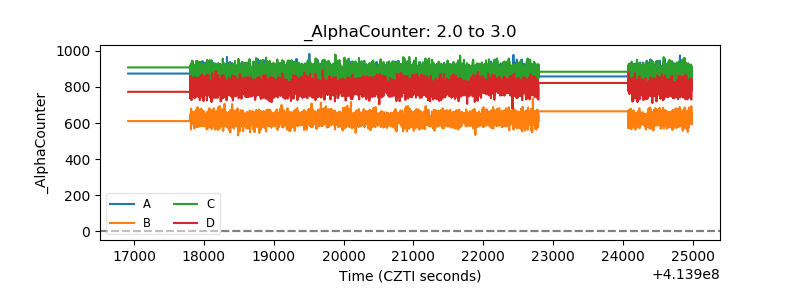 |
| _CPM_Rate | 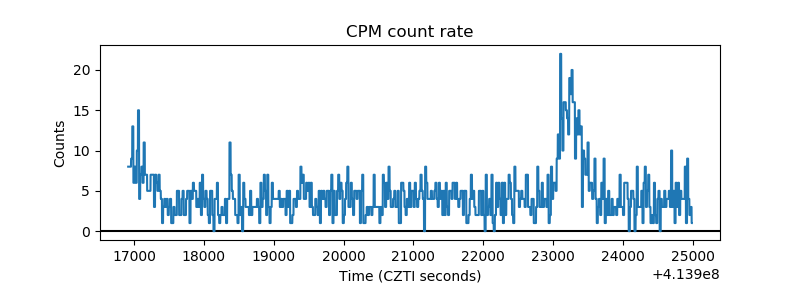 |
| CZT Counter | 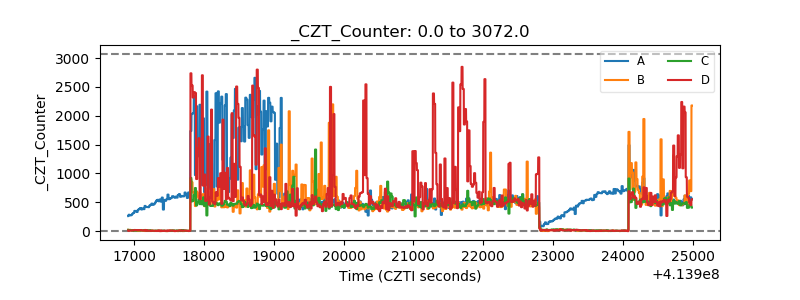 |
| +2.5 Volts monitor | 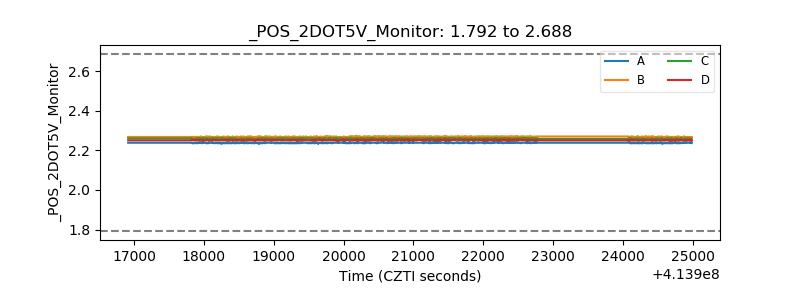 |
| +5 Volts monitor | 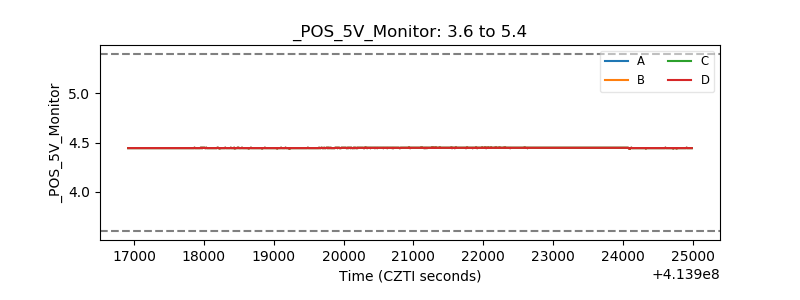 |
| _ROLL_ROT | 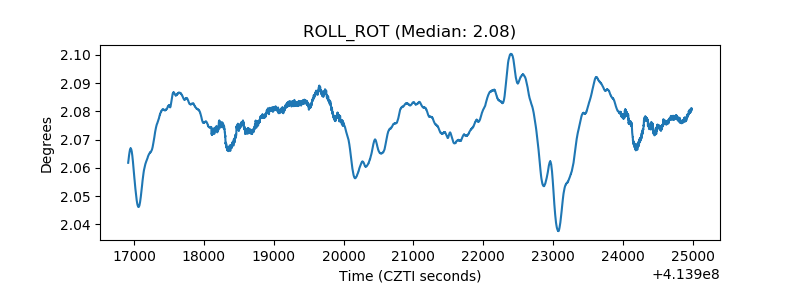 |
| _Roll_DEC | 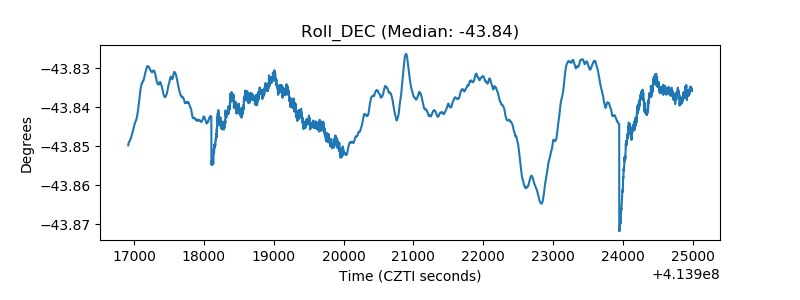 |
| _Roll_RA | 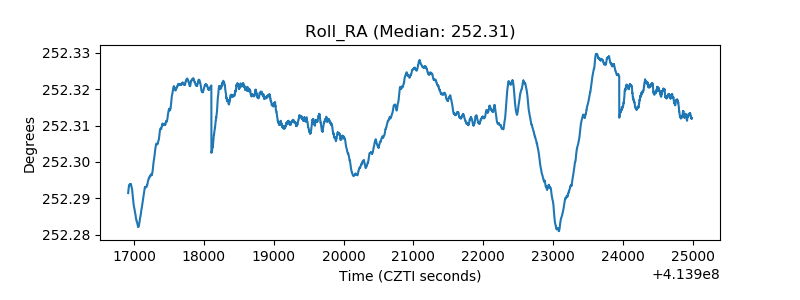 |
| Veto Counter | 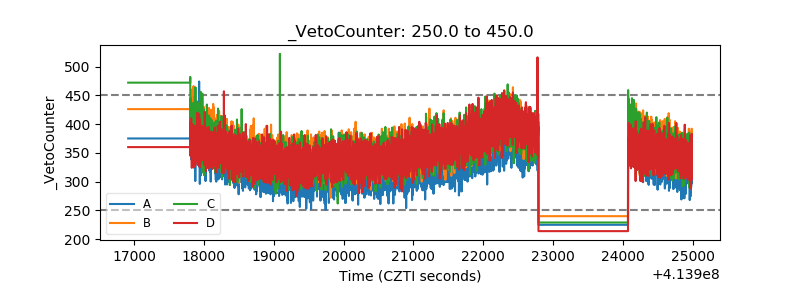 |