| Param | Original file | Final file |
|---|---|---|
| Filename | modeM0/AS1A12_032T03_9000005502_39890cztM0_level2.fits | modeM0/AS1A12_032T03_9000005502_39890cztM0_level2_quad_clean.evt |
| Size (bytes) | 186,877,440 | 41,382,720 |
| Size | 178.2 MB | 39.5 MB |
| Events in quadrant A | 1,393,847 | 283,930 |
| Events in quadrant B | 1,920,060 | 270,763 |
| Events in quadrant C | 1,230,333 | 278,521 |
| Events in quadrant D | 2,166,750 | 231,269 |
| Mode SS | |||
|---|---|---|---|
| Quadrant | BADHDUFLAG | Total packets | Discarded packets |
| A | 0 | 54 | 0 |
| B | 0 | 55 | 2 |
| C | 0 | 56 | 0 |
| D | 0 | 56 | 0 |
| Mode M9 | |||
|---|---|---|---|
| Quadrant | BADHDUFLAG | Total packets | Discarded packets |
| A | 0 | 4 | 0 |
| B | 0 | 4 | 0 |
| C | 0 | 4 | 0 |
| D | 0 | 5 | 0 |
| Mode M0 | |||
|---|---|---|---|
| Quadrant | BADHDUFLAG | Total packets | Discarded packets |
| A | 0 | 6046 | 206 |
| B | 0 | 7885 | 326 |
| C | 0 | 5582 | 171 |
| D | 0 | 8796 | 550 |
| Quadrant | Total seconds | Saturated seconds | Saturation percentage |
|---|---|---|---|
| A | 2635 | 6 | 0.227704% |
| B | 2626 | 193 | 7.349581% |
| C | 2648 | 7 | 0.264350% |
| D | 2588 | 258 | 9.969088% |
Noise dominated data is calculated using 1-second bins in cleaned event files. If a bin has >2000 counts, and if more than 50% of those come from <1% of pixels, then it is considered to be noise-dominated and hence unusable.
| Quadrant | # 1 sec bins | Bins with >0 counts | Bins with >2000 counts | High rate bins dominated by noise | Noise dominated (total time) | Noise dominated (detector-on time) | Marked lightcurve |
|---|---|---|---|---|---|---|---|
| A | 2771 | 2728 | 3 | 3 | 0.11% | 0.11% | 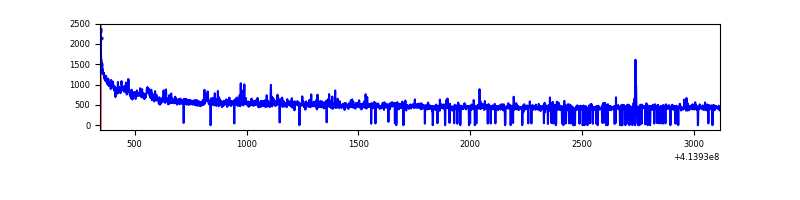 |
| B | 2771 | 2729 | 153 | 153 | 5.52% | 5.61% | 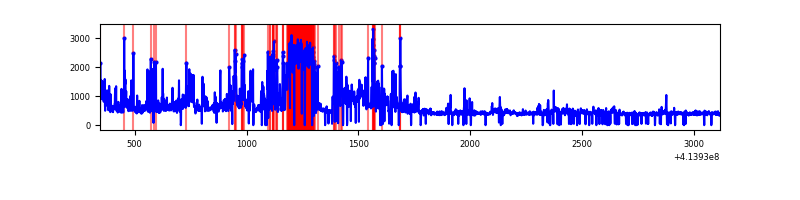 |
| C | 2771 | 2733 | 6 | 6 | 0.22% | 0.22% | 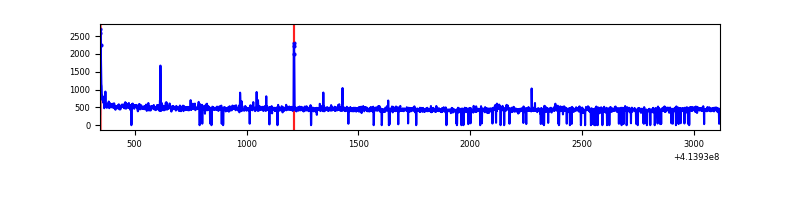 |
| D | 2771 | 2717 | 247 | 247 | 8.91% | 9.09% | 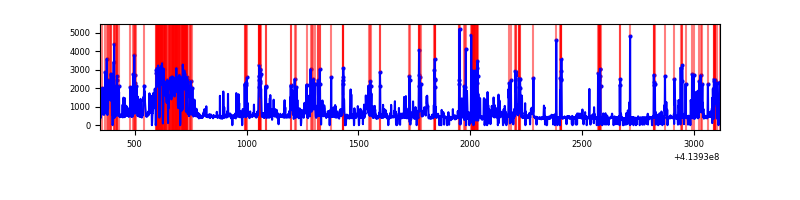 |
Top three noisy pixels from each quadrant. If the there are fewer than three noisy pixels in the level2.evt file, extra rows are filled as -1
| Pixel properties | Quadrant properties | ||||||
|---|---|---|---|---|---|---|---|
| Quadrant | DetID | PixID | Counts | Sigma | Mean | Median | Sigma |
| A | 10 | 83 | 258262 | 4433.67 | 276 | 271 | 58.2 |
| A | 15 | 223 | 18972 | 321.38 | 276 | 271 | 58.2 |
| A | 6 | 10 | 17939 | 303.63 | 276 | 271 | 58.2 |
| B | 5 | 255 | 321835 | 5944.23 | 269 | 262 | 54.1 |
| B | 0 | 183 | 259893 | 4799.24 | 269 | 262 | 54.1 |
| B | 0 | 221 | 140381 | 2590.08 | 269 | 262 | 54.1 |
| C | 15 | 214 | 110996 | 1693.71 | 272 | 275 | 65.4 |
| C | 0 | 10 | 12093 | 180.78 | 272 | 275 | 65.4 |
| C | 1 | 16 | 11575 | 172.86 | 272 | 275 | 65.4 |
| D | 12 | 227 | 729824 | 11445.86 | 251 | 244 | 63.7 |
| D | 9 | 19 | 118399 | 1853.65 | 251 | 244 | 63.7 |
| D | 13 | 249 | 72683 | 1136.44 | 251 | 244 | 63.7 |
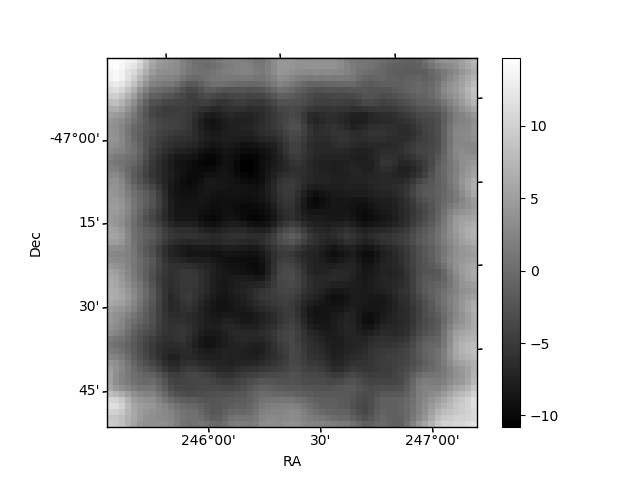
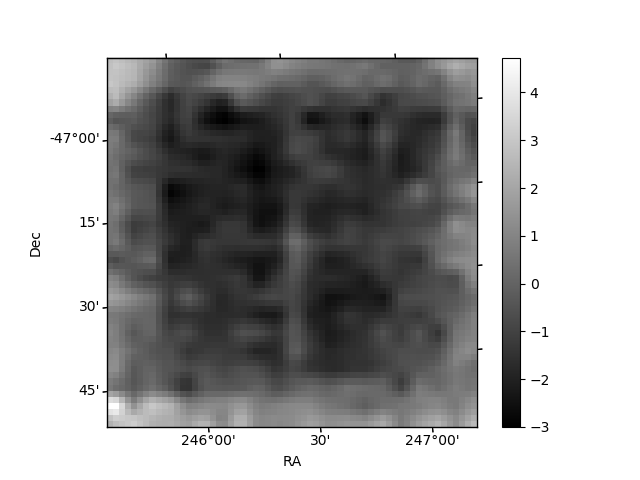
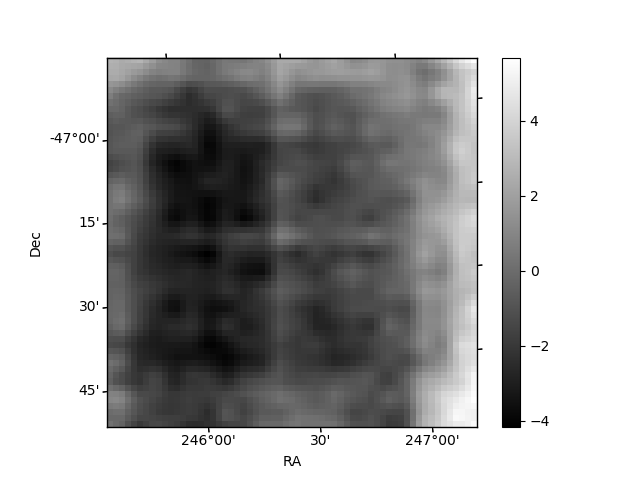
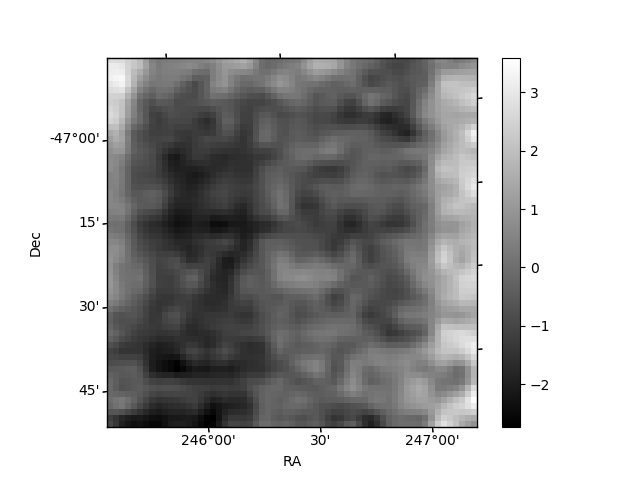
Histogram calculated using DETX and DETY for each event in the final _common_clean file
| Quadrant A | 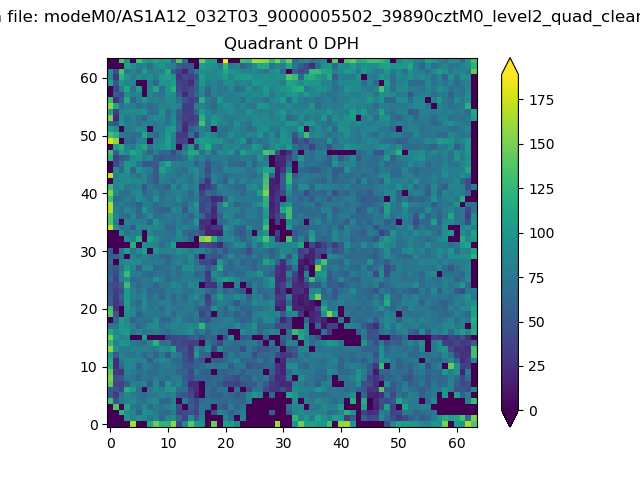 |
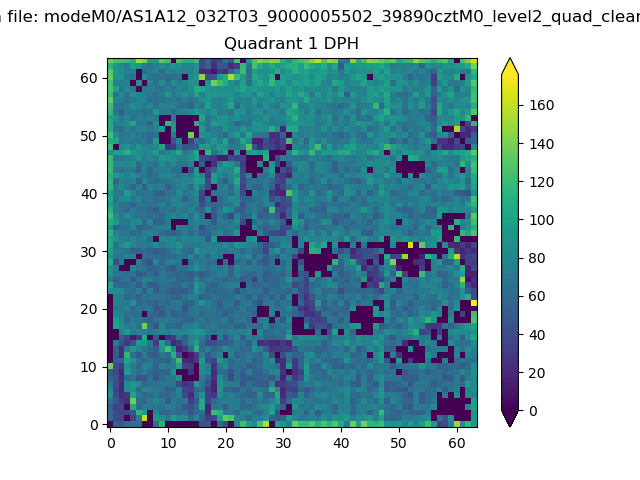 |
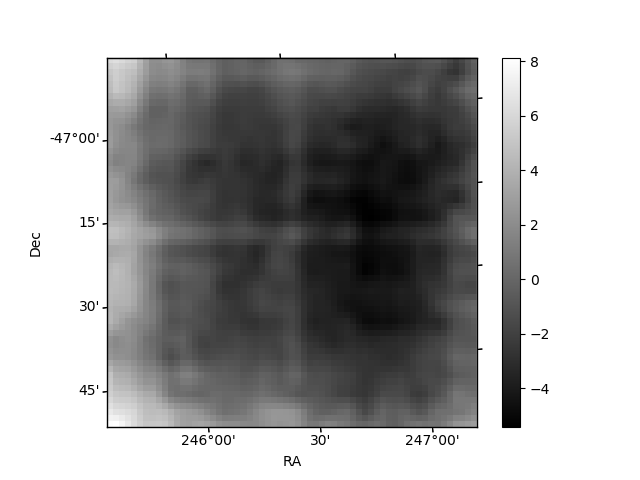
Quadrant B |
|---|---|---|---|
| Quadrant D | 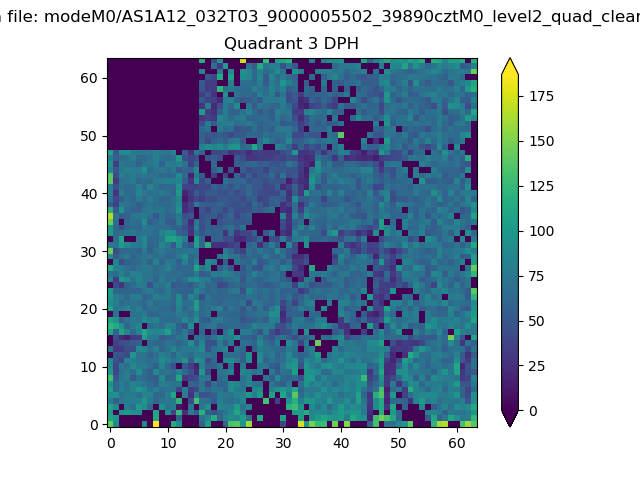 |
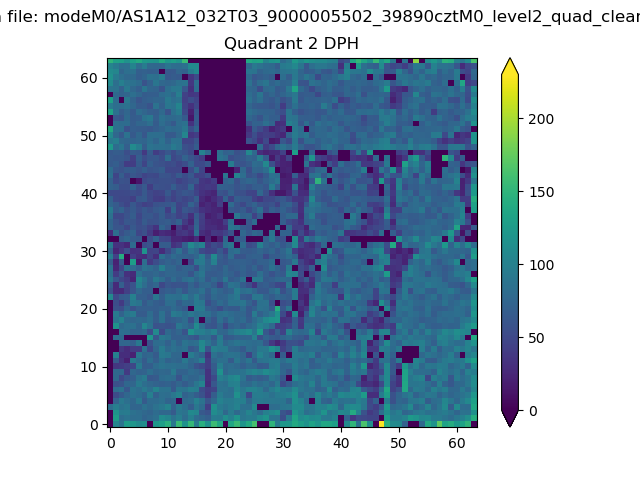 |
Quadrant C |
| Plot type | Count rate plots | Images |
|---|---|---|
| Comparison with Poisson distribution Blue bars denote a histogram of data divided into 1 sec bins. Red curve is a Poisson curve with rate = median count rate of data. |
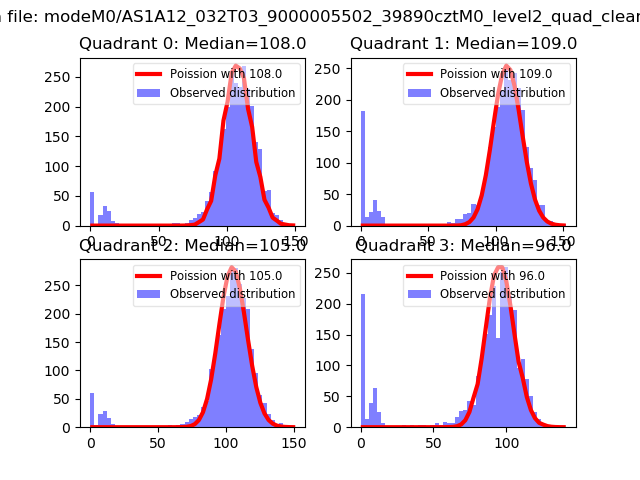 |
 |
| Quadrant-wise count rates Data is divided into 100 sec bins |
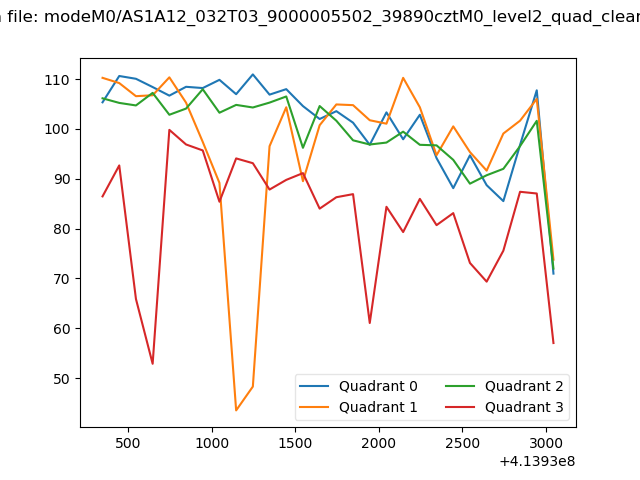 |
|
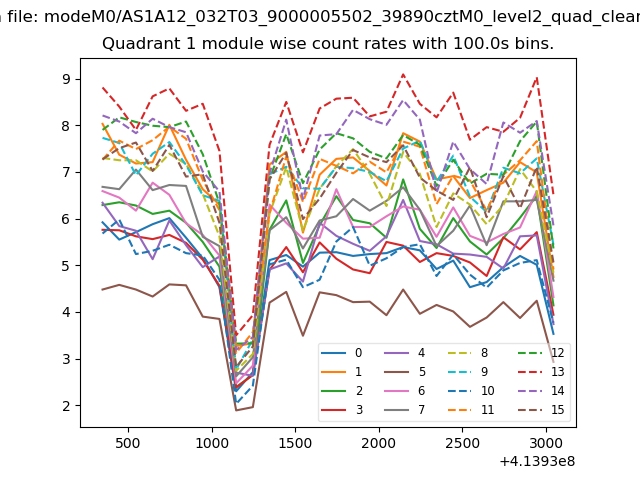
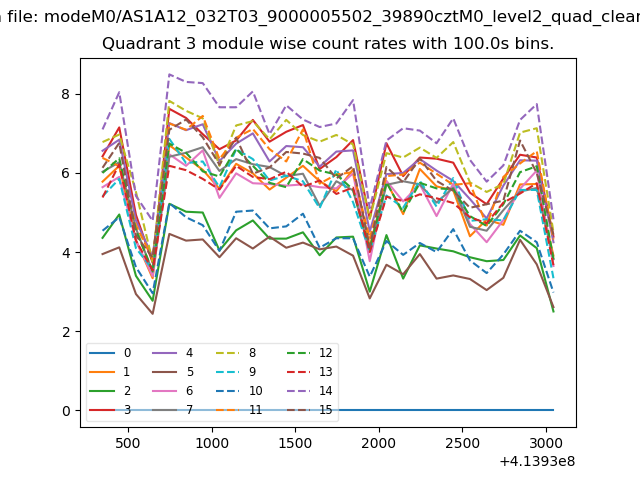
| Module-wise count rates for Quadrant A Data is divided into 100 sec bins |
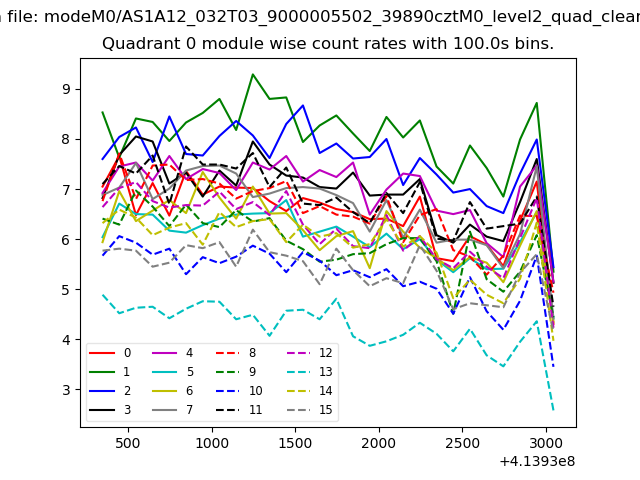 |
 |
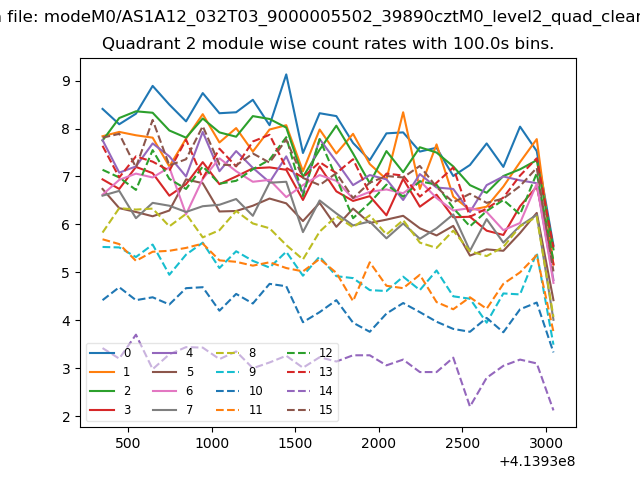
| Module-wise count rates for Quadrant B Data is divided into 100 sec bins |
 |
 |
| Module-wise count rates for Quadrant C Data is divided into 100 sec bins |
 |
 |
| Module-wise count rates for Quadrant D Data is divided into 100 sec bins |
 |
 |
| Parameter | Plot |
|---|---|
| CZT HV Monitor | 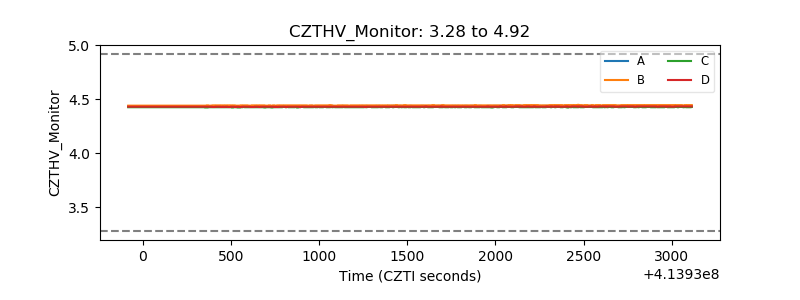 |
| D_VDD | 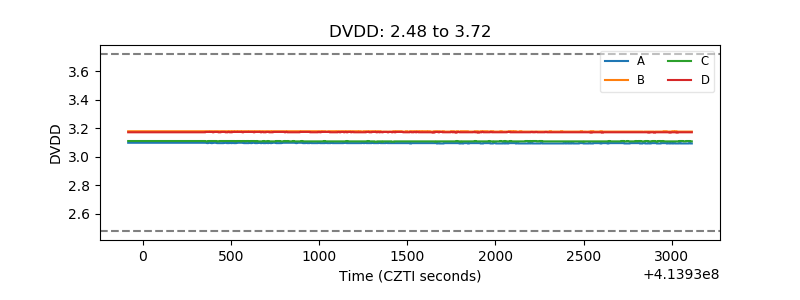 |
| Temperature 1 |  |
| Veto HV Monitor | 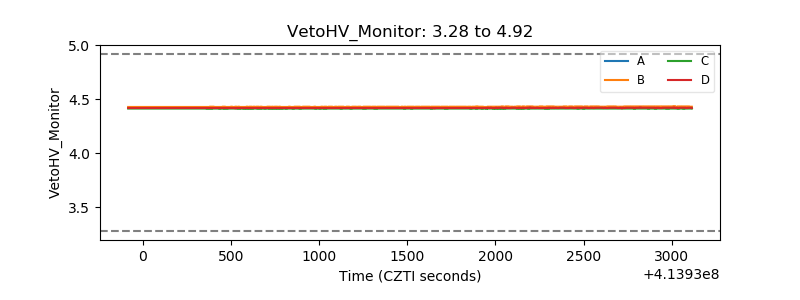 |
| Veto LLD | 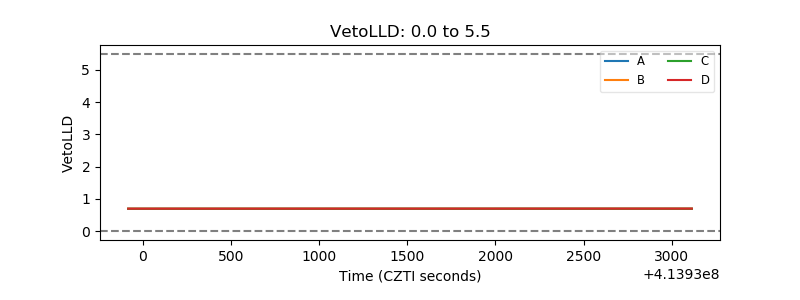 |
| Alpha Counter | 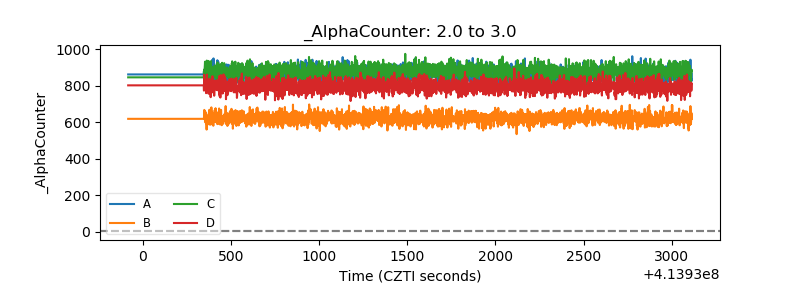 |
| _CPM_Rate | 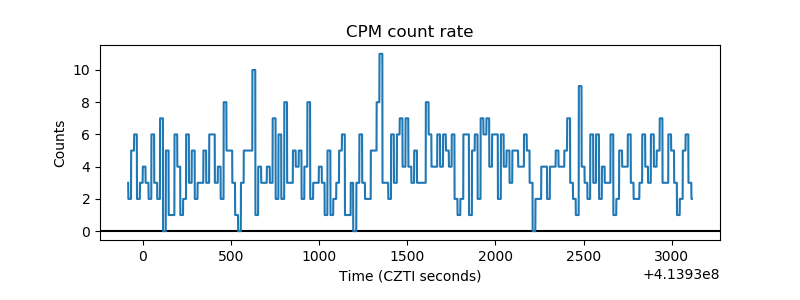 |
| CZT Counter | 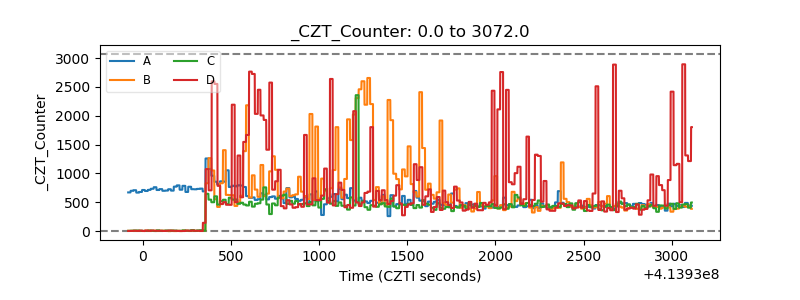 |
| +2.5 Volts monitor | 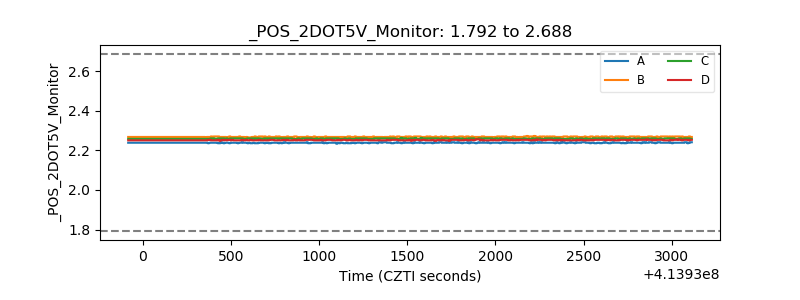 |
| +5 Volts monitor | 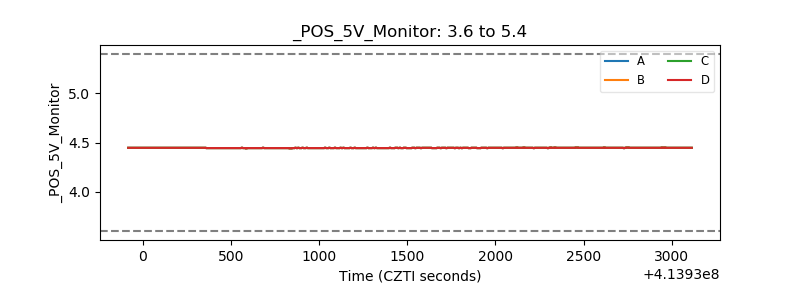 |
| _ROLL_ROT | 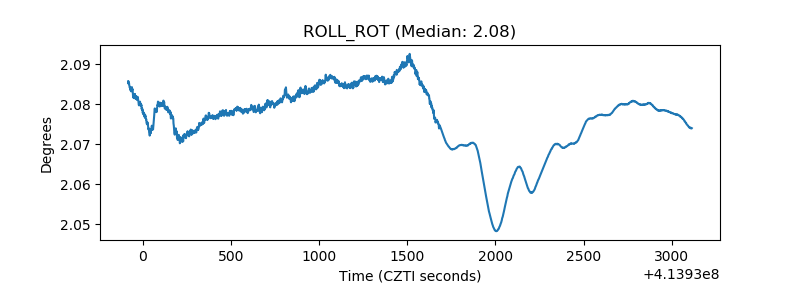 |
| _Roll_DEC | 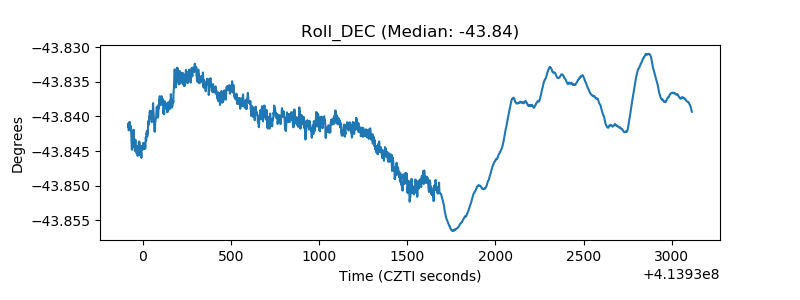 |
| _Roll_RA | 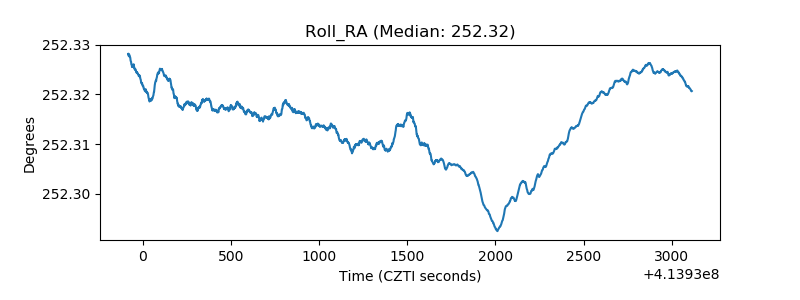 |
| Veto Counter | 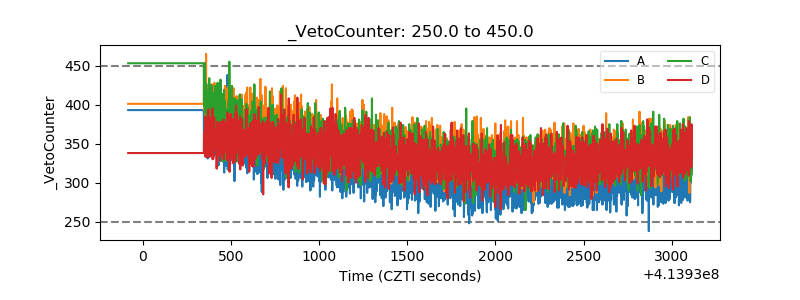 |