| Param | Original file | Final file |
|---|---|---|
| Filename | modeM0/AS1A12_032T03_9000005502_39891cztM0_level2.fits | modeM0/AS1A12_032T03_9000005502_39891cztM0_level2_quad_clean.evt |
| Size (bytes) | 456,289,920 | 114,148,800 |
| Size | 435.2 MB | 108.9 MB |
| Events in quadrant A | 3,658,995 | 771,462 |
| Events in quadrant B | 4,250,063 | 769,813 |
| Events in quadrant C | 3,320,829 | 757,117 |
| Events in quadrant D | 5,110,815 | 665,115 |
| Mode SS | |||
|---|---|---|---|
| Quadrant | BADHDUFLAG | Total packets | Discarded packets |
| A | 0 | 144 | 0 |
| B | 0 | 144 | 0 |
| C | 0 | 144 | 0 |
| D | 0 | 144 | 0 |
| Mode M9 | |||
|---|---|---|---|
| Quadrant | BADHDUFLAG | Total packets | Discarded packets |
| A | 0 | 14 | 0 |
| B | 0 | 14 | 0 |
| C | 0 | 14 | 0 |
| D | 0 | 14 | 0 |
| Mode M0 | |||
|---|---|---|---|
| Quadrant | BADHDUFLAG | Total packets | Discarded packets |
| A | 0 | 15264 | 1 |
| B | 0 | 17489 | 1 |
| C | 0 | 14384 | 1 |
| D | 0 | 20163 | 1 |
| Quadrant | Total seconds | Saturated seconds | Saturation percentage |
|---|---|---|---|
| A | 7072 | 12 | 0.169683% |
| B | 7072 | 235 | 3.322964% |
| C | 7072 | 9 | 0.127262% |
| D | 7072 | 440 | 6.221719% |
Noise dominated data is calculated using 1-second bins in cleaned event files. If a bin has >2000 counts, and if more than 50% of those come from <1% of pixels, then it is considered to be noise-dominated and hence unusable.
| Quadrant | # 1 sec bins | Bins with >0 counts | Bins with >2000 counts | High rate bins dominated by noise | Noise dominated (total time) | Noise dominated (detector-on time) | Marked lightcurve |
|---|---|---|---|---|---|---|---|
| A | 8415 | 7073 | 5 | 5 | 0.06% | 0.07% | 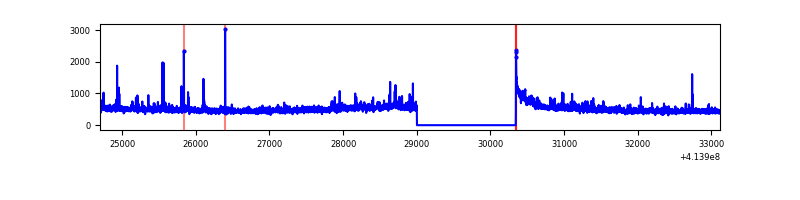 |
| B | 8415 | 7073 | 189 | 189 | 2.25% | 2.67% | 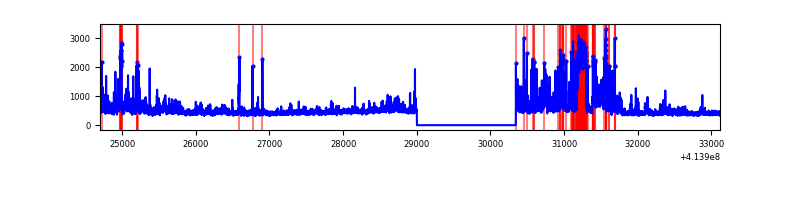 |
| C | 8415 | 7073 | 7 | 7 | 0.08% | 0.10% | 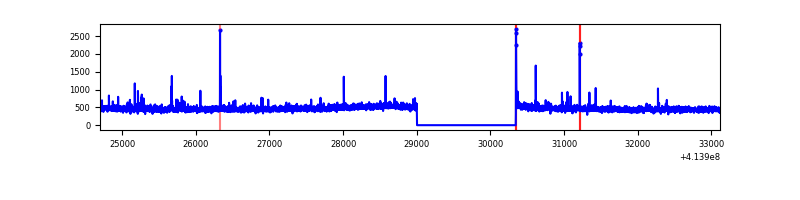 |
| D | 8415 | 7073 | 434 | 434 | 5.16% | 6.14% | 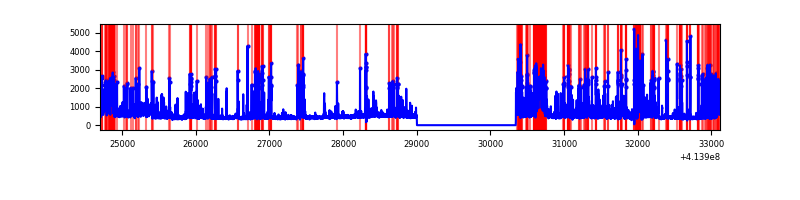 |
Top three noisy pixels from each quadrant. If the there are fewer than three noisy pixels in the level2.evt file, extra rows are filled as -1
| Pixel properties | Quadrant properties | ||||||
|---|---|---|---|---|---|---|---|
| Quadrant | DetID | PixID | Counts | Sigma | Mean | Median | Sigma |
| A | 10 | 83 | 525736 | 3381.9 | 761 | 749 | 155.2 |
| A | 6 | 10 | 41386 | 261.78 | 761 | 749 | 155.2 |
| A | 13 | 248 | 36861 | 232.63 | 761 | 749 | 155.2 |
| B | 5 | 255 | 385269 | 2657.22 | 751 | 731 | 144.7 |
| B | 0 | 183 | 356975 | 2461.71 | 751 | 731 | 144.7 |
| B | 0 | 221 | 212671 | 1464.54 | 751 | 731 | 144.7 |
| C | 15 | 214 | 287718 | 1645.86 | 749 | 756 | 174.4 |
| C | 14 | 254 | 30305 | 169.48 | 749 | 756 | 174.4 |
| C | 3 | 233 | 18536 | 101.98 | 749 | 756 | 174.4 |
| D | 12 | 227 | 1424205 | 8002.14 | 725 | 705 | 177.9 |
| D | 9 | 19 | 194237 | 1087.93 | 725 | 705 | 177.9 |
| D | 2 | 250 | 136580 | 763.81 | 725 | 705 | 177.9 |
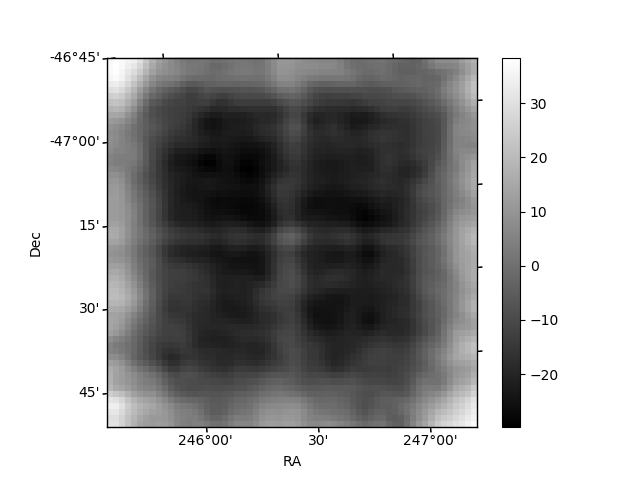
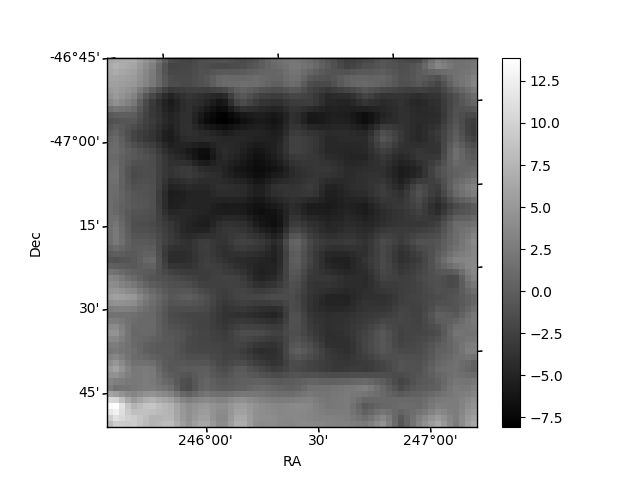
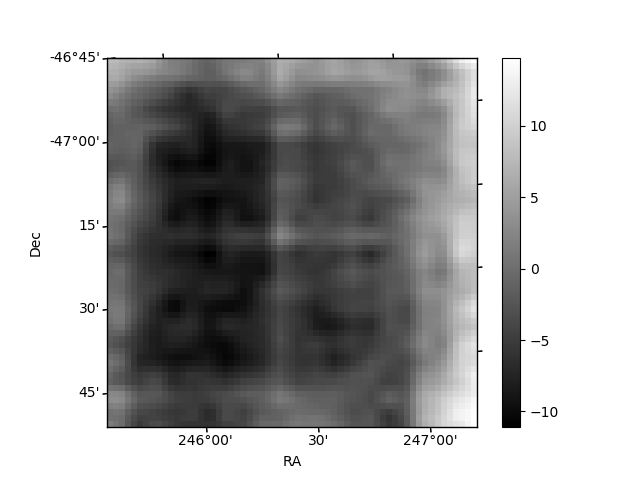
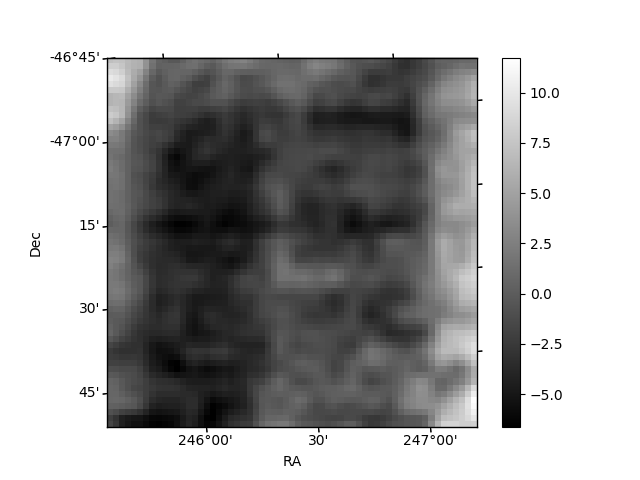
Histogram calculated using DETX and DETY for each event in the final _common_clean file
| Quadrant A | 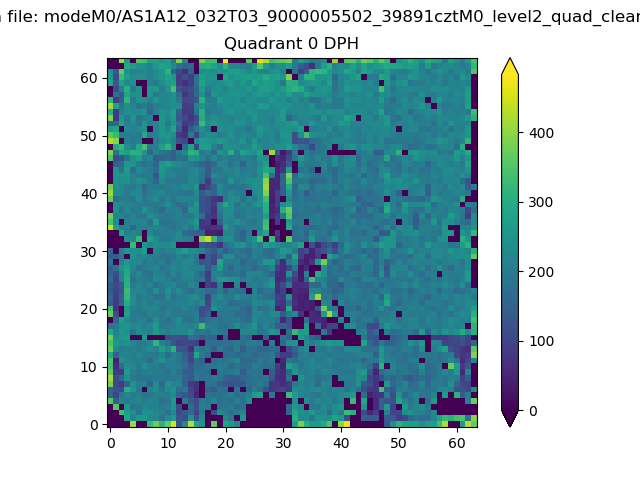 |
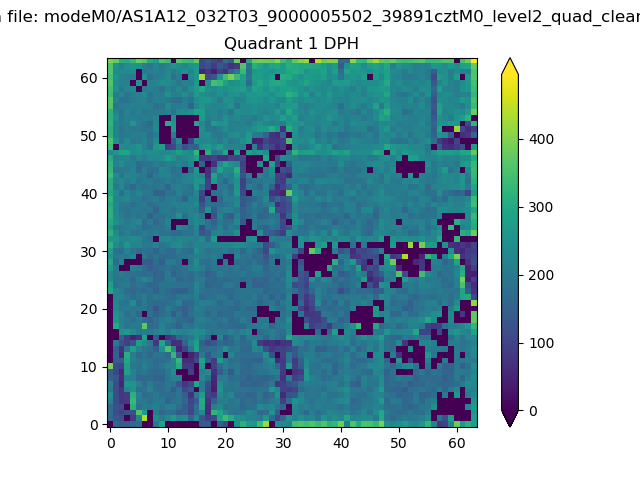 |
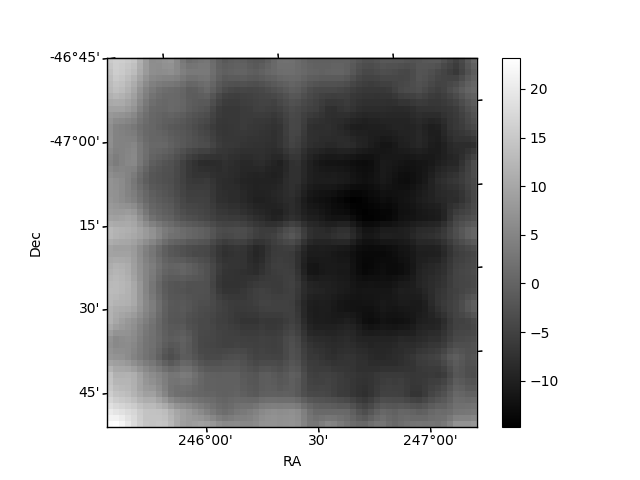
Quadrant B |
|---|---|---|---|
| Quadrant D | 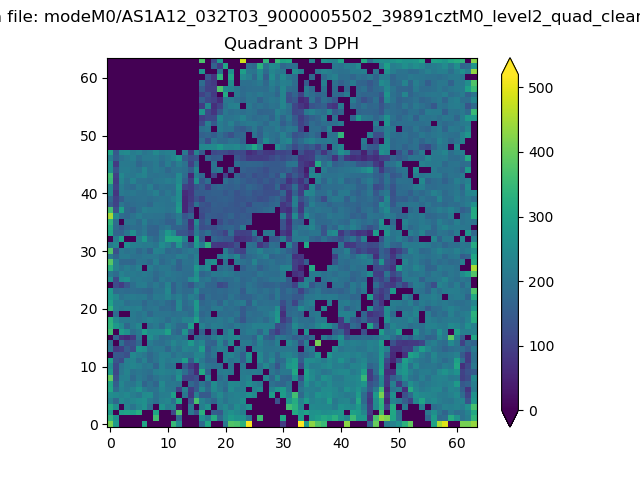 |
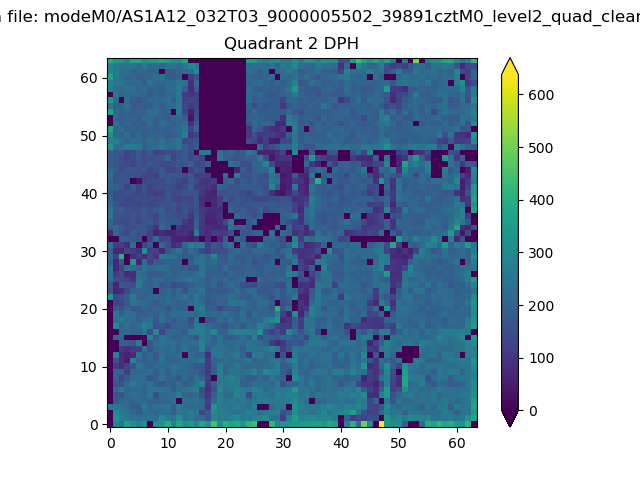 |
Quadrant C |
| Plot type | Count rate plots | Images |
|---|---|---|
| Comparison with Poisson distribution Blue bars denote a histogram of data divided into 1 sec bins. Red curve is a Poisson curve with rate = median count rate of data. |
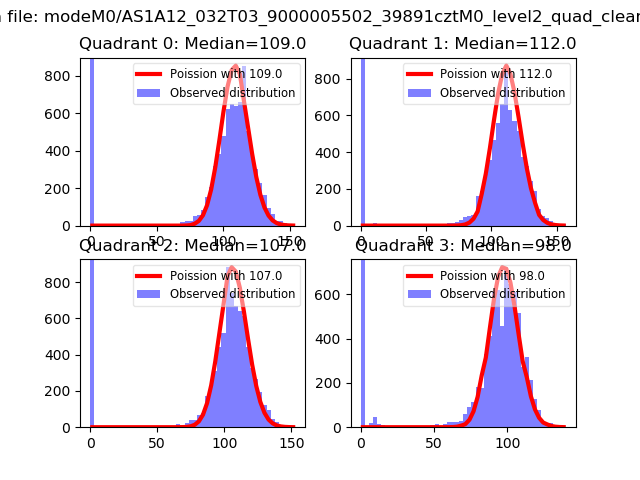 |
 |
| Quadrant-wise count rates Data is divided into 100 sec bins |
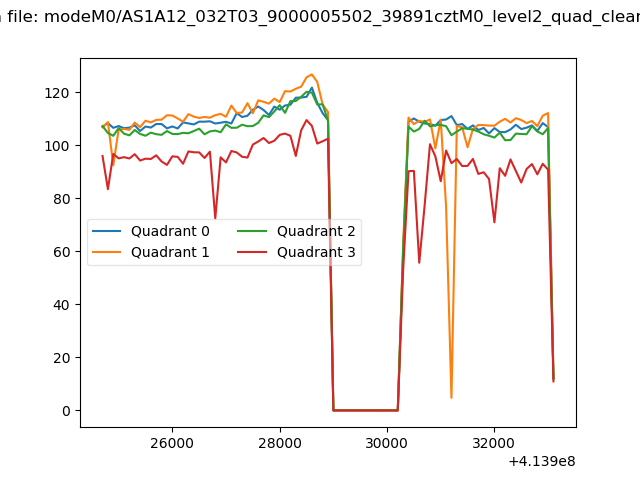 |
|
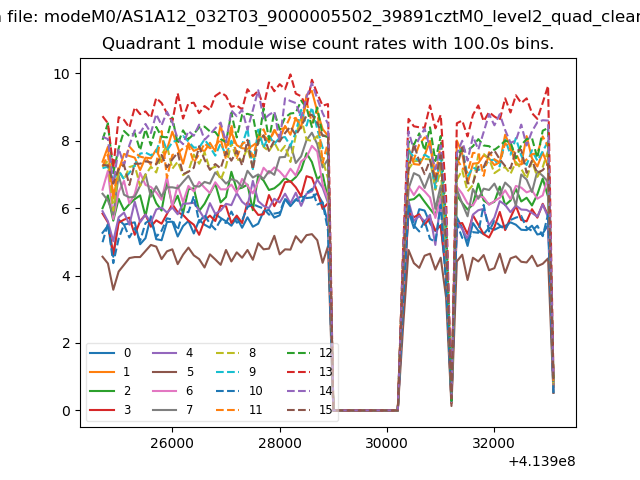
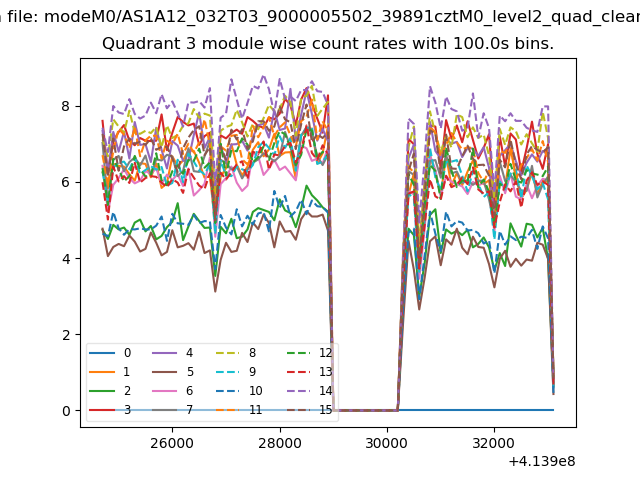
| Module-wise count rates for Quadrant A Data is divided into 100 sec bins |
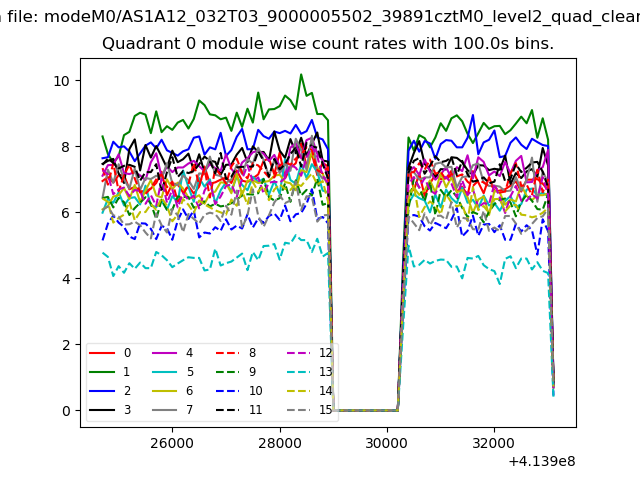 |
 |
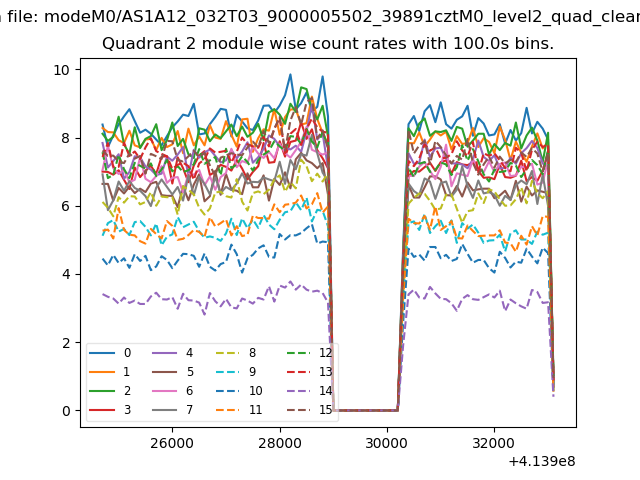
| Module-wise count rates for Quadrant B Data is divided into 100 sec bins |
 |
 |
| Module-wise count rates for Quadrant C Data is divided into 100 sec bins |
 |
 |
| Module-wise count rates for Quadrant D Data is divided into 100 sec bins |
 |
 |
| Parameter | Plot |
|---|---|
| CZT HV Monitor | 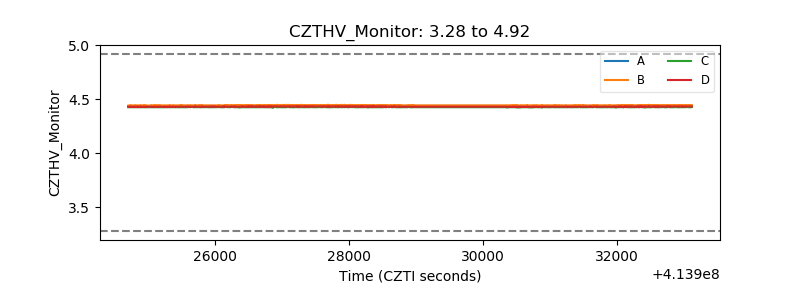 |
| D_VDD | 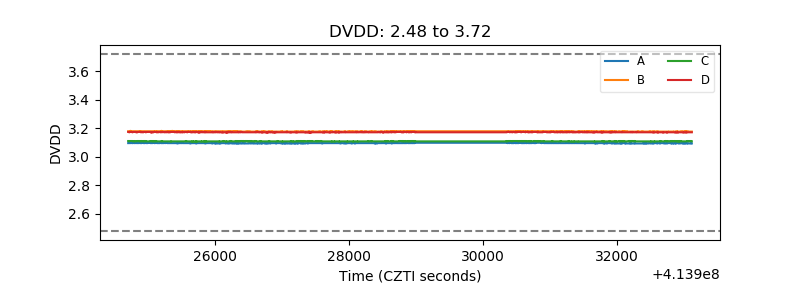 |
| Temperature 1 |  |
| Veto HV Monitor | 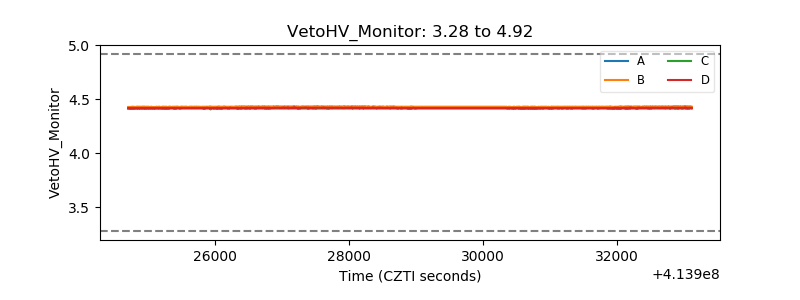 |
| Veto LLD | 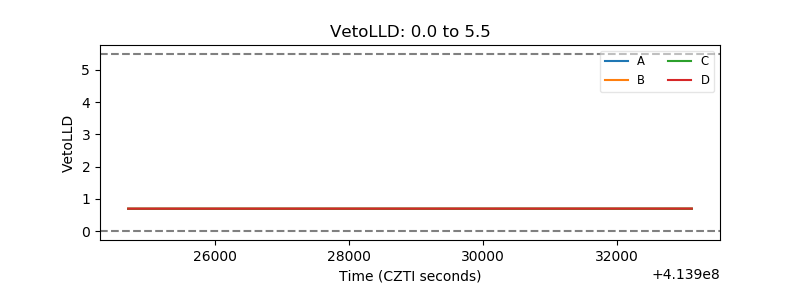 |
| Alpha Counter | 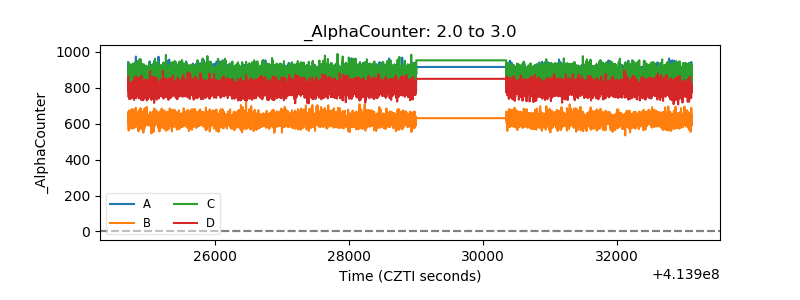 |
| _CPM_Rate | 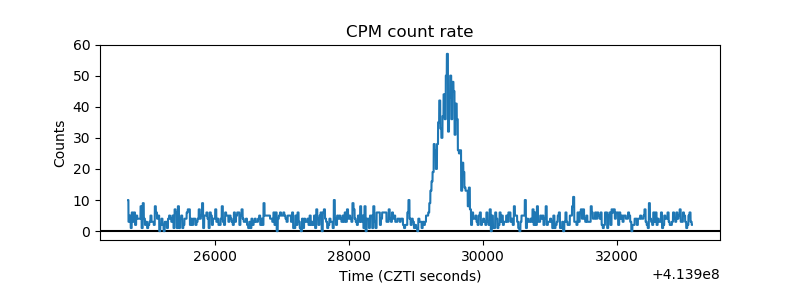 |
| CZT Counter |  |
| +2.5 Volts monitor | 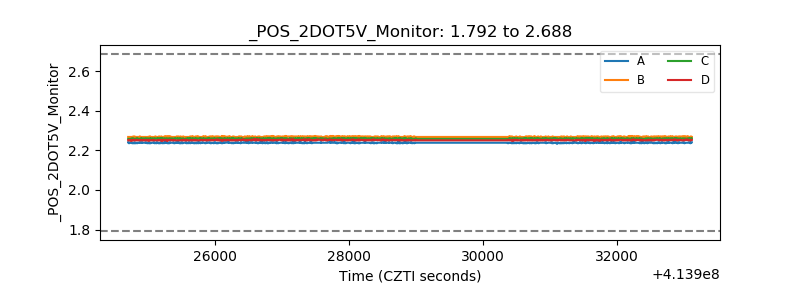 |
| +5 Volts monitor |  |
| _ROLL_ROT | 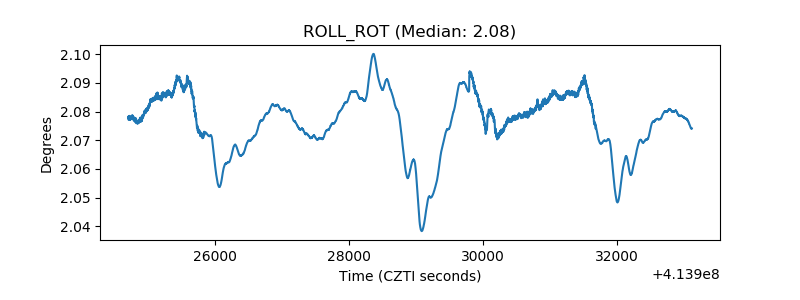 |
| _Roll_DEC | 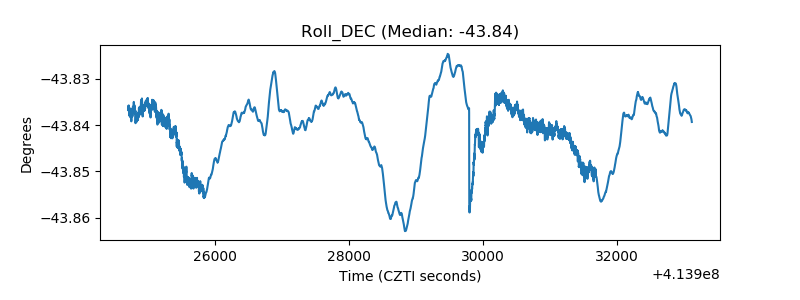 |
| _Roll_RA | 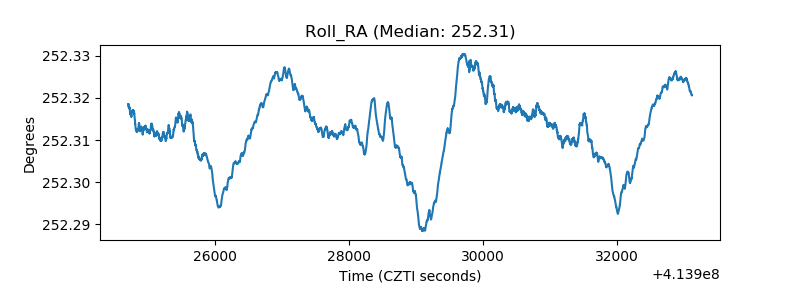 |
| Veto Counter | 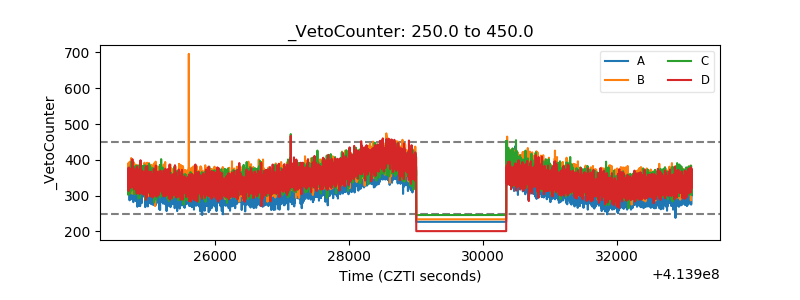 |