| Param | Original file | Final file |
|---|---|---|
| Filename | modeM0/AS1A12_037T07_9000005504_39890cztM0_level2.fits | modeM0/AS1A12_037T07_9000005504_39890cztM0_level2_quad_clean.evt |
| Size (bytes) | 411,278,400 | 107,714,880 |
| Size | 392.2 MB | 102.7 MB |
| Events in quadrant A | 3,563,234 | 731,098 |
| Events in quadrant B | 3,791,121 | 723,070 |
| Events in quadrant C | 3,178,400 | 711,440 |
| Events in quadrant D | 4,174,104 | 632,100 |
| Mode SS | |||
|---|---|---|---|
| Quadrant | BADHDUFLAG | Total packets | Discarded packets |
| A | 0 | 141 | 1 |
| B | 0 | 141 | 2 |
| C | 0 | 141 | 1 |
| D | 0 | 141 | 1 |
| Mode M0 | |||
|---|---|---|---|
| Quadrant | BADHDUFLAG | Total packets | Discarded packets |
| A | 0 | 15184 | 396 |
| B | 0 | 16162 | 393 |
| C | 0 | 14033 | 406 |
| D | 0 | 17802 | 587 |
| Mode M9 | |||
|---|---|---|---|
| Quadrant | BADHDUFLAG | Total packets | Discarded packets |
| A | 0 | 29 | 0 |
| B | 0 | 30 | 0 |
| C | 0 | 30 | 0 |
| D | 0 | 30 | 0 |
| Quadrant | Total seconds | Saturated seconds | Saturation percentage |
|---|---|---|---|
| A | 6654 | 18 | 0.270514% |
| B | 6648 | 275 | 4.136582% |
| C | 6645 | 9 | 0.135440% |
| D | 6613 | 295 | 4.460910% |
Noise dominated data is calculated using 1-second bins in cleaned event files. If a bin has >2000 counts, and if more than 50% of those come from <1% of pixels, then it is considered to be noise-dominated and hence unusable.
| Quadrant | # 1 sec bins | Bins with >0 counts | Bins with >2000 counts | High rate bins dominated by noise | Noise dominated (total time) | Noise dominated (detector-on time) | Marked lightcurve |
|---|---|---|---|---|---|---|---|
| A | 9900 | 6833 | 4 | 4 | 0.04% | 0.06% | 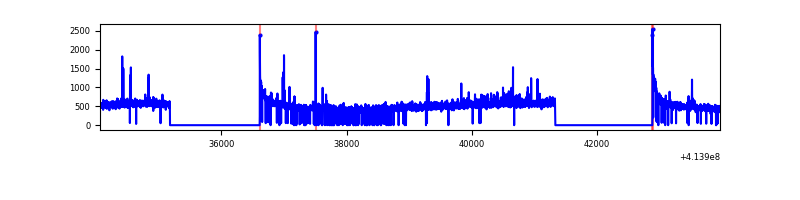 |
| B | 9900 | 6826 | 197 | 197 | 1.99% | 2.89% | 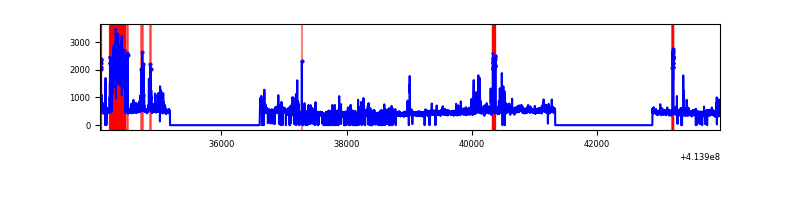 |
| C | 9900 | 6828 | 4 | 4 | 0.04% | 0.06% | 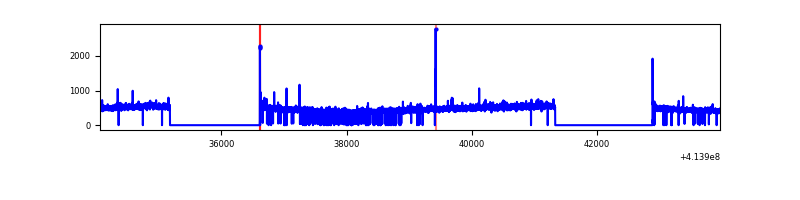 |
| D | 9900 | 6825 | 228 | 228 | 2.30% | 3.34% | 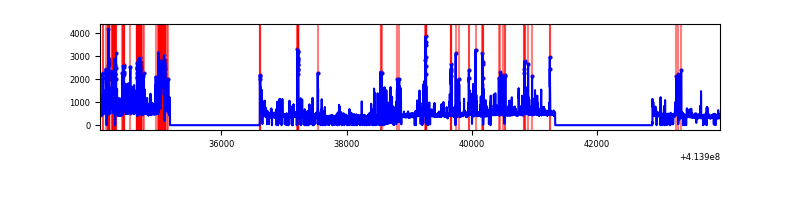 |
Top three noisy pixels from each quadrant. If the there are fewer than three noisy pixels in the level2.evt file, extra rows are filled as -1
| Pixel properties | Quadrant properties | ||||||
|---|---|---|---|---|---|---|---|
| Quadrant | DetID | PixID | Counts | Sigma | Mean | Median | Sigma |
| A | 10 | 83 | 536656 | 3490.3 | 746 | 730 | 153.5 |
| A | 6 | 10 | 66350 | 427.36 | 746 | 730 | 153.5 |
| A | 2 | 79 | 33220 | 211.6 | 746 | 730 | 153.5 |
| B | 4 | 171 | 572573 | 4089.88 | 720 | 700 | 139.8 |
| B | 0 | 229 | 140339 | 998.66 | 720 | 700 | 139.8 |
| B | 5 | 255 | 66869 | 473.22 | 720 | 700 | 139.8 |
| C | 15 | 214 | 274951 | 1634.62 | 722 | 724 | 167.8 |
| C | 1 | 16 | 26349 | 152.75 | 722 | 724 | 167.8 |
| C | 14 | 254 | 20288 | 116.62 | 722 | 724 | 167.8 |
| D | 12 | 227 | 838308 | 4779.8 | 708 | 687 | 175.2 |
| D | 5 | 32 | 171088 | 972.38 | 708 | 687 | 175.2 |
| D | 12 | 233 | 109691 | 622.02 | 708 | 687 | 175.2 |
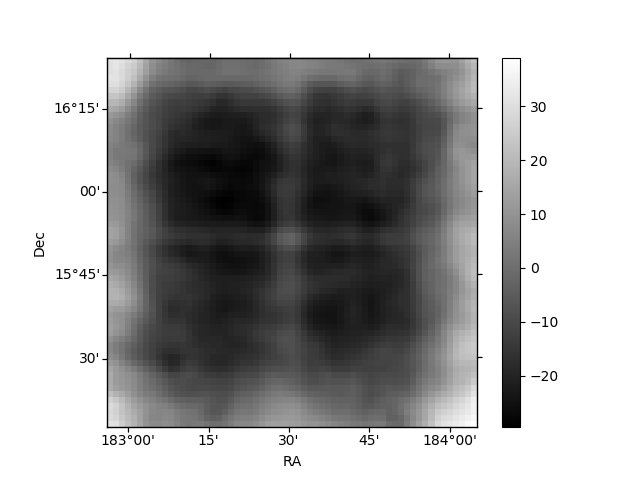
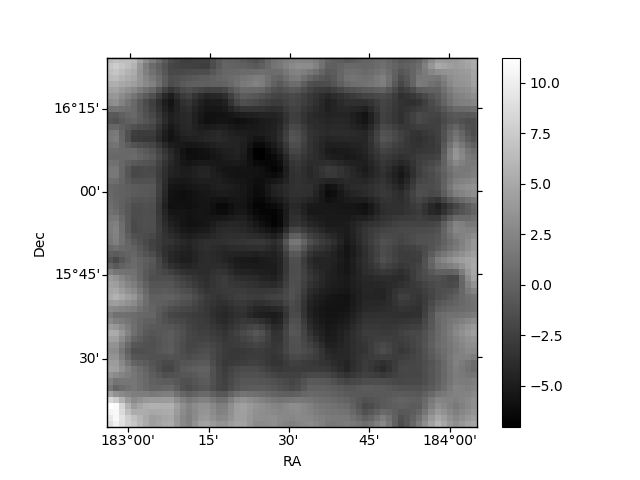
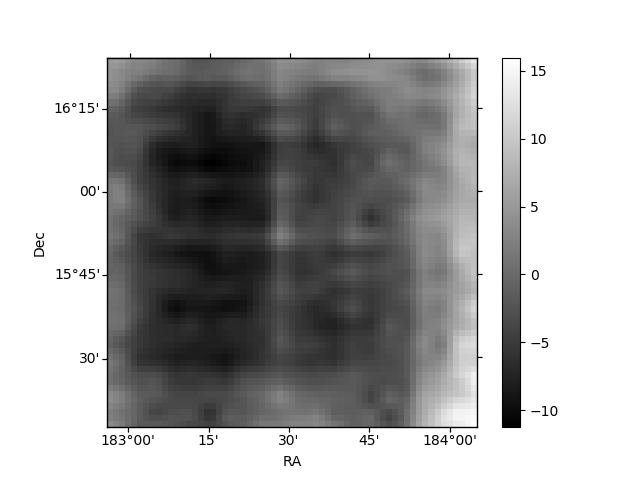
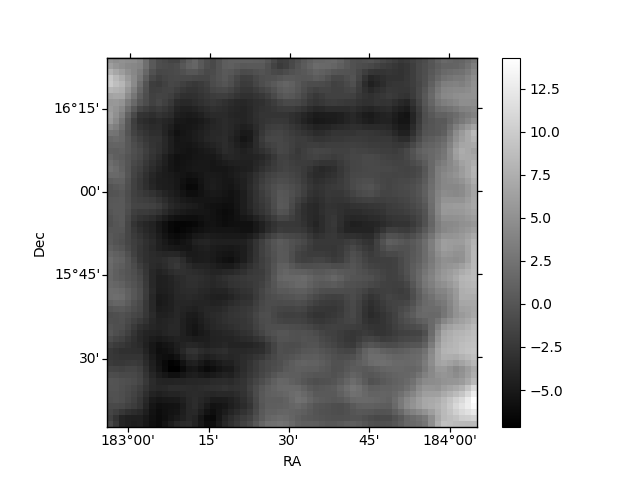
Histogram calculated using DETX and DETY for each event in the final _common_clean file
| Quadrant A | 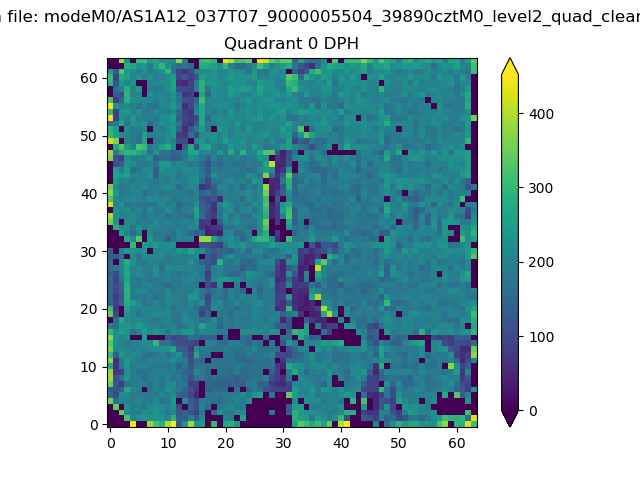 |
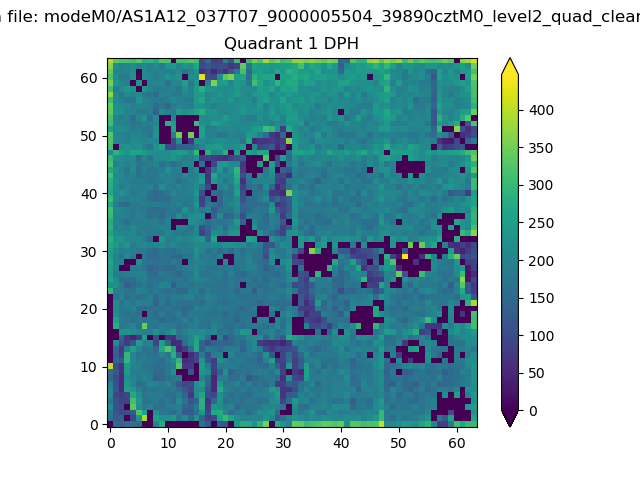 |
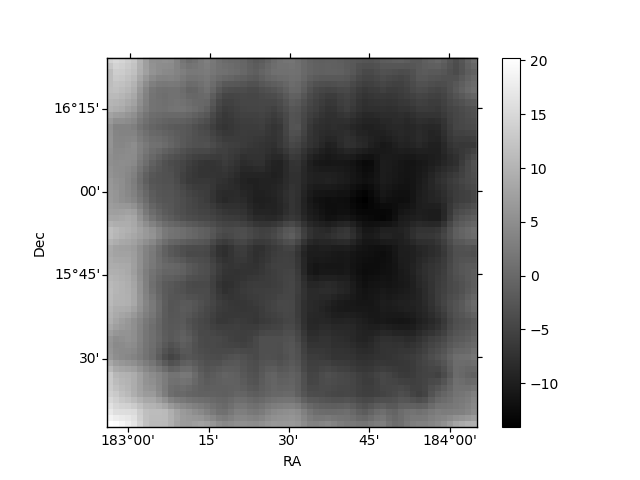
Quadrant B |
|---|---|---|---|
| Quadrant D | 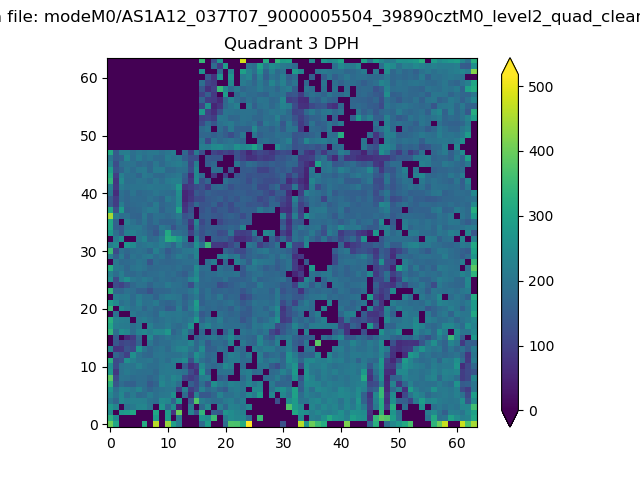 |
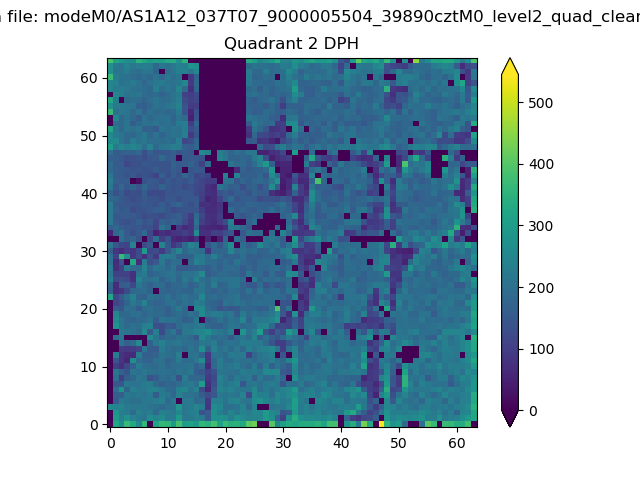 |
Quadrant C |
| Plot type | Count rate plots | Images |
|---|---|---|
| Comparison with Poisson distribution Blue bars denote a histogram of data divided into 1 sec bins. Red curve is a Poisson curve with rate = median count rate of data. |
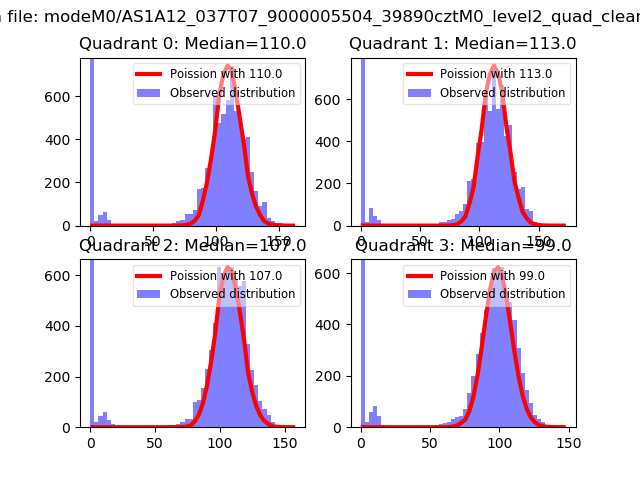 |
 |
| Quadrant-wise count rates Data is divided into 100 sec bins |
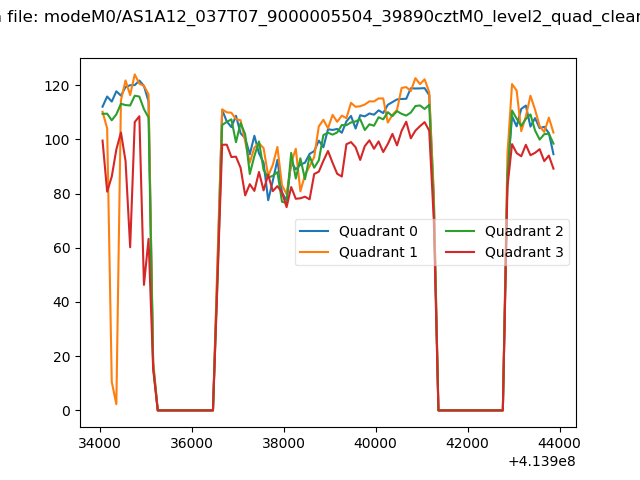 |
|
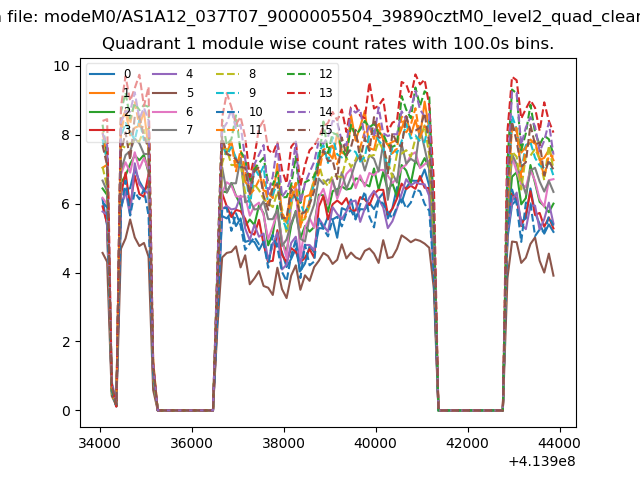
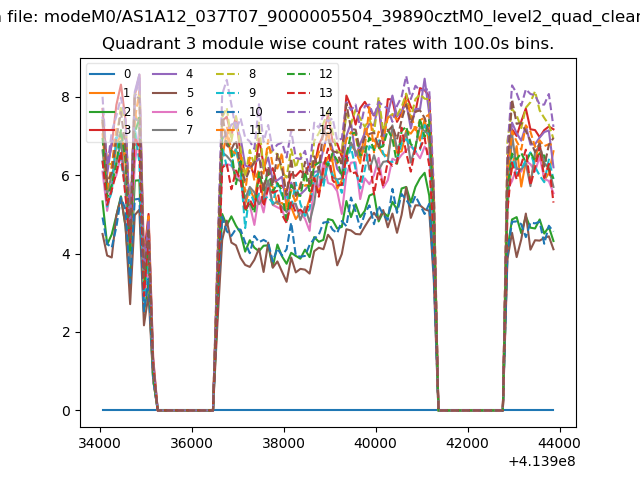
| Module-wise count rates for Quadrant A Data is divided into 100 sec bins |
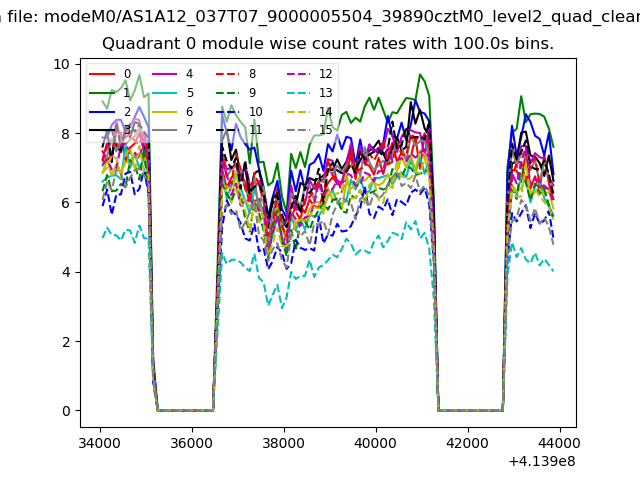 |
 |
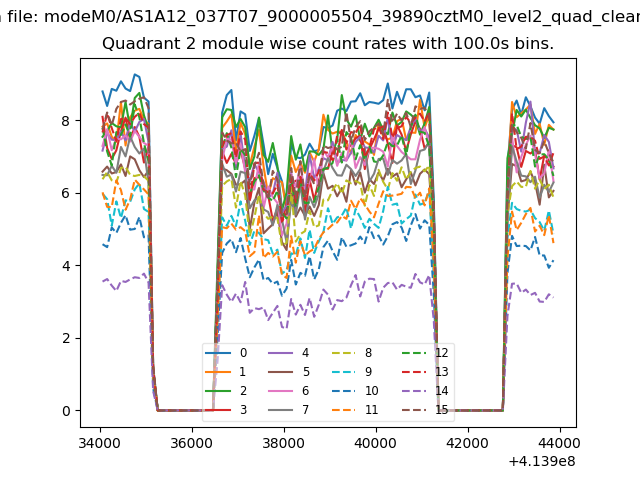
| Module-wise count rates for Quadrant B Data is divided into 100 sec bins |
 |
 |
| Module-wise count rates for Quadrant C Data is divided into 100 sec bins |
 |
 |
| Module-wise count rates for Quadrant D Data is divided into 100 sec bins |
 |
 |
| Parameter | Plot |
|---|---|
| CZT HV Monitor | 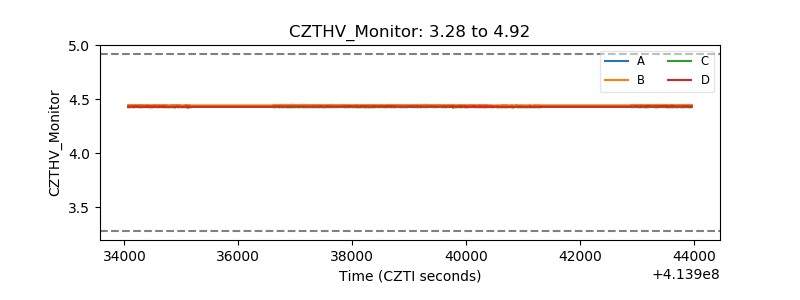 |
| D_VDD | 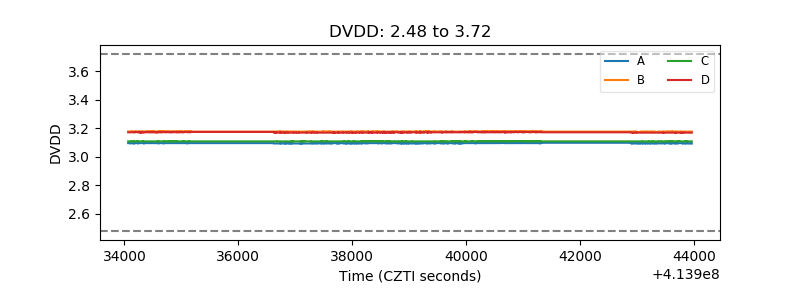 |
| Temperature 1 | 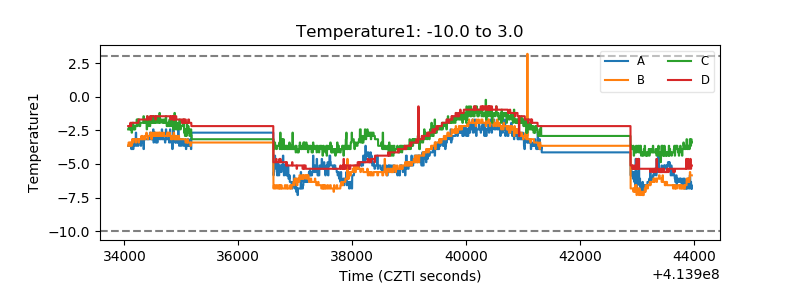 |
| Veto HV Monitor | 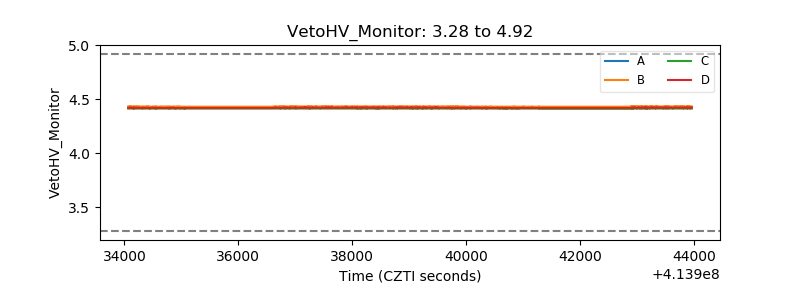 |
| Veto LLD | 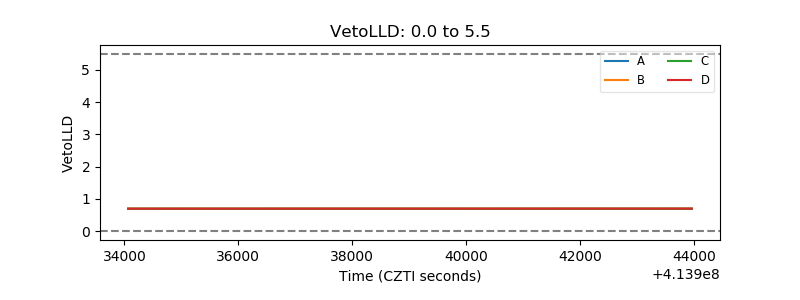 |
| Alpha Counter | 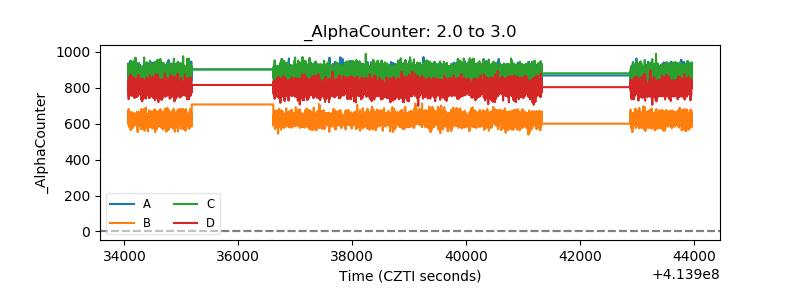 |
| _CPM_Rate | 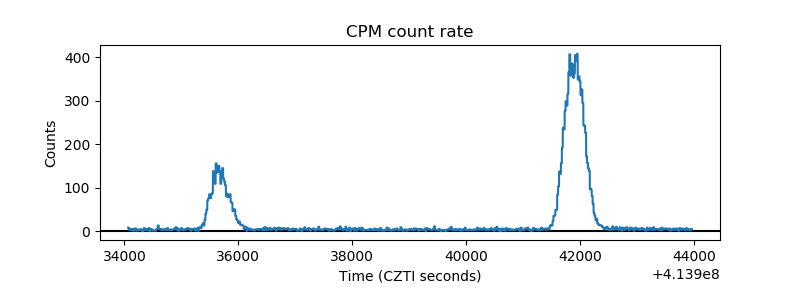 |
| CZT Counter | 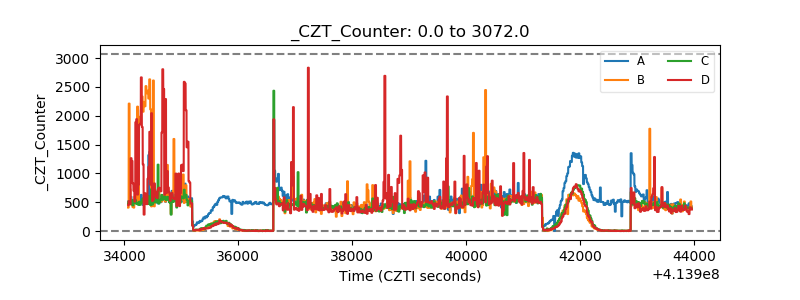 |
| +2.5 Volts monitor | 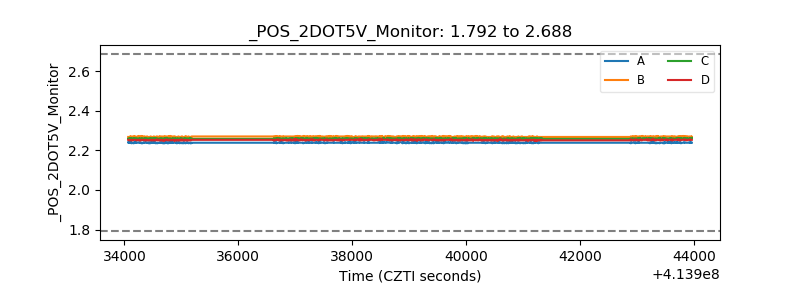 |
| +5 Volts monitor | 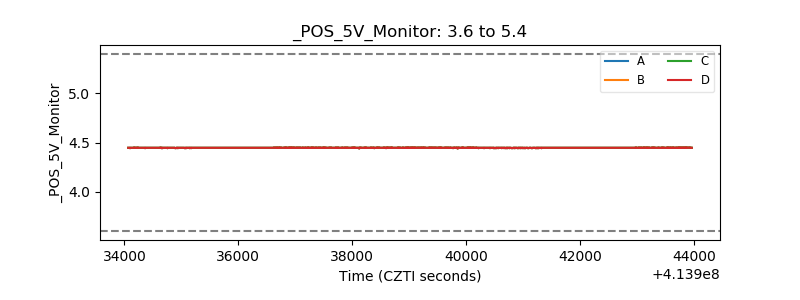 |
| _ROLL_ROT | 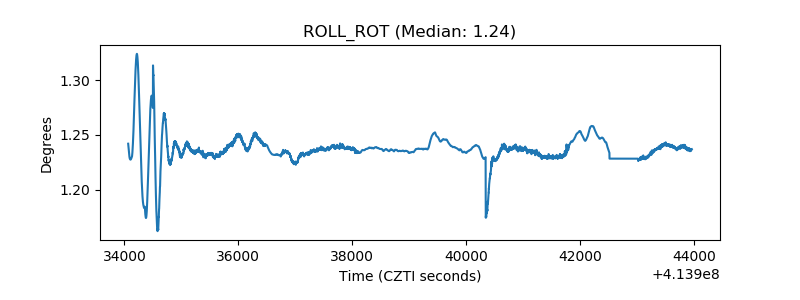 |
| _Roll_DEC | 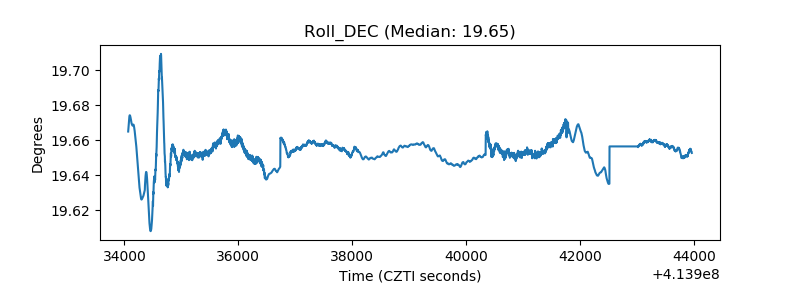 |
| _Roll_RA | 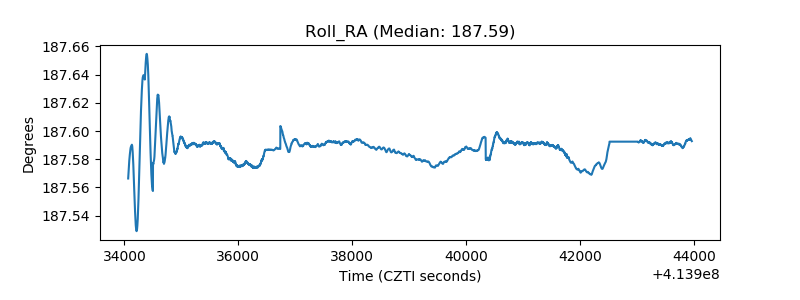 |
| Veto Counter | 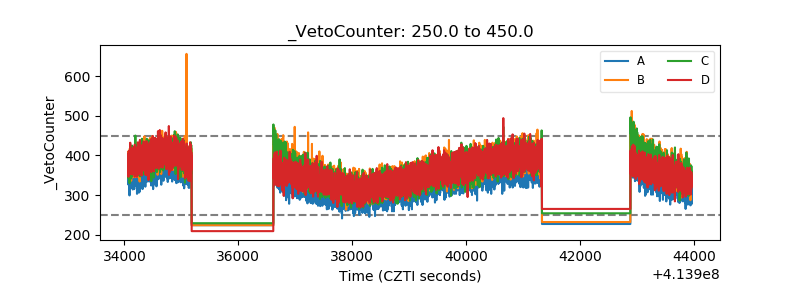 |