| Param | Original file | Final file |
|---|---|---|
| Filename | modeM0/AS1A12_037T07_9000005504_39891cztM0_level2.fits | modeM0/AS1A12_037T07_9000005504_39891cztM0_level2_quad_clean.evt |
| Size (bytes) | 693,092,160 | 189,587,520 |
| Size | 661.0 MB | 180.8 MB |
| Events in quadrant A | 6,233,301 | 1,277,503 |
| Events in quadrant B | 6,190,464 | 1,285,589 |
| Events in quadrant C | 5,509,364 | 1,248,803 |
| Events in quadrant D | 6,820,985 | 1,124,273 |
| Mode SS | |||
|---|---|---|---|
| Quadrant | BADHDUFLAG | Total packets | Discarded packets |
| A | 0 | 238 | 0 |
| B | 0 | 238 | 0 |
| C | 0 | 238 | 0 |
| D | 0 | 238 | 0 |
| Mode M0 | |||
|---|---|---|---|
| Quadrant | BADHDUFLAG | Total packets | Discarded packets |
| A | 0 | 25872 | 3 |
| B | 0 | 26344 | 2 |
| C | 0 | 23762 | 2 |
| D | 0 | 28701 | 2 |
| Mode M9 | |||
|---|---|---|---|
| Quadrant | BADHDUFLAG | Total packets | Discarded packets |
| A | 0 | 47 | 0 |
| B | 0 | 47 | 0 |
| C | 0 | 47 | 0 |
| D | 0 | 47 | 0 |
| Quadrant | Total seconds | Saturated seconds | Saturation percentage |
|---|---|---|---|
| A | 11626 | 37 | 0.318252% |
| B | 11626 | 310 | 2.666437% |
| C | 11626 | 16 | 0.137623% |
| D | 11626 | 363 | 3.122312% |
Noise dominated data is calculated using 1-second bins in cleaned event files. If a bin has >2000 counts, and if more than 50% of those come from <1% of pixels, then it is considered to be noise-dominated and hence unusable.
| Quadrant | # 1 sec bins | Bins with >0 counts | Bins with >2000 counts | High rate bins dominated by noise | Noise dominated (total time) | Noise dominated (detector-on time) | Marked lightcurve |
|---|---|---|---|---|---|---|---|
| A | 16316 | 11629 | 13 | 13 | 0.08% | 0.11% | 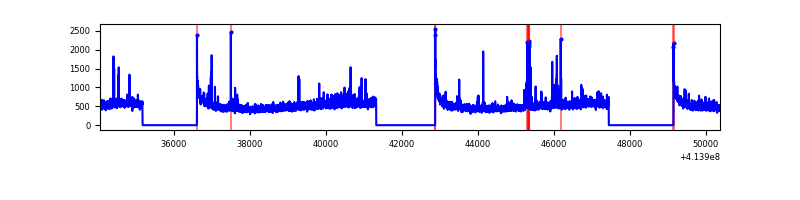 |
| B | 16316 | 11629 | 218 | 218 | 1.34% | 1.87% | 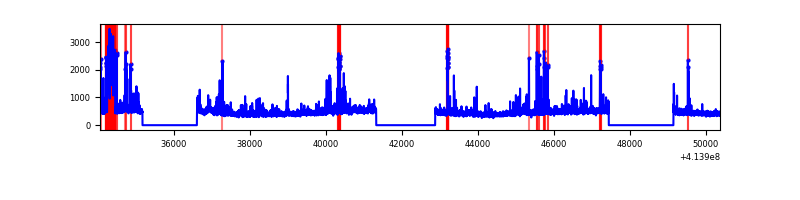 |
| C | 16316 | 11629 | 6 | 6 | 0.04% | 0.05% | 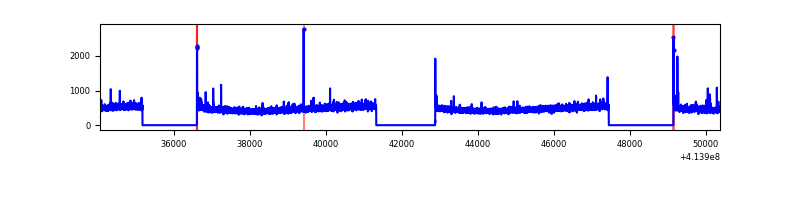 |
| D | 16316 | 11629 | 306 | 306 | 1.88% | 2.63% | 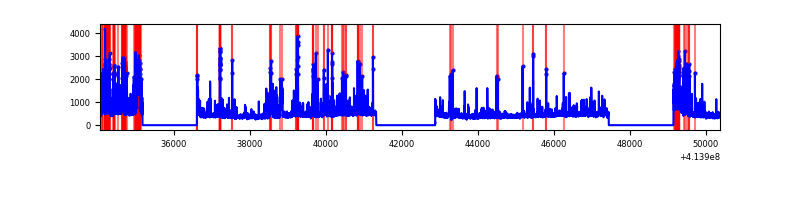 |
Top three noisy pixels from each quadrant. If the there are fewer than three noisy pixels in the level2.evt file, extra rows are filled as -1
| Pixel properties | Quadrant properties | ||||||
|---|---|---|---|---|---|---|---|
| Quadrant | DetID | PixID | Counts | Sigma | Mean | Median | Sigma |
| A | 10 | 83 | 901805 | 3423.29 | 1294 | 1268 | 263.1 |
| A | 6 | 10 | 95213 | 357.12 | 1294 | 1268 | 263.1 |
| A | 15 | 223 | 82950 | 310.5 | 1294 | 1268 | 263.1 |
| B | 4 | 171 | 592771 | 2431.83 | 1263 | 1228 | 243.2 |
| B | 0 | 229 | 210141 | 858.84 | 1263 | 1228 | 243.2 |
| B | 0 | 183 | 95963 | 389.46 | 1263 | 1228 | 243.2 |
| C | 15 | 214 | 478700 | 1649.43 | 1254 | 1259 | 289.5 |
| C | 14 | 254 | 43446 | 145.74 | 1254 | 1259 | 289.5 |
| C | 1 | 16 | 33289 | 110.65 | 1254 | 1259 | 289.5 |
| D | 12 | 227 | 1010306 | 3295.23 | 1244 | 1207 | 306.2 |
| D | 5 | 32 | 177467 | 575.58 | 1244 | 1207 | 306.2 |
| D | 15 | 1 | 176377 | 572.02 | 1244 | 1207 | 306.2 |
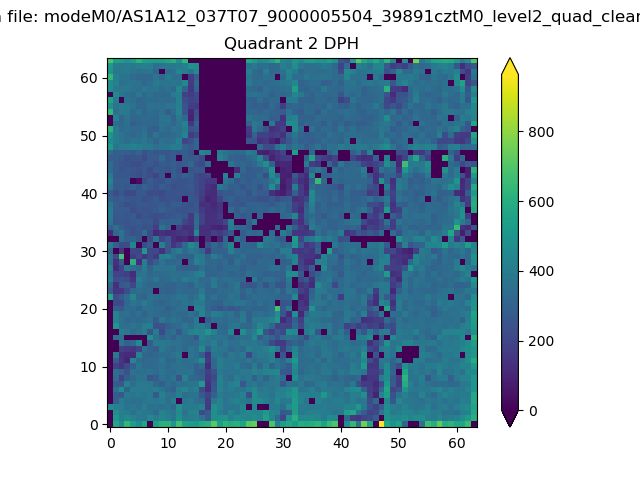
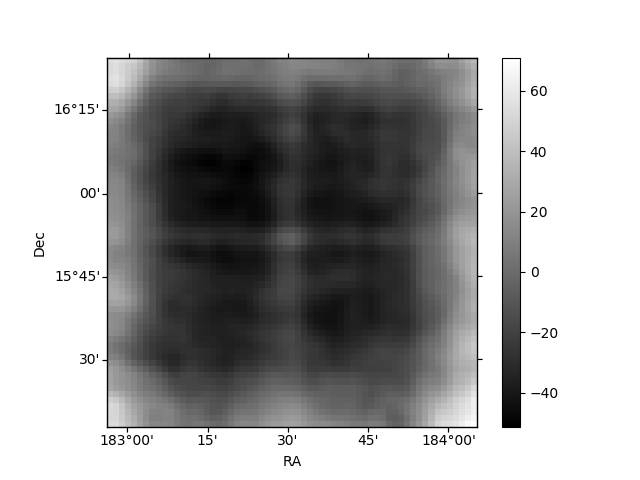
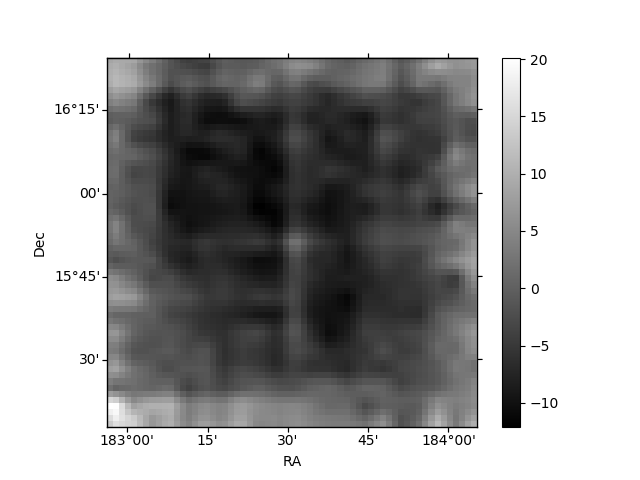
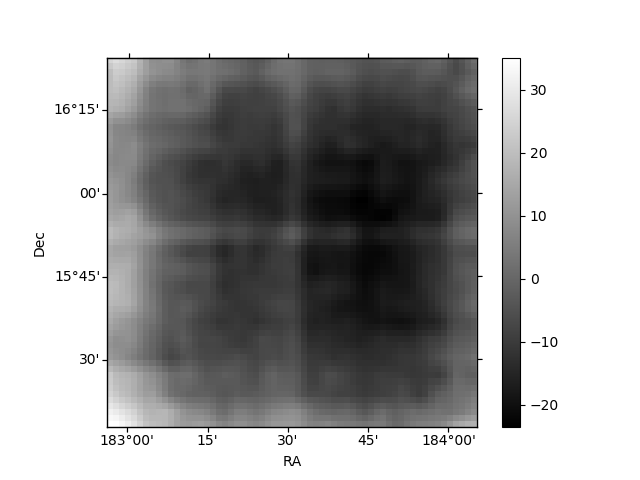
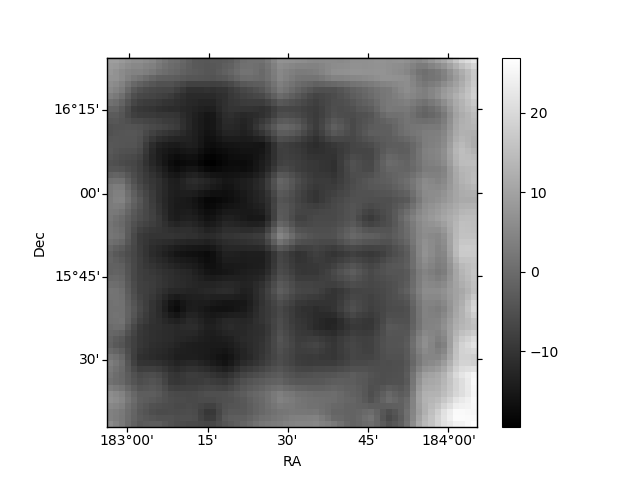
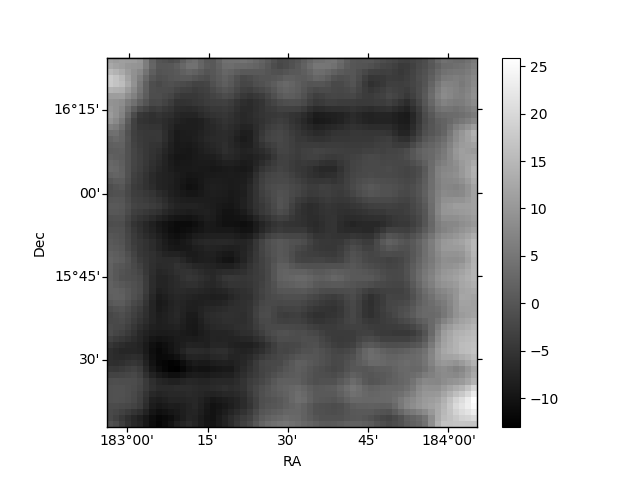
Histogram calculated using DETX and DETY for each event in the final _common_clean file
| Quadrant A | 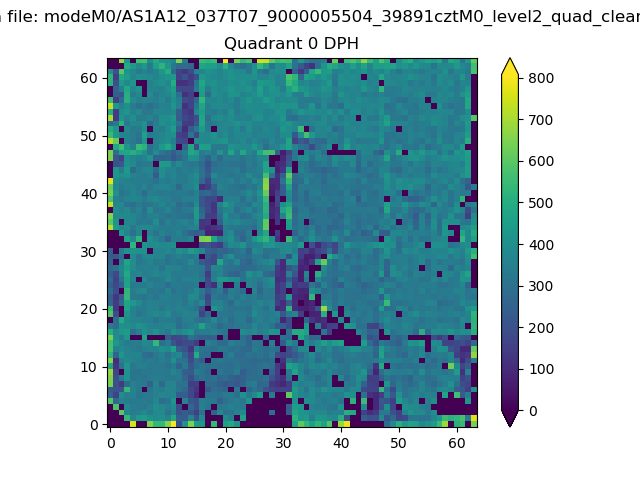 |
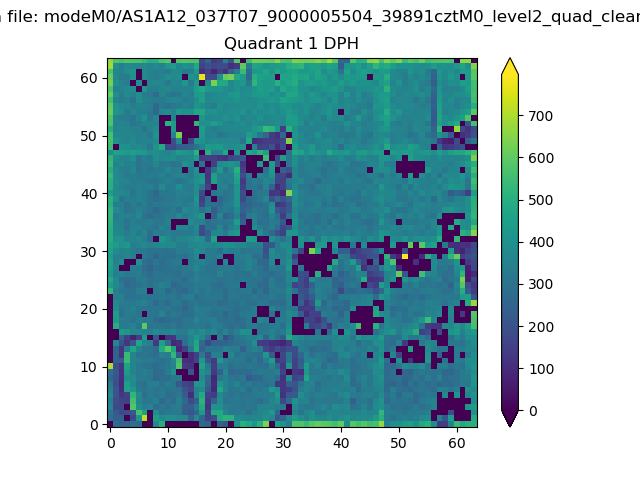 |
Quadrant B |
|---|---|---|---|
| Quadrant D | 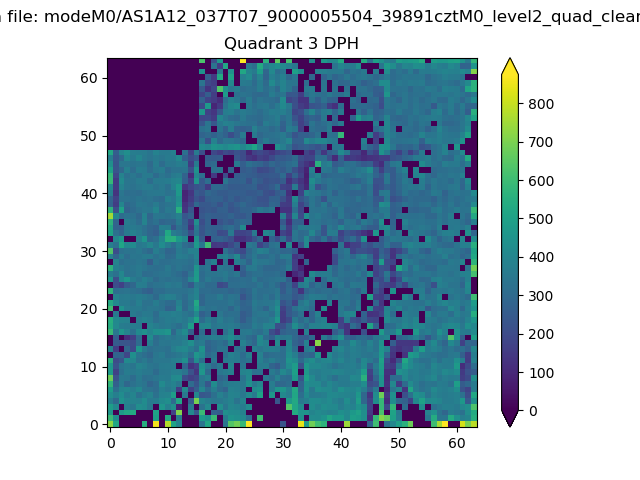 |
 |
Quadrant C |
| Plot type | Count rate plots | Images |
|---|---|---|
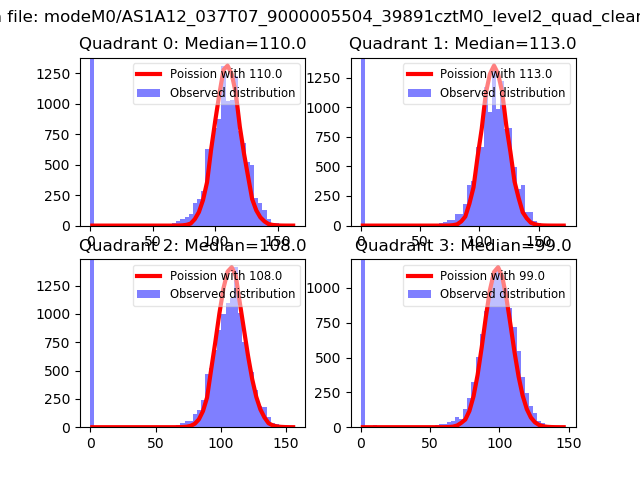
| Comparison with Poisson distribution Blue bars denote a histogram of data divided into 1 sec bins. Red curve is a Poisson curve with rate = median count rate of data. |
 |
 |
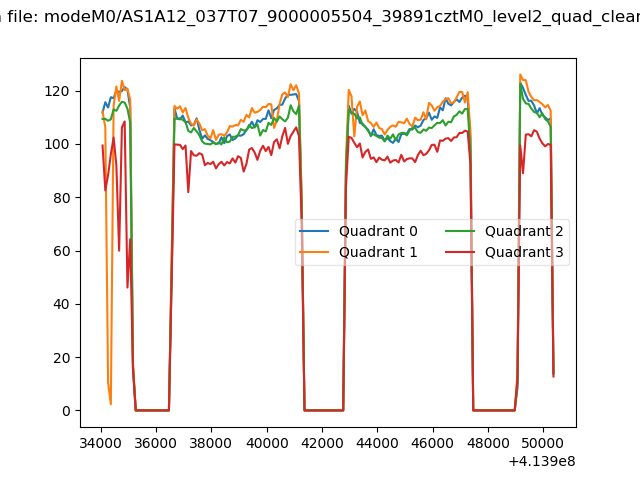
| Quadrant-wise count rates Data is divided into 100 sec bins |
 |
|
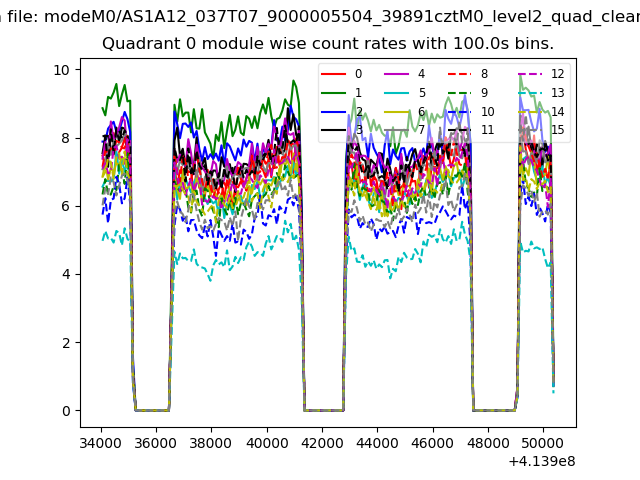
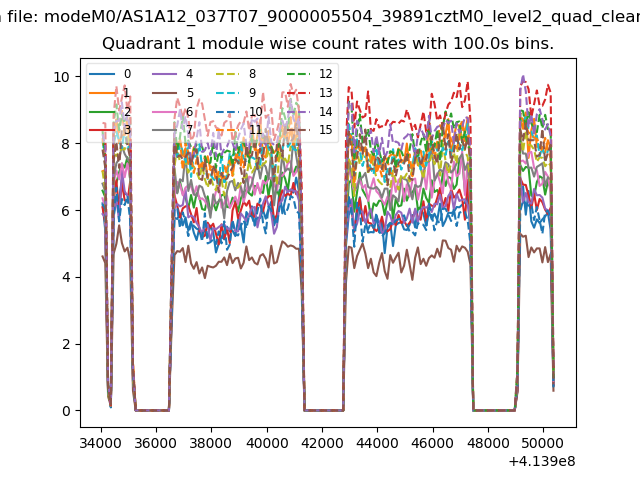
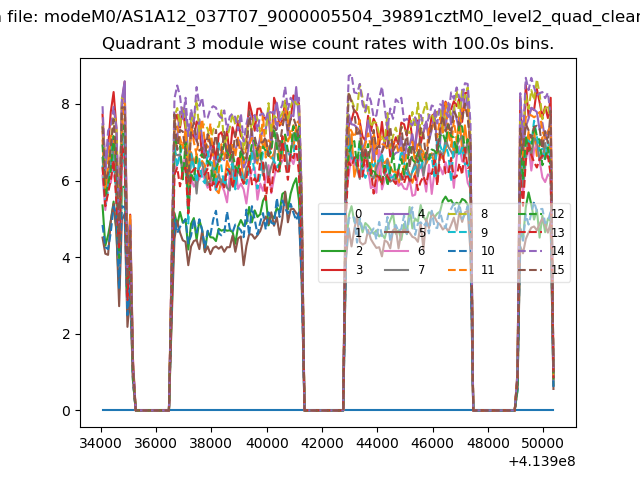
| Module-wise count rates for Quadrant A Data is divided into 100 sec bins |
 |
 |
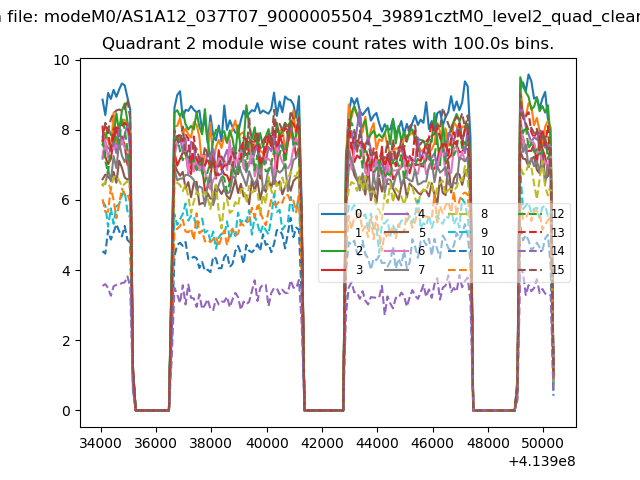
| Module-wise count rates for Quadrant B Data is divided into 100 sec bins |
 |
 |
| Module-wise count rates for Quadrant C Data is divided into 100 sec bins |
 |
 |
| Module-wise count rates for Quadrant D Data is divided into 100 sec bins |
 |
 |
| Parameter | Plot |
|---|---|
| CZT HV Monitor | 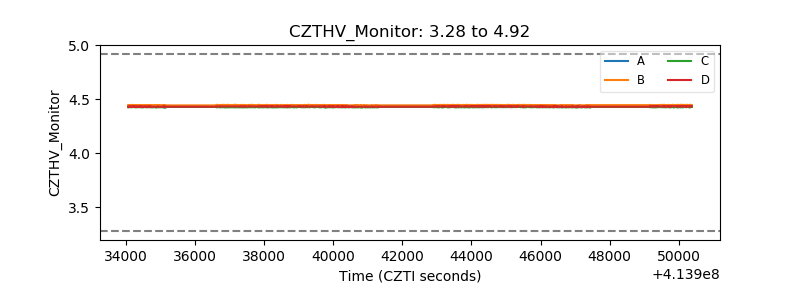 |
| D_VDD | 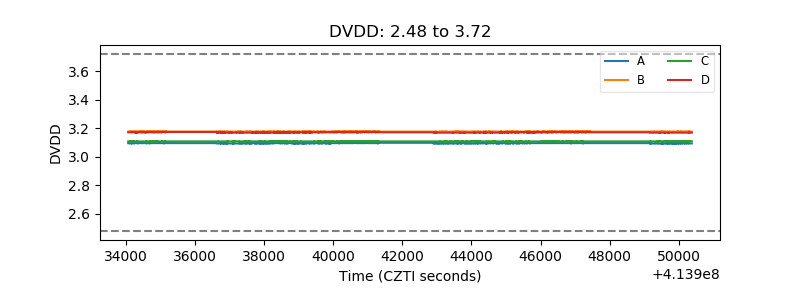 |
| Temperature 1 | 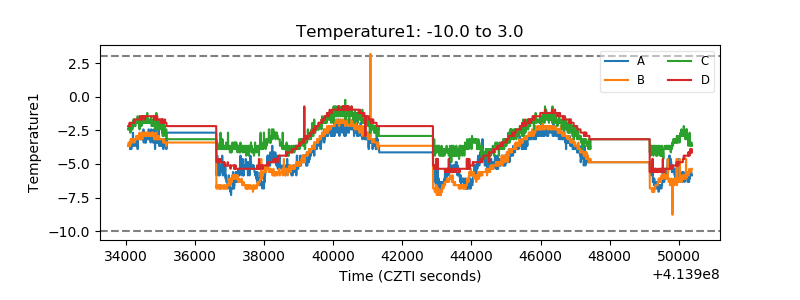 |
| Veto HV Monitor | 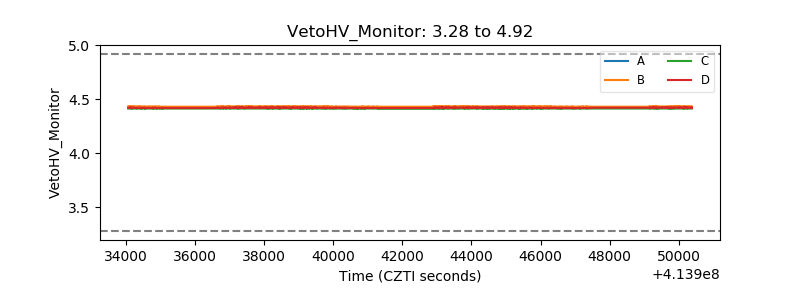 |
| Veto LLD | 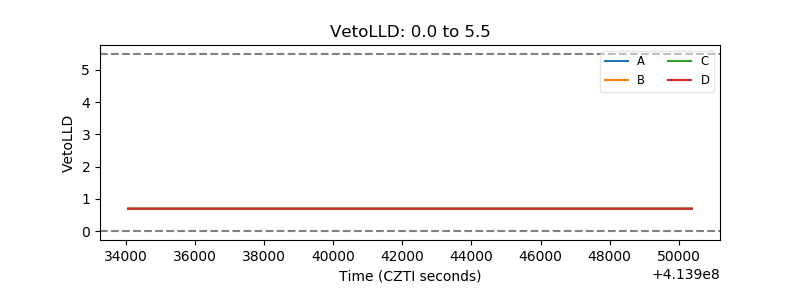 |
| Alpha Counter | 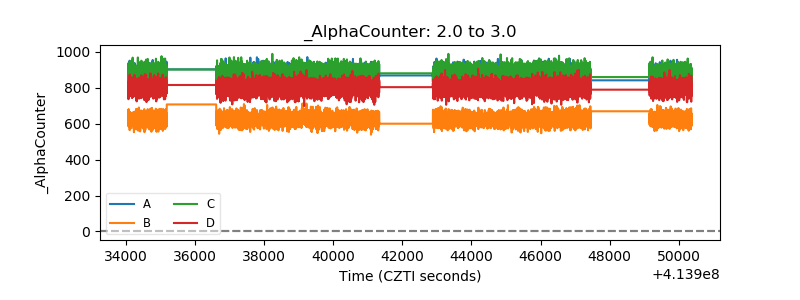 |
| _CPM_Rate | 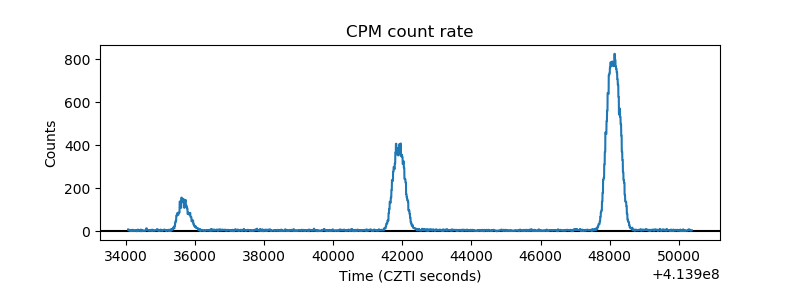 |
| CZT Counter | 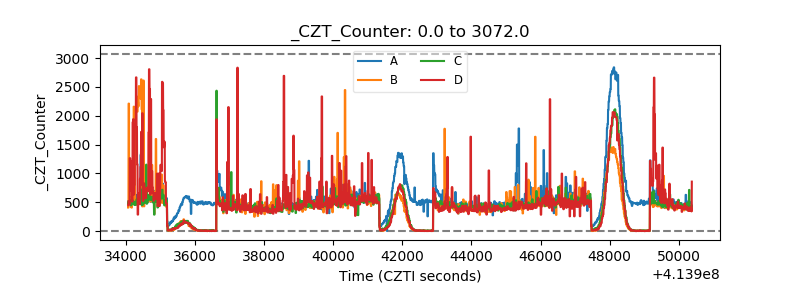 |
| +2.5 Volts monitor |  |
| +5 Volts monitor | 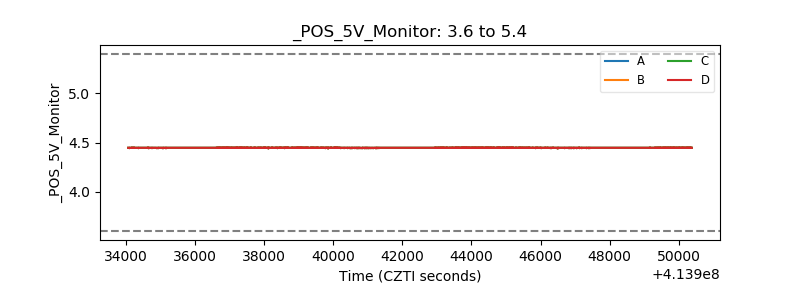 |
| _ROLL_ROT | 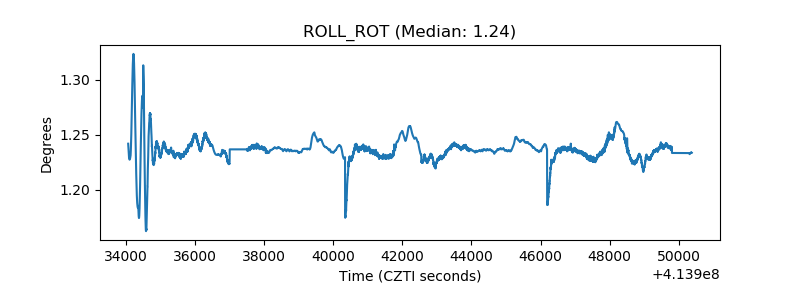 |
| _Roll_DEC | 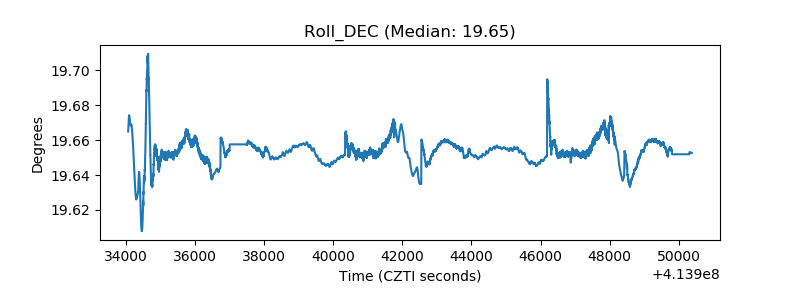 |
| _Roll_RA | 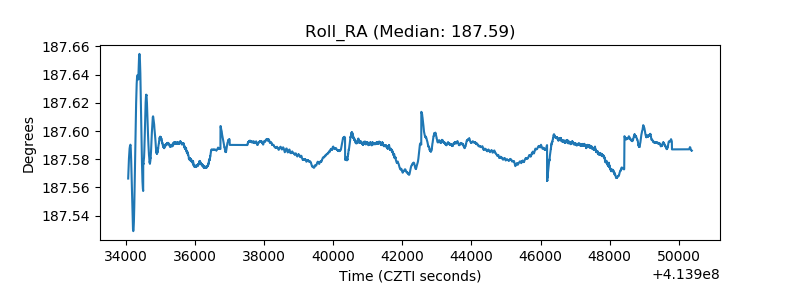 |
| Veto Counter | 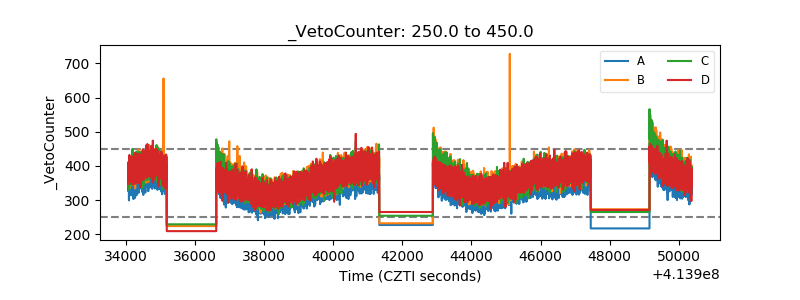 |