| Param | Original file | Final file |
|---|---|---|
| Filename | modeM0/AS1A12_037T07_9000005504_39893cztM0_level2.fits | modeM0/AS1A12_037T07_9000005504_39893cztM0_level2_quad_clean.evt |
| Size (bytes) | 952,626,240 | 263,903,040 |
| Size | 908.5 MB | 251.7 MB |
| Events in quadrant A | 8,572,947 | 1,776,152 |
| Events in quadrant B | 8,333,429 | 1,801,013 |
| Events in quadrant C | 7,645,399 | 1,739,046 |
| Events in quadrant D | 9,469,278 | 1,569,271 |
| Mode SS | |||
|---|---|---|---|
| Quadrant | BADHDUFLAG | Total packets | Discarded packets |
| A | 0 | 326 | 0 |
| B | 0 | 326 | 0 |
| C | 0 | 326 | 0 |
| D | 0 | 326 | 0 |
| Mode M0 | |||
|---|---|---|---|
| Quadrant | BADHDUFLAG | Total packets | Discarded packets |
| A | 0 | 35393 | 4 |
| B | 0 | 35571 | 3 |
| C | 0 | 32731 | 3 |
| D | 0 | 39491 | 3 |
| Mode M9 | |||
|---|---|---|---|
| Quadrant | BADHDUFLAG | Total packets | Discarded packets |
| A | 0 | 66 | 0 |
| B | 0 | 66 | 0 |
| C | 0 | 66 | 0 |
| D | 0 | 66 | 0 |
| Quadrant | Total seconds | Saturated seconds | Saturation percentage |
|---|---|---|---|
| A | 16029 | 42 | 0.262025% |
| B | 16029 | 325 | 2.027575% |
| C | 16029 | 19 | 0.118535% |
| D | 16029 | 426 | 2.657683% |
Noise dominated data is calculated using 1-second bins in cleaned event files. If a bin has >2000 counts, and if more than 50% of those come from <1% of pixels, then it is considered to be noise-dominated and hence unusable.
| Quadrant | # 1 sec bins | Bins with >0 counts | Bins with >2000 counts | High rate bins dominated by noise | Noise dominated (total time) | Noise dominated (detector-on time) | Marked lightcurve |
|---|---|---|---|---|---|---|---|
| A | 22541 | 16033 | 15 | 15 | 0.07% | 0.09% | 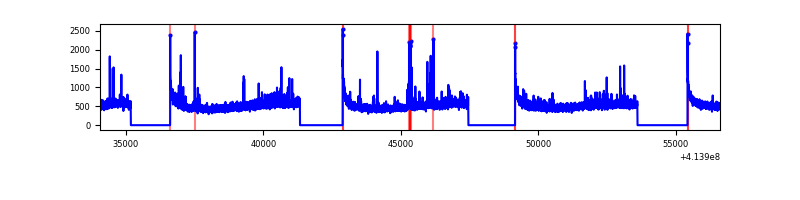 |
| B | 22541 | 16033 | 225 | 225 | 1.00% | 1.40% | 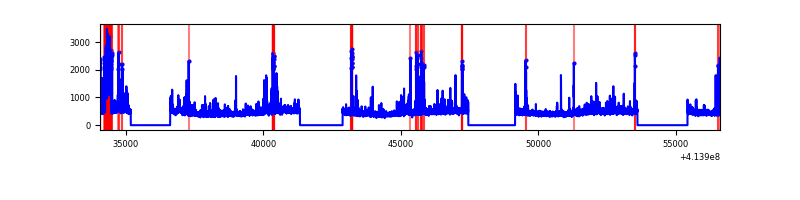 |
| C | 22541 | 16033 | 10 | 10 | 0.04% | 0.06% | 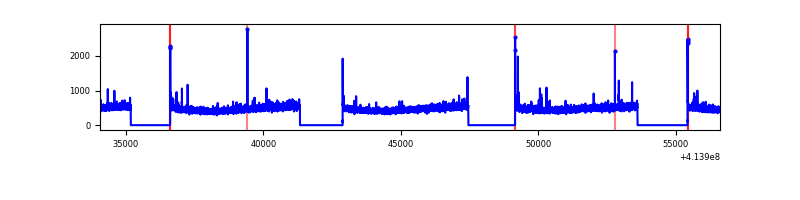 |
| D | 22541 | 16033 | 362 | 362 | 1.61% | 2.26% | 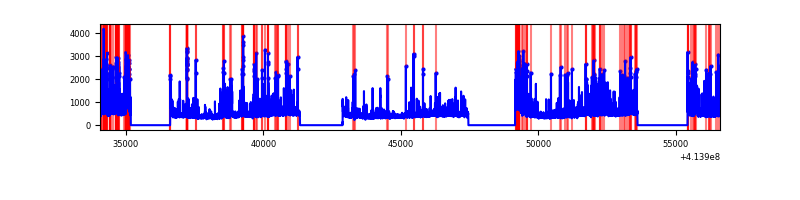 |
Top three noisy pixels from each quadrant. If the there are fewer than three noisy pixels in the level2.evt file, extra rows are filled as -1
| Pixel properties | Quadrant properties | ||||||
|---|---|---|---|---|---|---|---|
| Quadrant | DetID | PixID | Counts | Sigma | Mean | Median | Sigma |
| A | 10 | 83 | 1226491 | 3376.08 | 1799 | 1765 | 362.8 |
| A | 6 | 10 | 95831 | 259.3 | 1799 | 1765 | 362.8 |
| A | 15 | 223 | 83815 | 226.18 | 1799 | 1765 | 362.8 |
| B | 4 | 171 | 635465 | 1872.62 | 1763 | 1713 | 338.4 |
| B | 0 | 229 | 254547 | 747.08 | 1763 | 1713 | 338.4 |
| B | 0 | 183 | 131315 | 382.95 | 1763 | 1713 | 338.4 |
| C | 15 | 214 | 661164 | 1641.42 | 1743 | 1752 | 401.7 |
| C | 14 | 254 | 54654 | 131.68 | 1743 | 1752 | 401.7 |
| C | 0 | 10 | 40312 | 95.98 | 1743 | 1752 | 401.7 |
| D | 12 | 227 | 1464197 | 3431.13 | 1736 | 1686 | 426.2 |
| D | 5 | 32 | 214991 | 500.42 | 1736 | 1686 | 426.2 |
| D | 13 | 171 | 202894 | 472.04 | 1736 | 1686 | 426.2 |
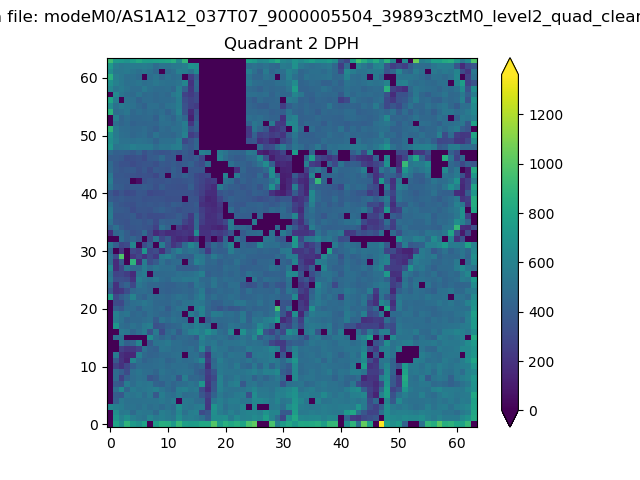
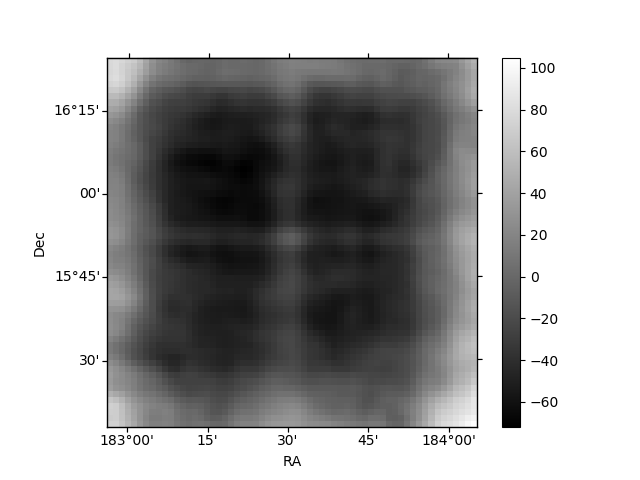
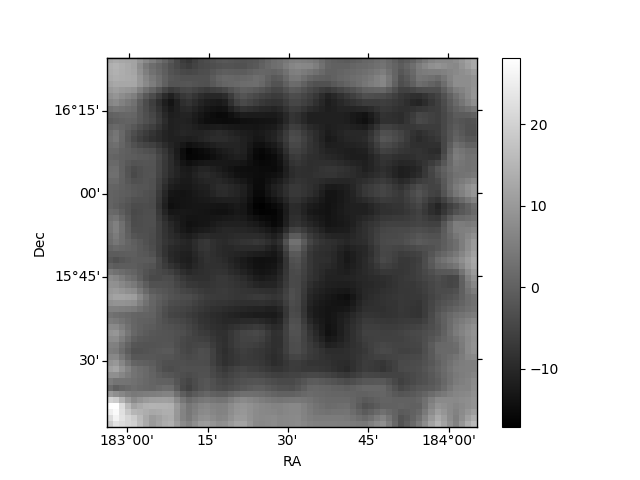
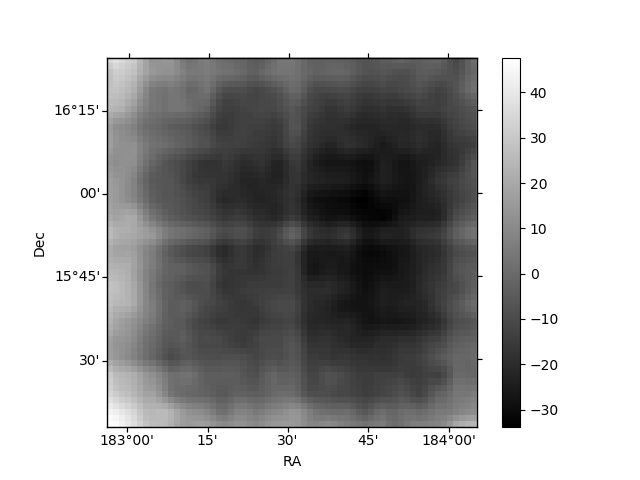
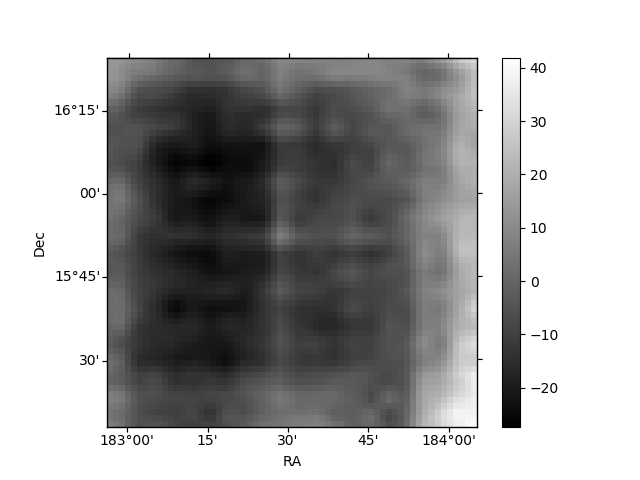
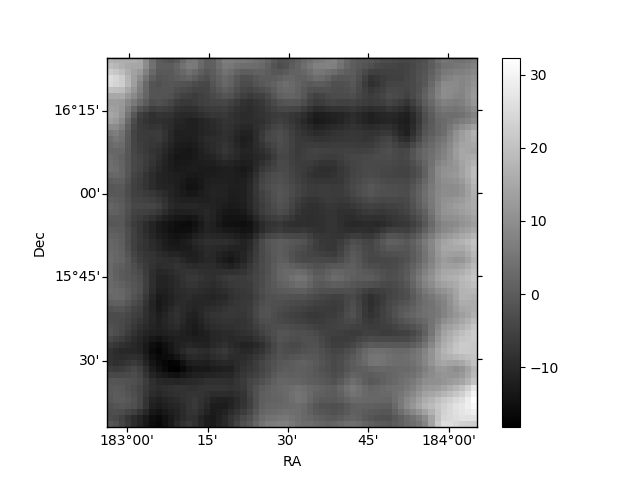
Histogram calculated using DETX and DETY for each event in the final _common_clean file
| Quadrant A | 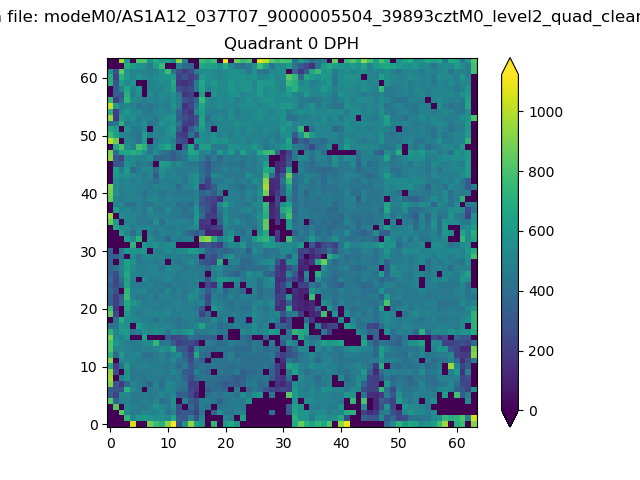 |
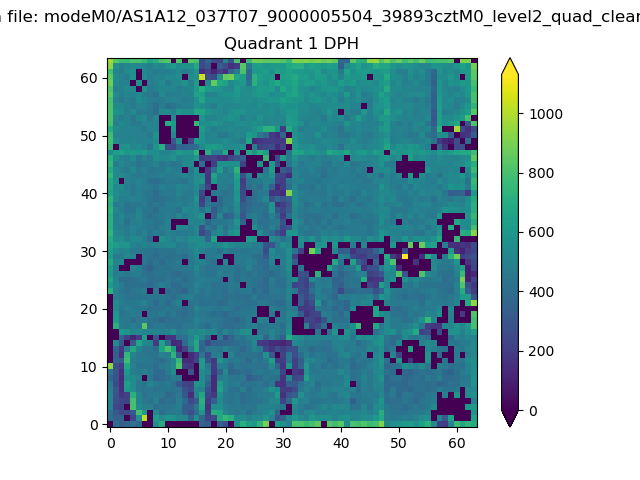 |
Quadrant B |
|---|---|---|---|
| Quadrant D | 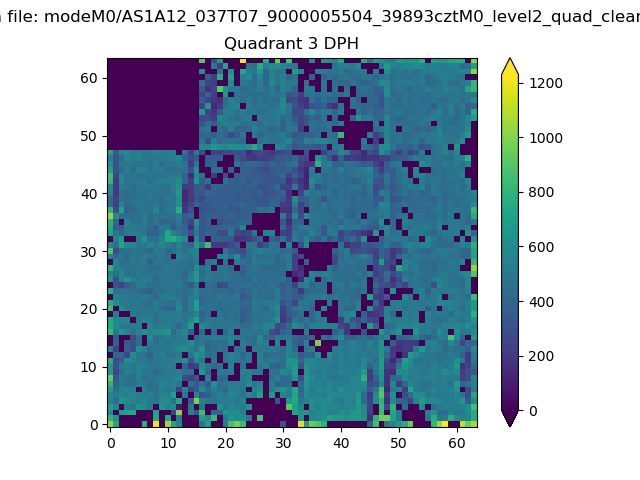 |
 |
Quadrant C |
| Plot type | Count rate plots | Images |
|---|---|---|
| Comparison with Poisson distribution Blue bars denote a histogram of data divided into 1 sec bins. Red curve is a Poisson curve with rate = median count rate of data. |
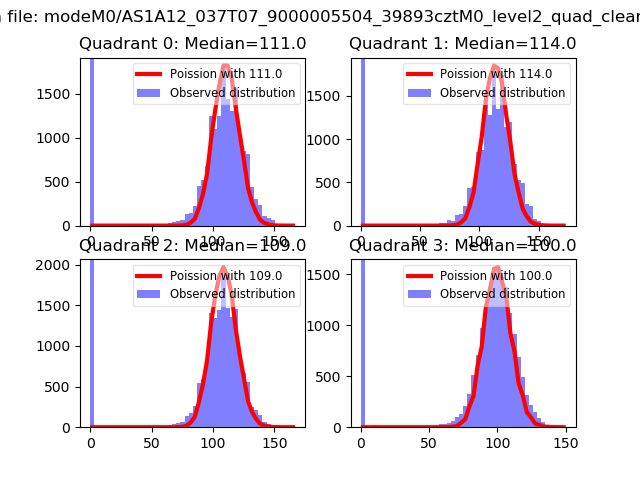 |
 |
| Quadrant-wise count rates Data is divided into 100 sec bins |
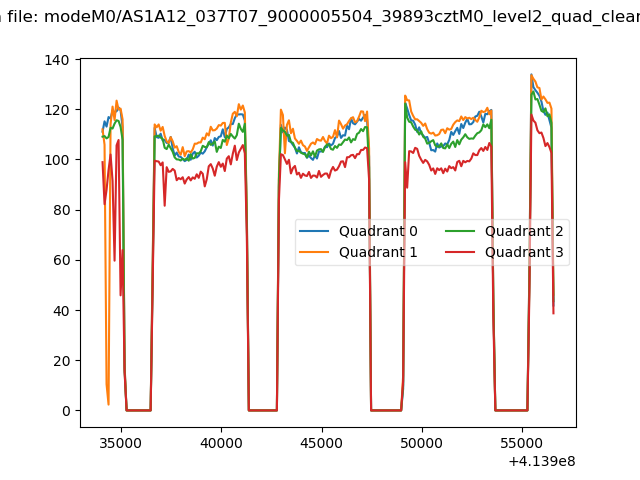 |
|
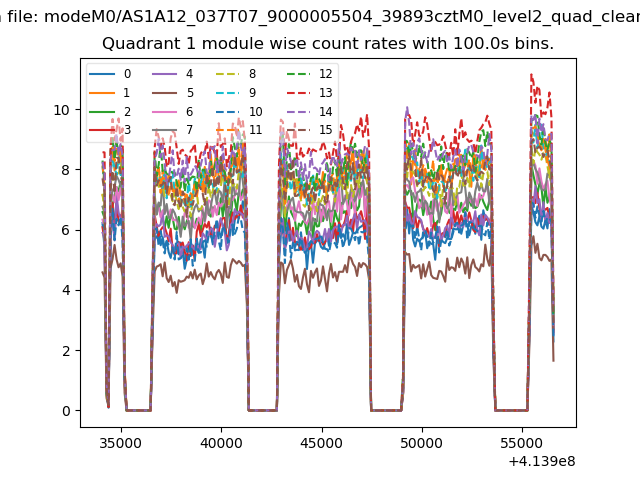
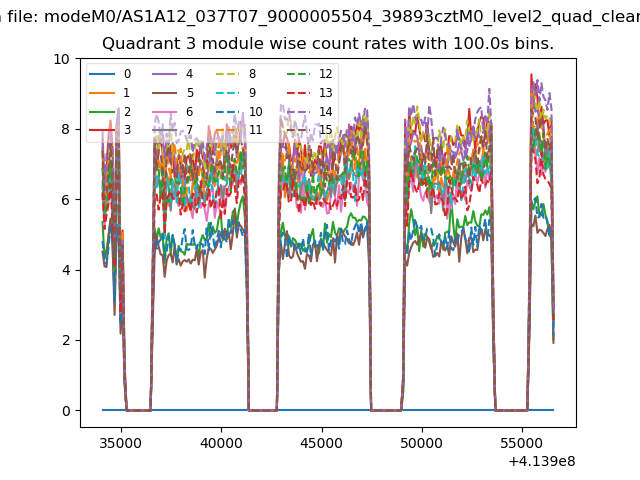
| Module-wise count rates for Quadrant A Data is divided into 100 sec bins |
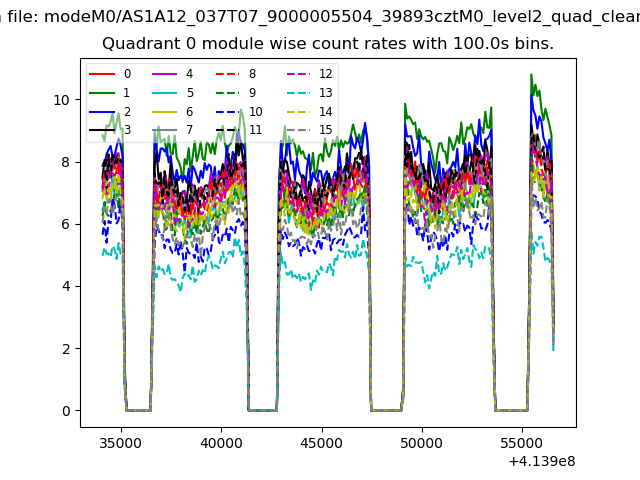 |
 |
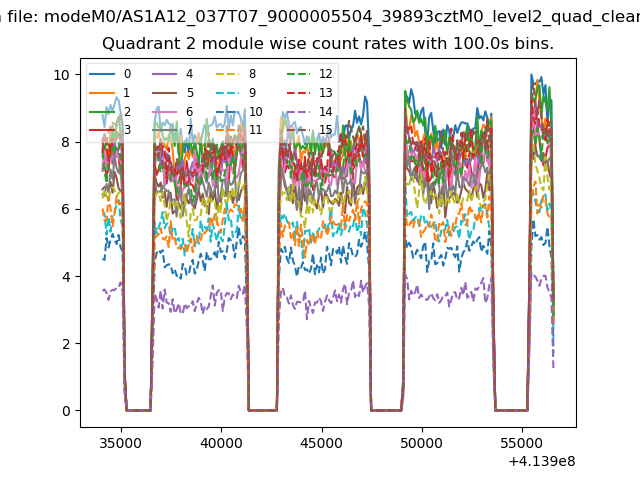
| Module-wise count rates for Quadrant B Data is divided into 100 sec bins |
 |
 |
| Module-wise count rates for Quadrant C Data is divided into 100 sec bins |
 |
 |
| Module-wise count rates for Quadrant D Data is divided into 100 sec bins |
 |
 |
| Parameter | Plot |
|---|---|
| CZT HV Monitor | 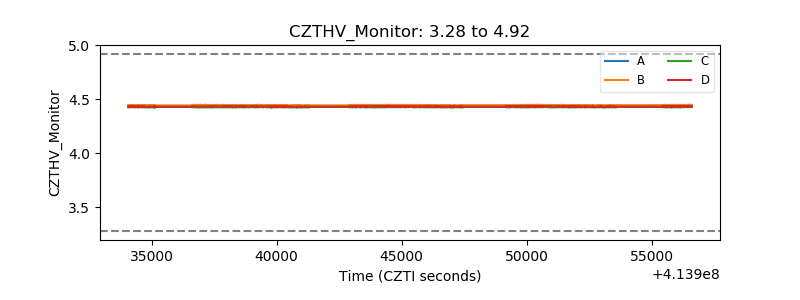 |
| D_VDD | 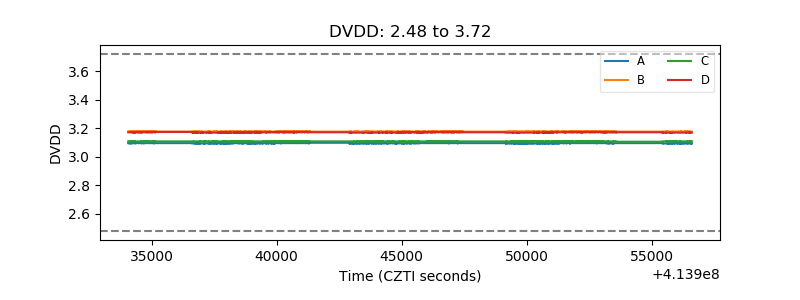 |
| Temperature 1 | 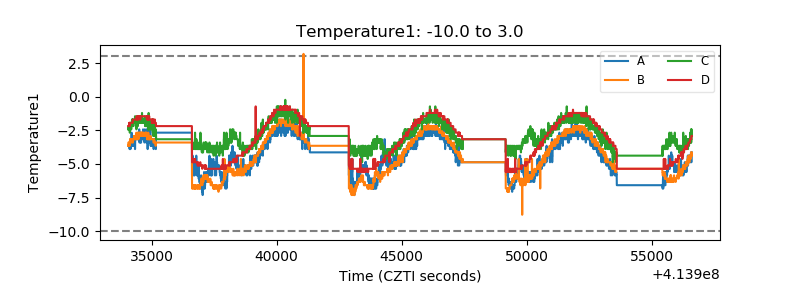 |
| Veto HV Monitor | 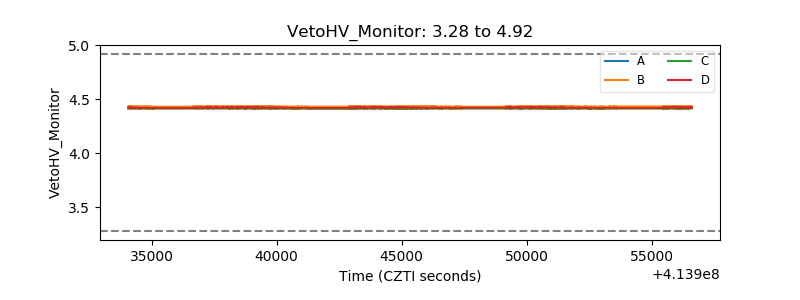 |
| Veto LLD | 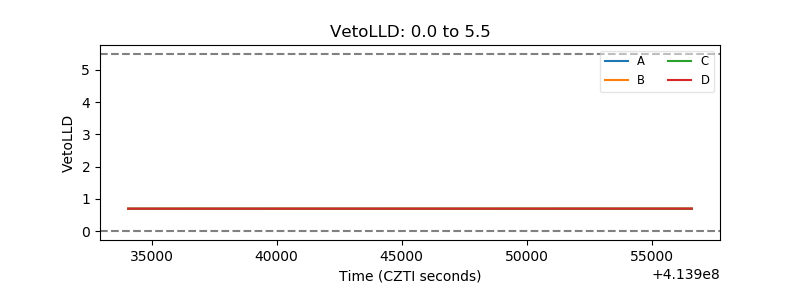 |
| Alpha Counter | 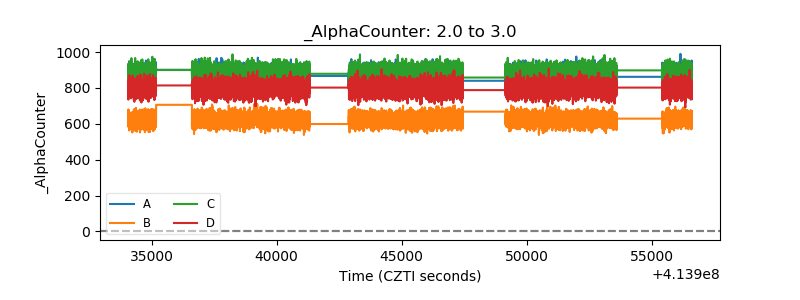 |
| _CPM_Rate | 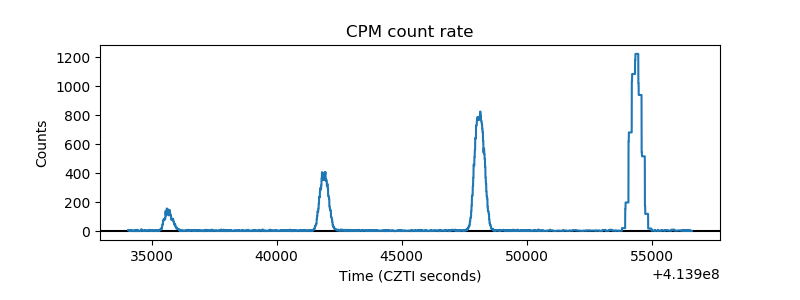 |
| CZT Counter | 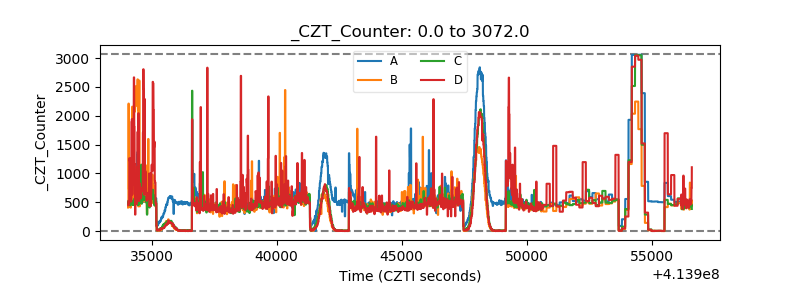 |
| +2.5 Volts monitor | 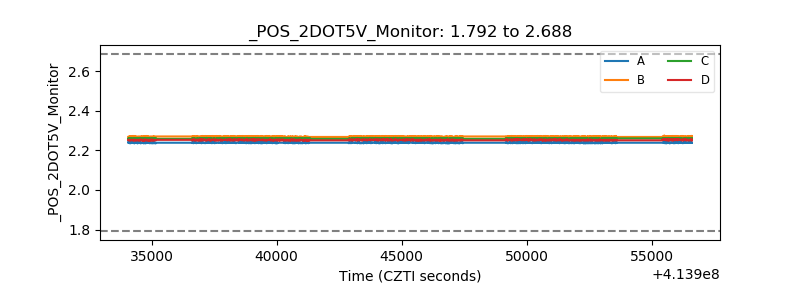 |
| +5 Volts monitor | 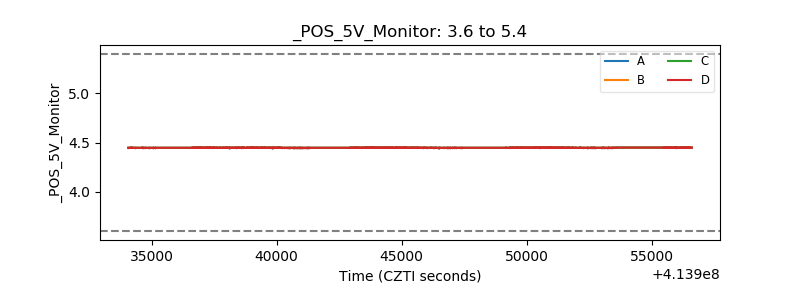 |
| _ROLL_ROT | 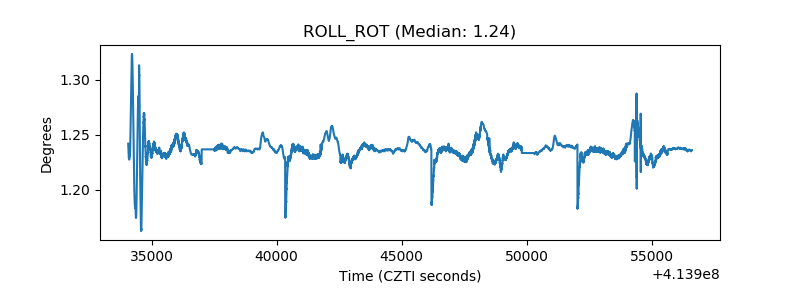 |
| _Roll_DEC | 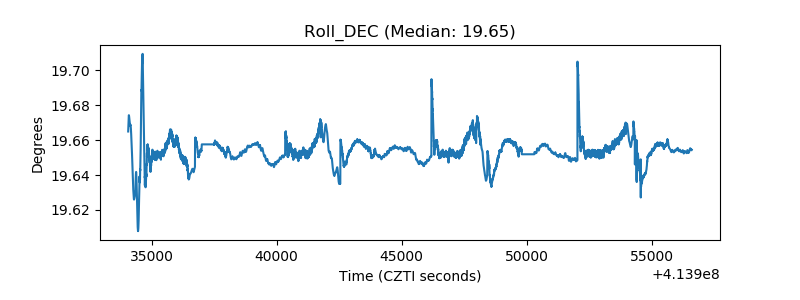 |
| _Roll_RA | 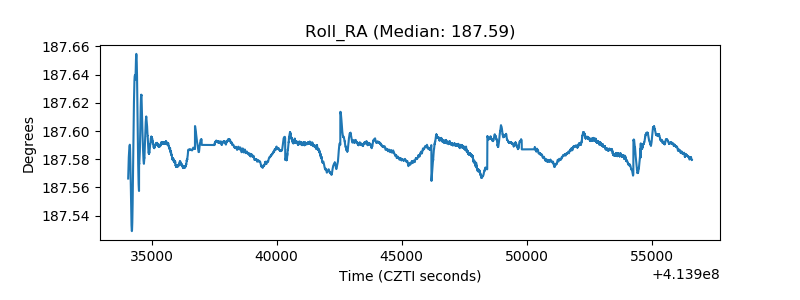 |
| Veto Counter | 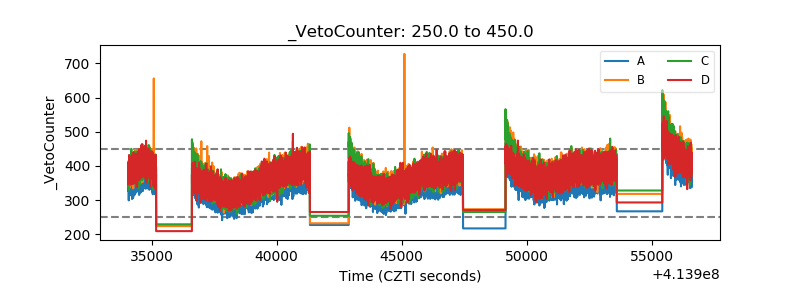 |