| Param | Original file | Final file |
|---|---|---|
| Filename | modeM0/AS1A12_037T07_9000005504_39894cztM0_level2.fits | modeM0/AS1A12_037T07_9000005504_39894cztM0_level2_quad_clean.evt |
| Size (bytes) | 272,721,600 | 79,182,720 |
| Size | 260.1 MB | 75.5 MB |
| Events in quadrant A | 2,491,109 | 539,290 |
| Events in quadrant B | 2,144,616 | 550,538 |
| Events in quadrant C | 2,168,493 | 523,417 |
| Events in quadrant D | 2,949,334 | 476,387 |
| Mode SS | |||
|---|---|---|---|
| Quadrant | BADHDUFLAG | Total packets | Discarded packets |
| A | 0 | 90 | 0 |
| B | 0 | 90 | 0 |
| C | 0 | 90 | 0 |
| D | 0 | 90 | 0 |
| Mode M0 | |||
|---|---|---|---|
| Quadrant | BADHDUFLAG | Total packets | Discarded packets |
| A | 0 | 9990 | 54 |
| B | 0 | 9162 | 56 |
| C | 0 | 8974 | 40 |
| D | 0 | 11688 | 119 |
| Mode M9 | |||
|---|---|---|---|
| Quadrant | BADHDUFLAG | Total packets | Discarded packets |
| A | 0 | 29 | 1 |
| B | 0 | 28 | 0 |
| C | 0 | 28 | 0 |
| D | 0 | 29 | 0 |
| Quadrant | Total seconds | Saturated seconds | Saturation percentage |
|---|---|---|---|
| A | 4378 | 9 | 0.205573% |
| B | 4376 | 22 | 0.502742% |
| C | 4383 | 7 | 0.159708% |
| D | 4377 | 122 | 2.787297% |
Noise dominated data is calculated using 1-second bins in cleaned event files. If a bin has >2000 counts, and if more than 50% of those come from <1% of pixels, then it is considered to be noise-dominated and hence unusable.
| Quadrant | # 1 sec bins | Bins with >0 counts | Bins with >2000 counts | High rate bins dominated by noise | Noise dominated (total time) | Noise dominated (detector-on time) | Marked lightcurve |
|---|---|---|---|---|---|---|---|
| A | 7248 | 4384 | 4 | 4 | 0.06% | 0.09% | 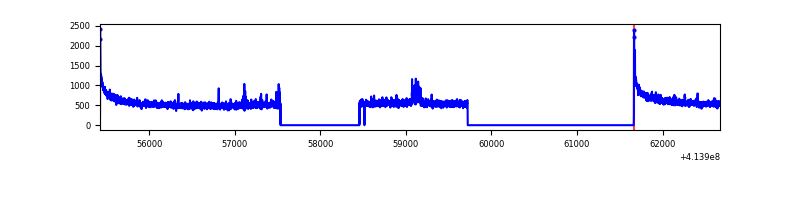 |
| B | 7248 | 4383 | 14 | 14 | 0.19% | 0.32% | 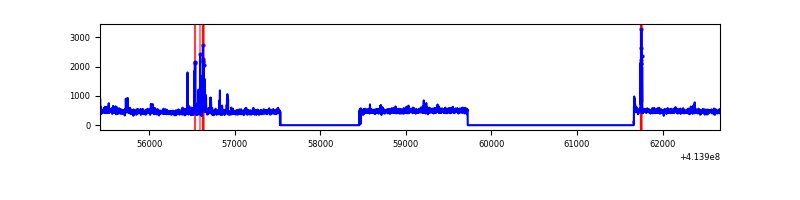 |
| C | 7248 | 4390 | 5 | 5 | 0.07% | 0.11% | 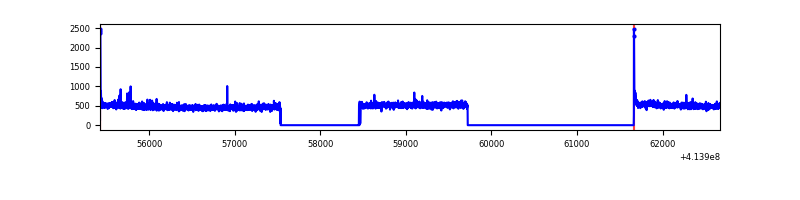 |
| D | 7248 | 4385 | 118 | 118 | 1.63% | 2.69% | 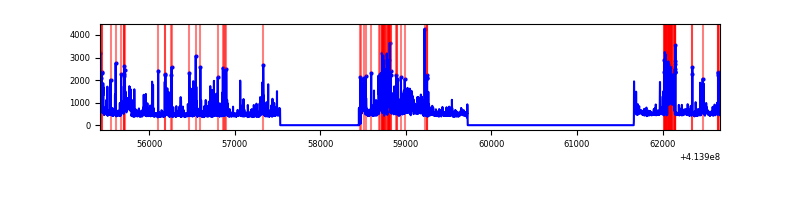 |
Top three noisy pixels from each quadrant. If the there are fewer than three noisy pixels in the level2.evt file, extra rows are filled as -1
| Pixel properties | Quadrant properties | ||||||
|---|---|---|---|---|---|---|---|
| Quadrant | DetID | PixID | Counts | Sigma | Mean | Median | Sigma |
| A | 10 | 83 | 413976 | 3898.42 | 518 | 508 | 106.1 |
| A | 6 | 10 | 25608 | 236.66 | 518 | 508 | 106.1 |
| A | 13 | 6 | 17030 | 155.78 | 518 | 508 | 106.1 |
| B | 4 | 171 | 74332 | 743.7 | 509 | 496 | 99.3 |
| B | 5 | 172 | 35126 | 348.81 | 509 | 496 | 99.3 |
| B | 0 | 230 | 16121 | 157.38 | 509 | 496 | 99.3 |
| C | 15 | 214 | 187110 | 1585.66 | 499 | 503 | 117.7 |
| C | 0 | 10 | 23297 | 193.69 | 499 | 503 | 117.7 |
| C | 14 | 254 | 6758 | 53.15 | 499 | 503 | 117.7 |
| D | 12 | 227 | 517389 | 4307.07 | 495 | 481 | 120.0 |
| D | 12 | 218 | 188641 | 1567.82 | 495 | 481 | 120.0 |
| D | 13 | 171 | 101789 | 844.14 | 495 | 481 | 120.0 |
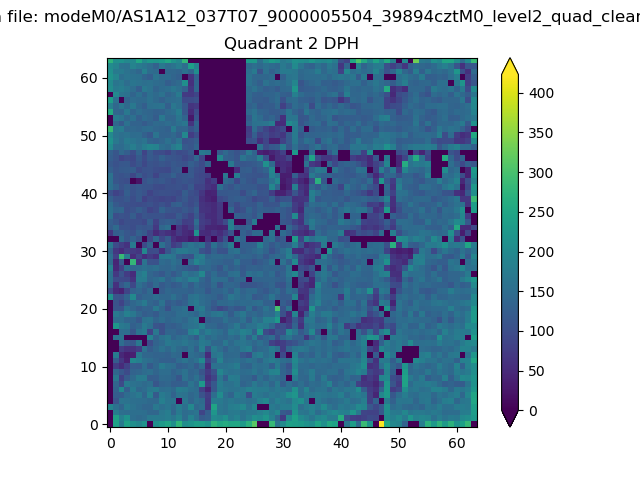
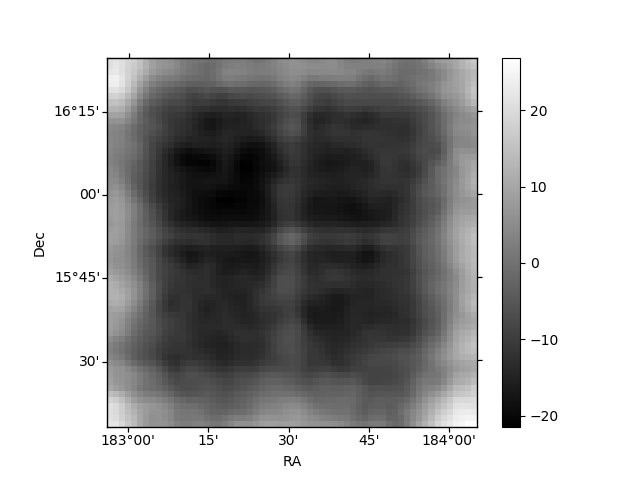
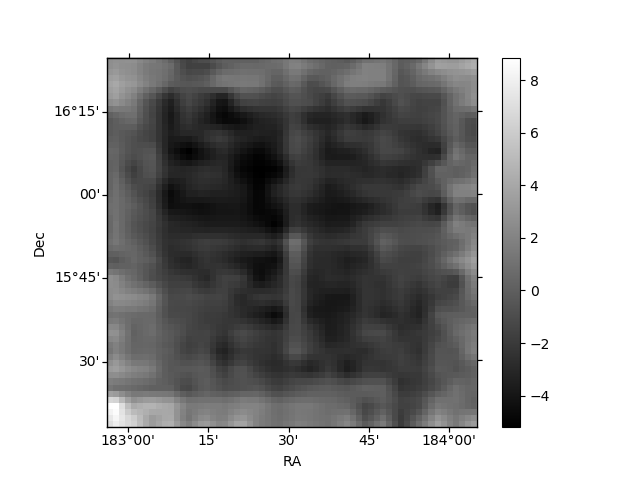
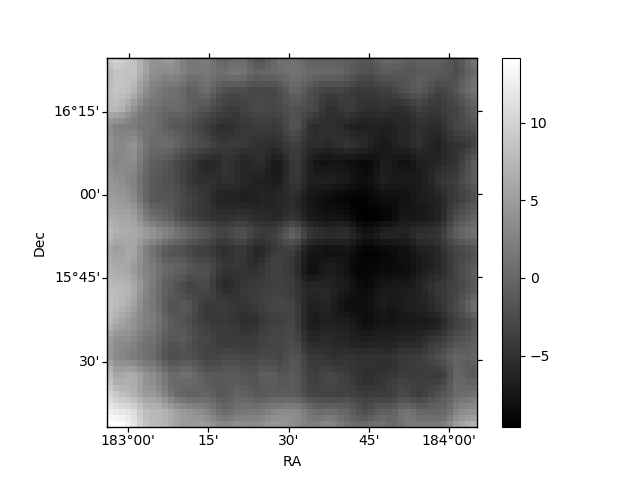
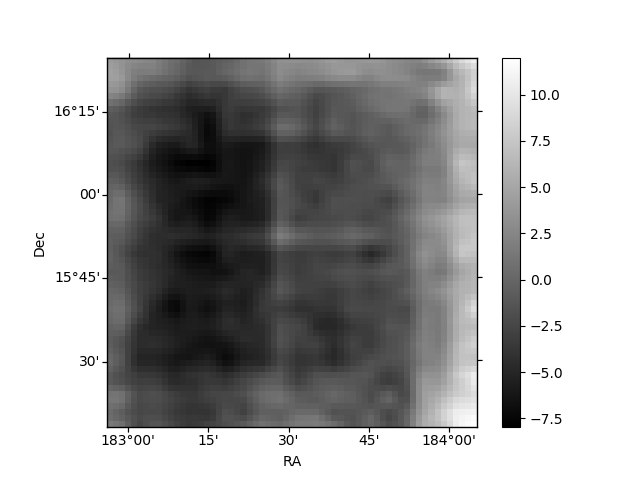
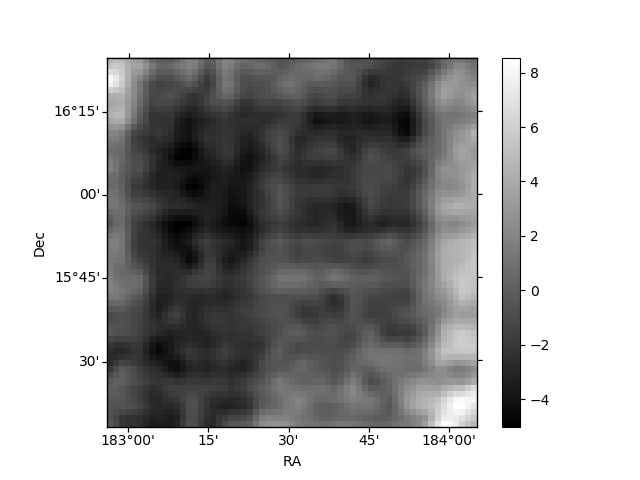
Histogram calculated using DETX and DETY for each event in the final _common_clean file
| Quadrant A | 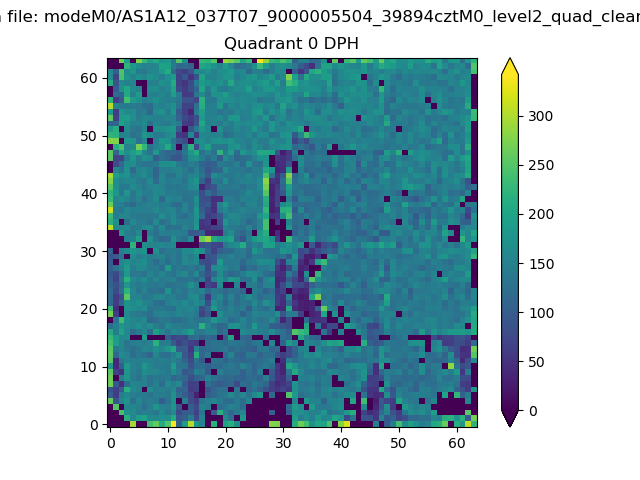 |
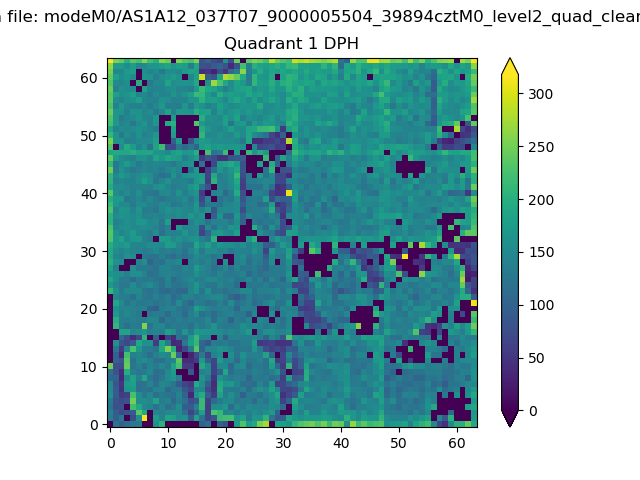 |
Quadrant B |
|---|---|---|---|
| Quadrant D | 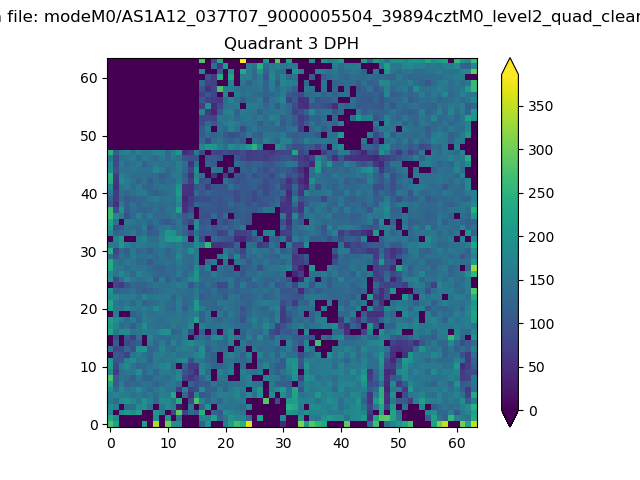 |
 |
Quadrant C |
| Plot type | Count rate plots | Images |
|---|---|---|
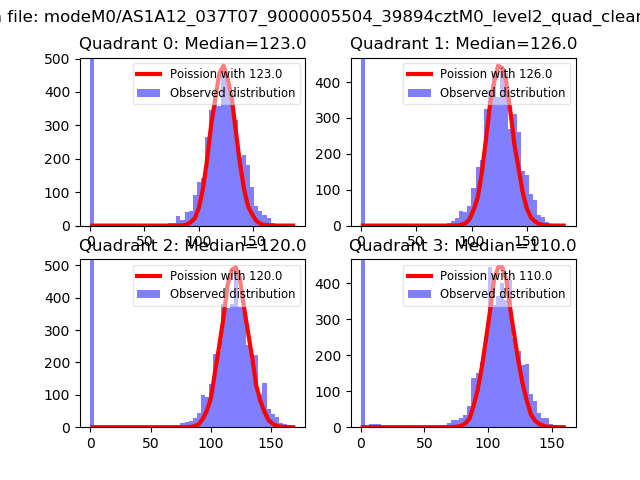
| Comparison with Poisson distribution Blue bars denote a histogram of data divided into 1 sec bins. Red curve is a Poisson curve with rate = median count rate of data. |
 |
 |
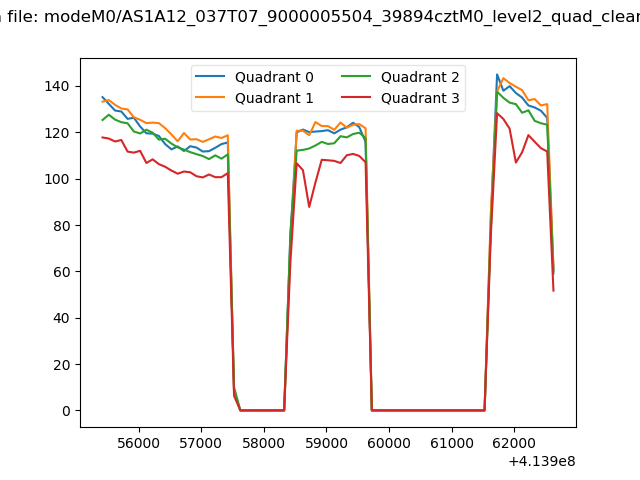
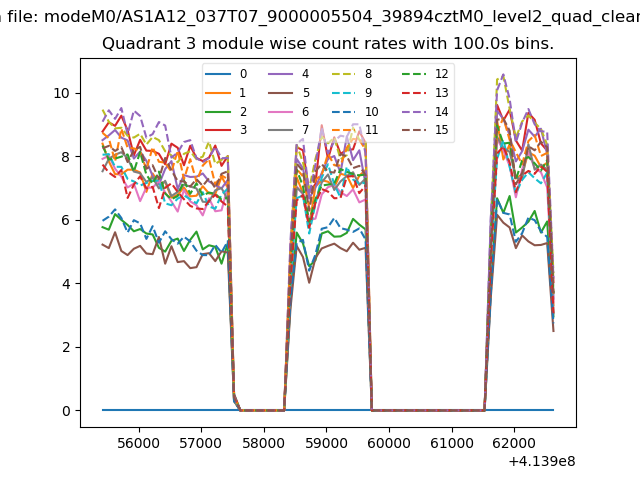
| Quadrant-wise count rates Data is divided into 100 sec bins |
 |
|
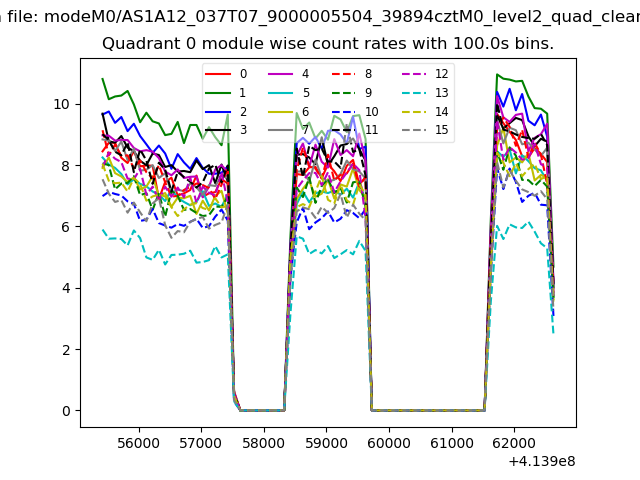
| Module-wise count rates for Quadrant A Data is divided into 100 sec bins |
 |
 |
| Module-wise count rates for Quadrant B Data is divided into 100 sec bins |
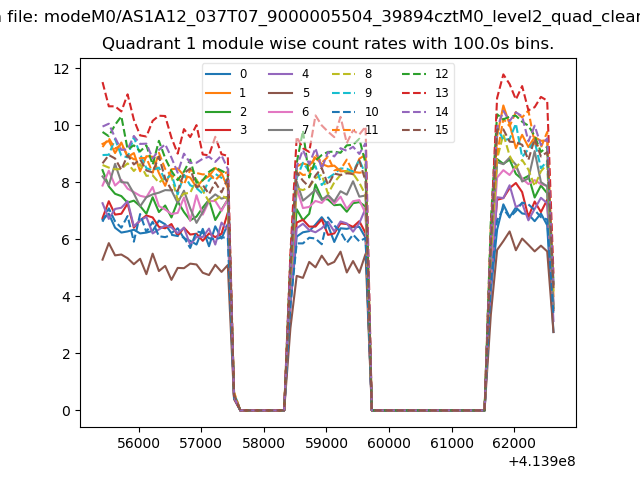 |
 |
| Module-wise count rates for Quadrant C Data is divided into 100 sec bins |
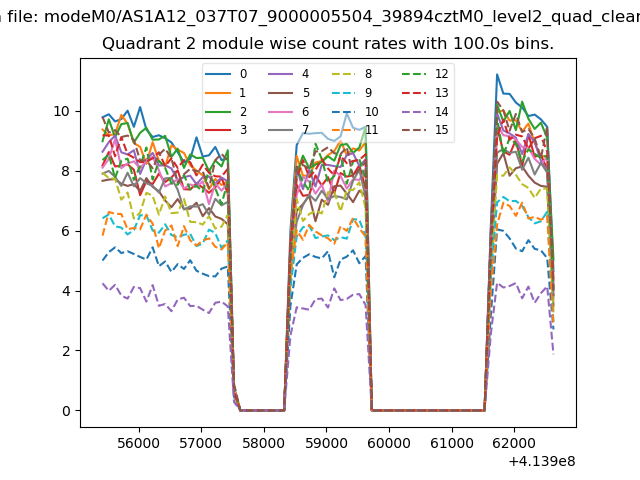 |
 |
| Module-wise count rates for Quadrant D Data is divided into 100 sec bins |
 |
 |
| Parameter | Plot |
|---|---|
| CZT HV Monitor | 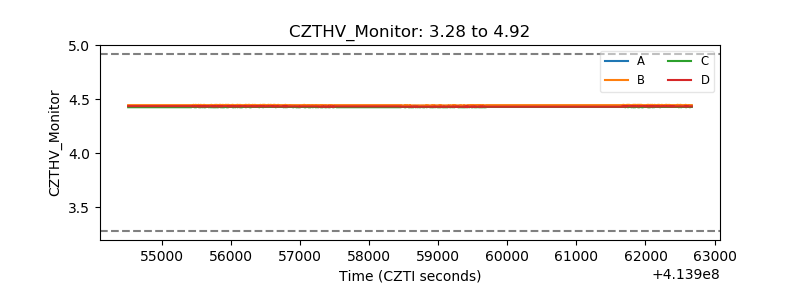 |
| D_VDD | 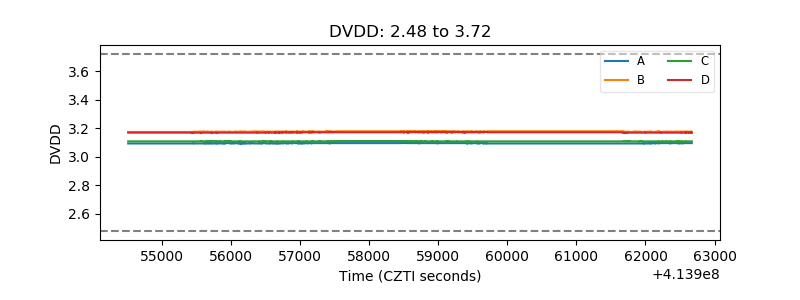 |
| Temperature 1 | 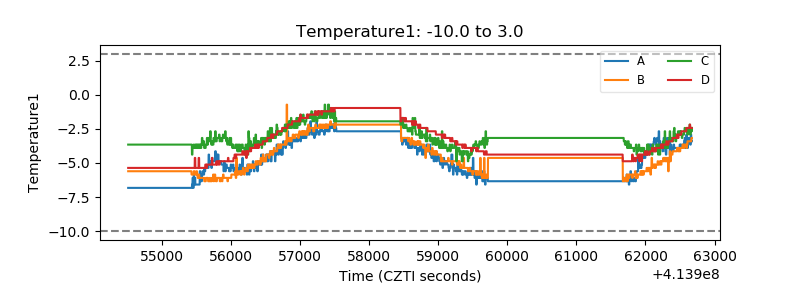 |
| Veto HV Monitor | 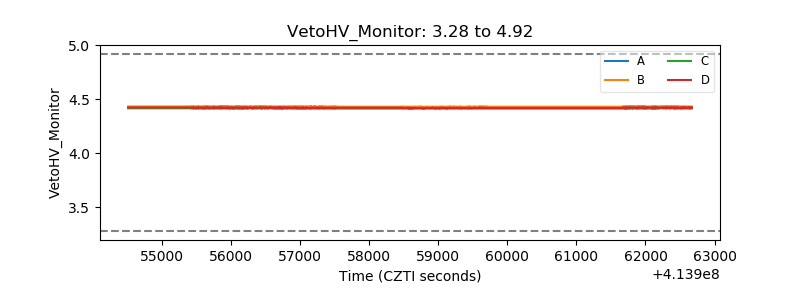 |
| Veto LLD | 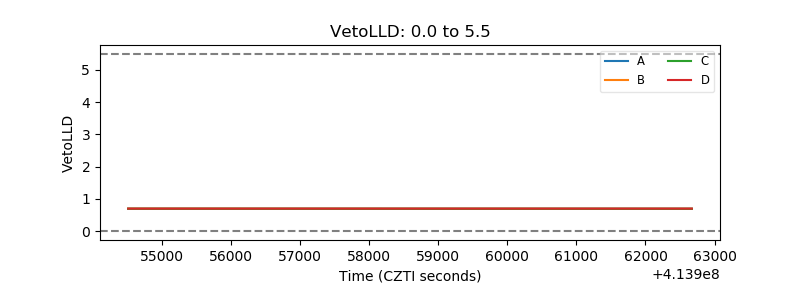 |
| Alpha Counter | 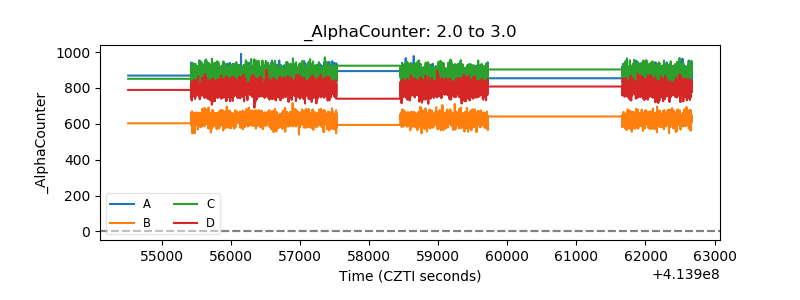 |
| _CPM_Rate | 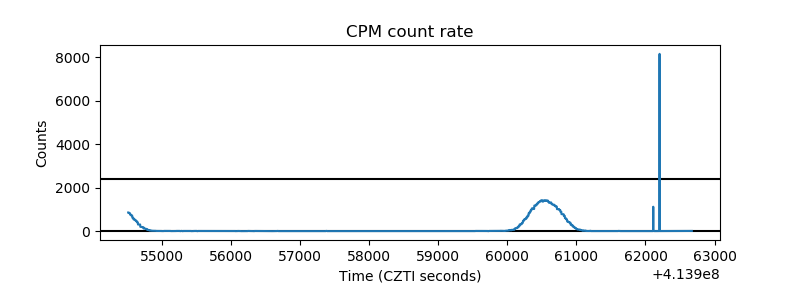 |
| CZT Counter | 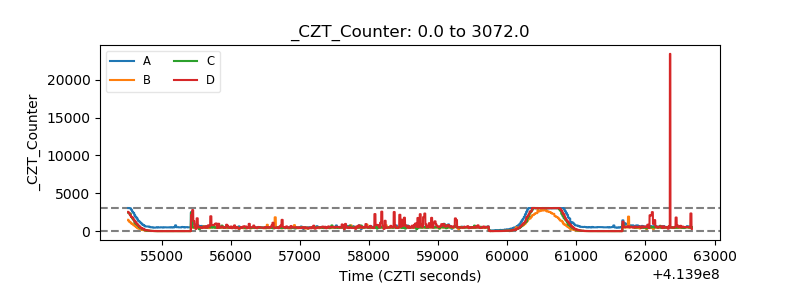 |
| +2.5 Volts monitor | 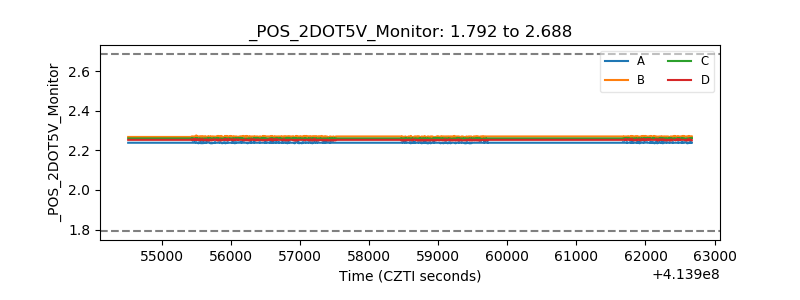 |
| +5 Volts monitor | 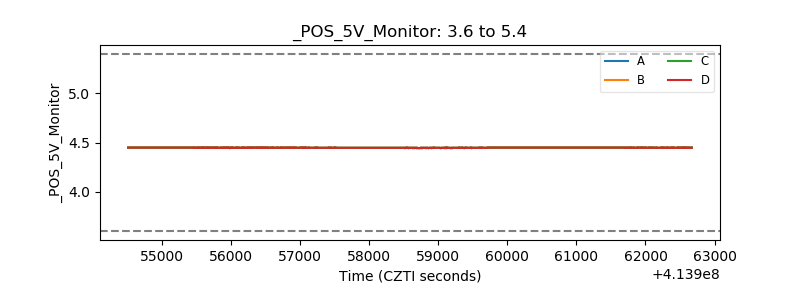 |
| _ROLL_ROT | 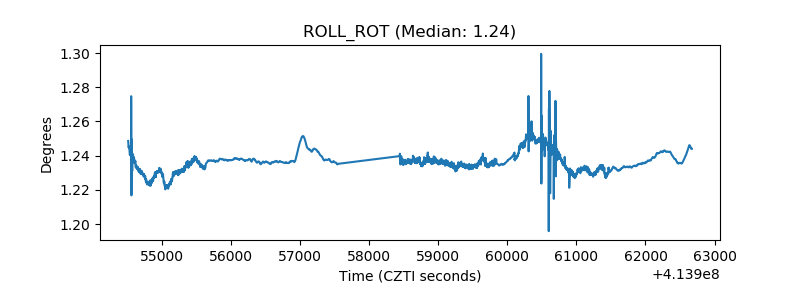 |
| _Roll_DEC | 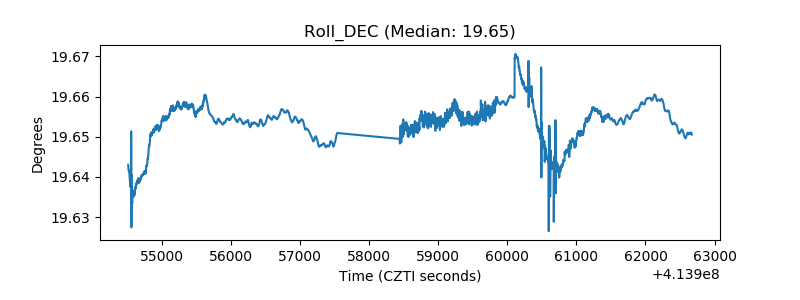 |
| _Roll_RA | 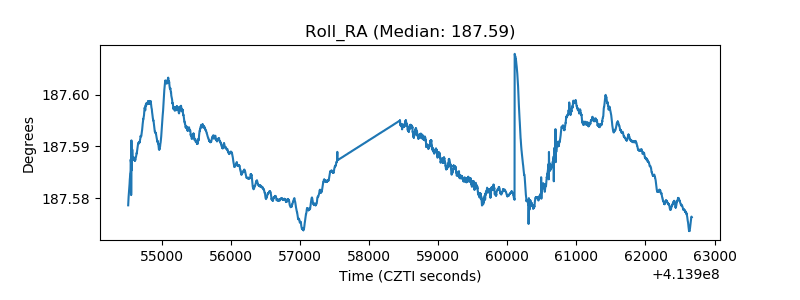 |
| Veto Counter | 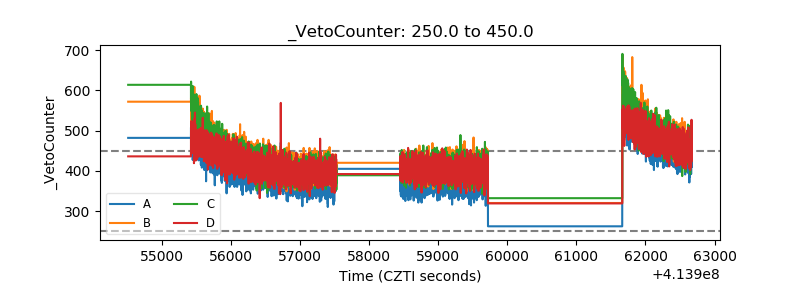 |