| Param | Original file | Final file |
|---|---|---|
| Filename | modeM0/AS1A12_037T07_9000005504_39896cztM0_level2.fits | modeM0/AS1A12_037T07_9000005504_39896cztM0_level2_quad_clean.evt |
| Size (bytes) | 295,894,080 | 88,462,080 |
| Size | 282.2 MB | 84.4 MB |
| Events in quadrant A | 2,792,730 | 608,818 |
| Events in quadrant B | 2,503,270 | 617,517 |
| Events in quadrant C | 2,573,886 | 577,829 |
| Events in quadrant D | 2,709,912 | 538,675 |
| Mode SS | |||
|---|---|---|---|
| Quadrant | BADHDUFLAG | Total packets | Discarded packets |
| A | 0 | 98 | 0 |
| B | 0 | 98 | 0 |
| C | 0 | 98 | 0 |
| D | 0 | 98 | 0 |
| Mode M0 | |||
|---|---|---|---|
| Quadrant | BADHDUFLAG | Total packets | Discarded packets |
| A | 0 | 11077 | 3 |
| B | 0 | 10187 | 2 |
| C | 0 | 10298 | 2 |
| D | 0 | 11012 | 2 |
| Mode M9 | |||
|---|---|---|---|
| Quadrant | BADHDUFLAG | Total packets | Discarded packets |
| A | 0 | 27 | 0 |
| B | 0 | 27 | 0 |
| C | 0 | 27 | 0 |
| D | 0 | 28 | 0 |
| Quadrant | Total seconds | Saturated seconds | Saturation percentage |
|---|---|---|---|
| A | 4788 | 15 | 0.313283% |
| B | 4788 | 11 | 0.229741% |
| C | 4788 | 18 | 0.375940% |
| D | 4788 | 47 | 0.981621% |
Noise dominated data is calculated using 1-second bins in cleaned event files. If a bin has >2000 counts, and if more than 50% of those come from <1% of pixels, then it is considered to be noise-dominated and hence unusable.
| Quadrant | # 1 sec bins | Bins with >0 counts | Bins with >2000 counts | High rate bins dominated by noise | Noise dominated (total time) | Noise dominated (detector-on time) | Marked lightcurve |
|---|---|---|---|---|---|---|---|
| A | 6912 | 4789 | 8 | 8 | 0.12% | 0.17% | 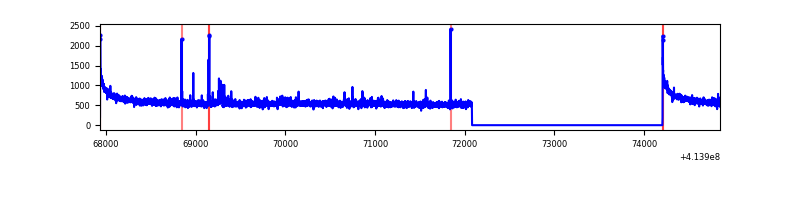 |
| B | 6912 | 4789 | 3 | 3 | 0.04% | 0.06% | 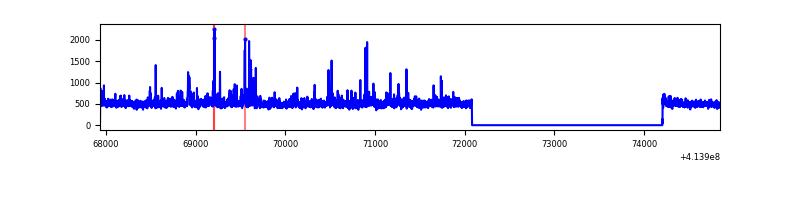 |
| C | 6912 | 4789 | 13 | 13 | 0.19% | 0.27% | 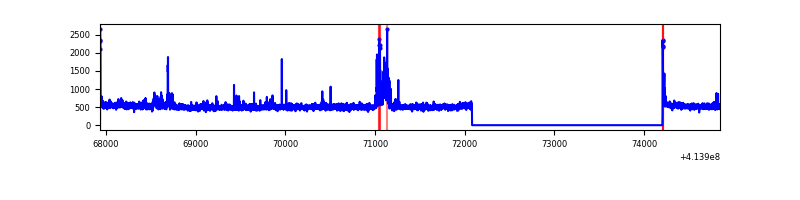 |
| D | 6912 | 4789 | 40 | 40 | 0.58% | 0.84% | 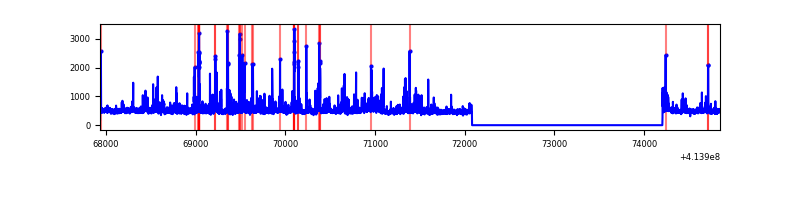 |
Top three noisy pixels from each quadrant. If the there are fewer than three noisy pixels in the level2.evt file, extra rows are filled as -1
| Pixel properties | Quadrant properties | ||||||
|---|---|---|---|---|---|---|---|
| Quadrant | DetID | PixID | Counts | Sigma | Mean | Median | Sigma |
| A | 10 | 83 | 440441 | 3745.02 | 585 | 574 | 117.5 |
| A | 13 | 248 | 23194 | 192.59 | 585 | 574 | 117.5 |
| A | 6 | 10 | 21762 | 180.39 | 585 | 574 | 117.5 |
| B | 0 | 230 | 85725 | 765.32 | 575 | 561 | 111.3 |
| B | 0 | 229 | 42645 | 378.19 | 575 | 561 | 111.3 |
| B | 5 | 255 | 28274 | 249.04 | 575 | 561 | 111.3 |
| C | 15 | 214 | 204070 | 1548.11 | 561 | 565 | 131.5 |
| C | 14 | 254 | 135312 | 1025.05 | 561 | 565 | 131.5 |
| C | 0 | 10 | 29876 | 222.98 | 561 | 565 | 131.5 |
| D | 13 | 249 | 140174 | 992.99 | 569 | 553 | 140.6 |
| D | 2 | 249 | 127543 | 903.15 | 569 | 553 | 140.6 |
| D | 12 | 227 | 89007 | 629.09 | 569 | 553 | 140.6 |
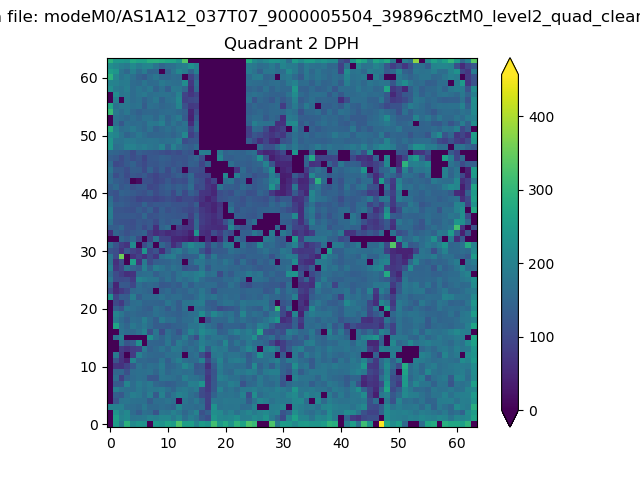
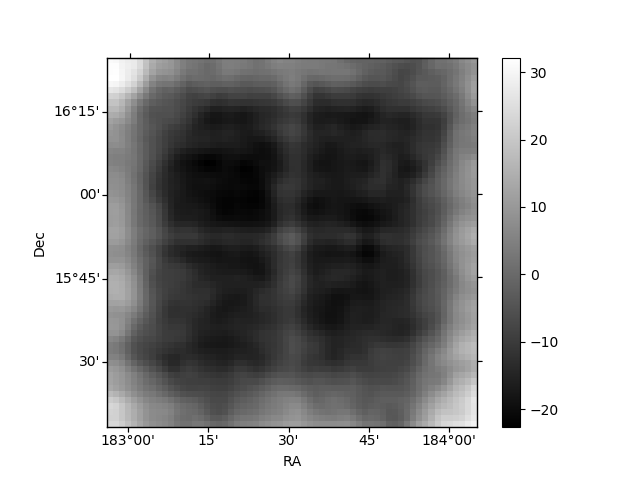
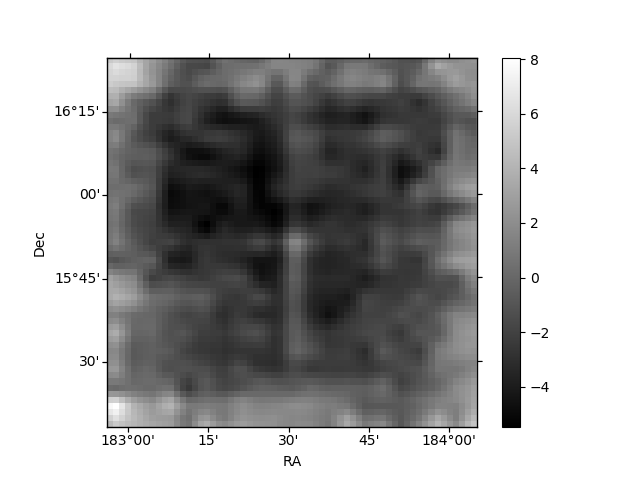
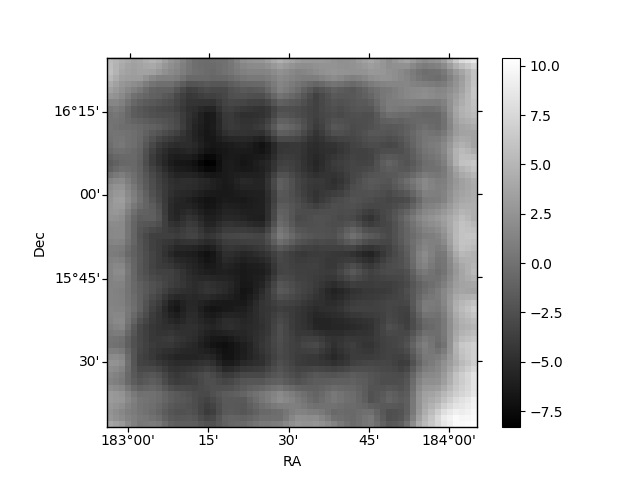
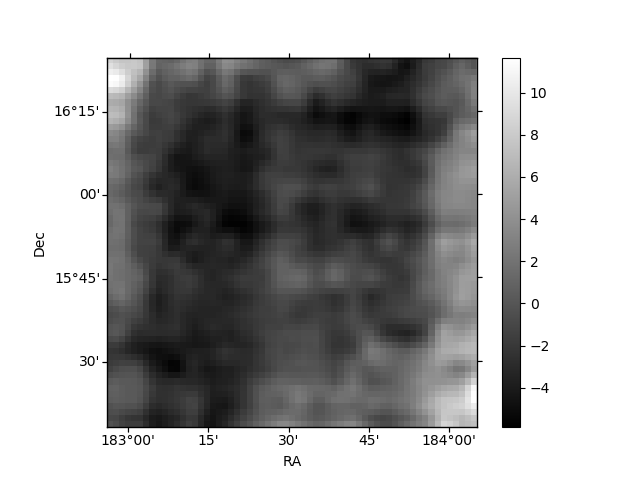
Histogram calculated using DETX and DETY for each event in the final _common_clean file
| Quadrant A | 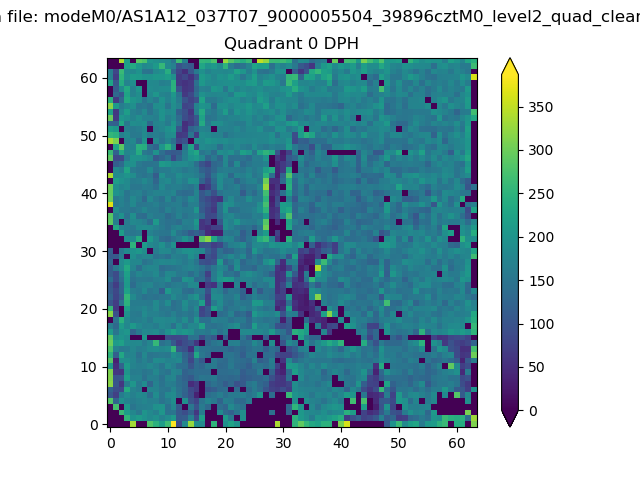 |
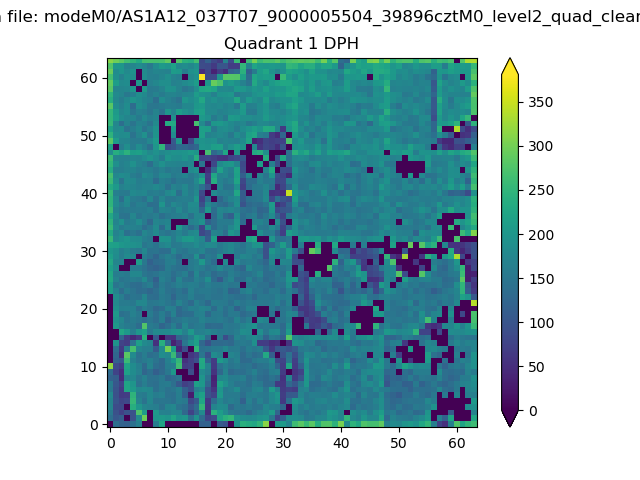 |
Quadrant B |
|---|---|---|---|
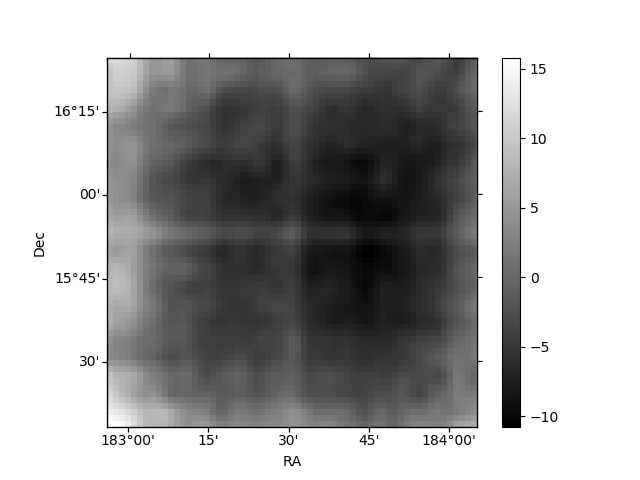
| Quadrant D | 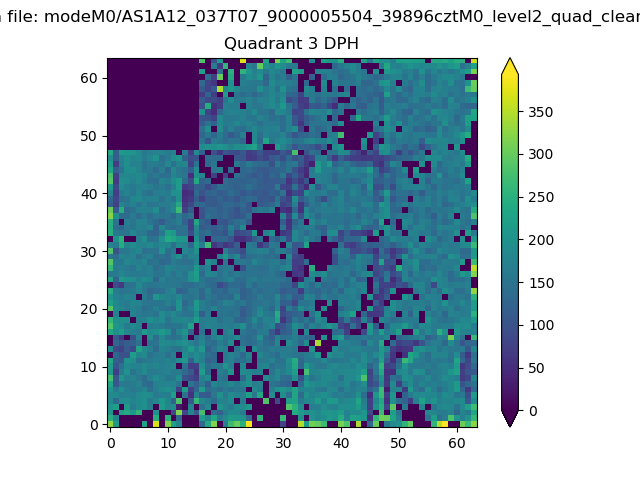 |
 |
Quadrant C |
| Plot type | Count rate plots | Images |
|---|---|---|
| Comparison with Poisson distribution Blue bars denote a histogram of data divided into 1 sec bins. Red curve is a Poisson curve with rate = median count rate of data. |
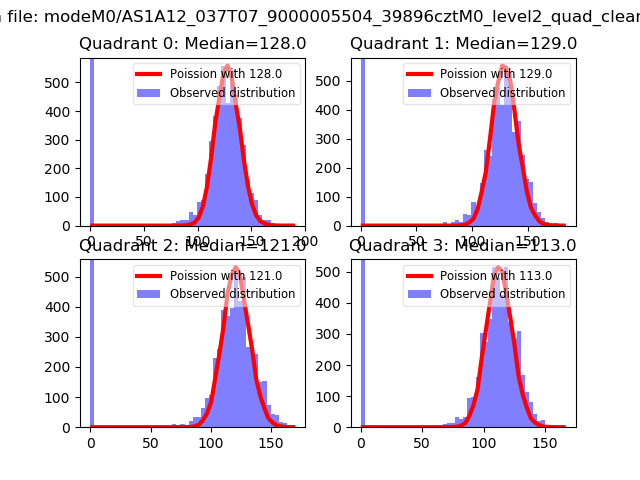 |
 |
| Quadrant-wise count rates Data is divided into 100 sec bins |
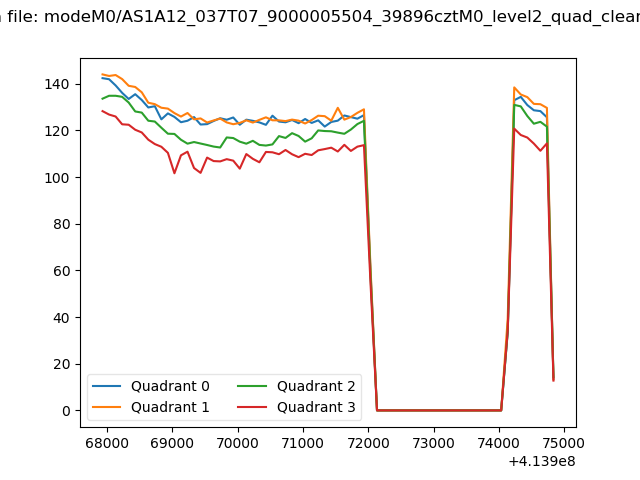 |
|
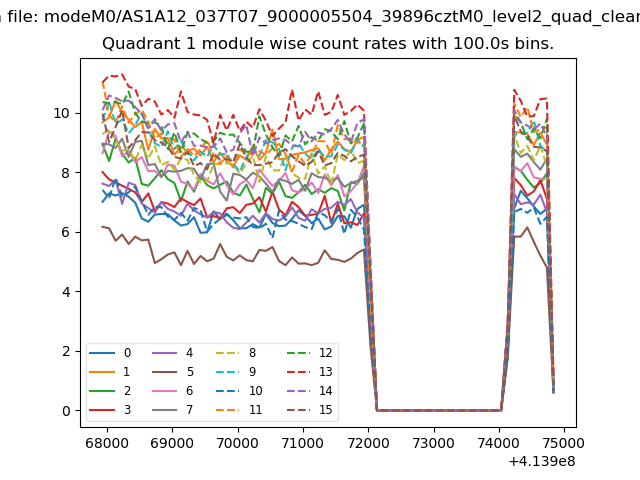
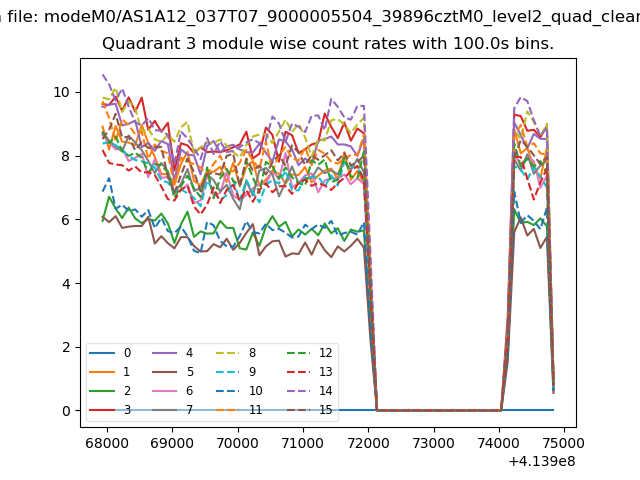
| Module-wise count rates for Quadrant A Data is divided into 100 sec bins |
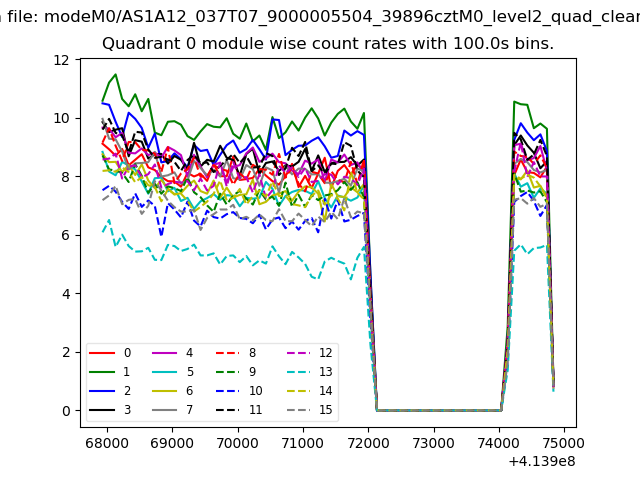 |
 |
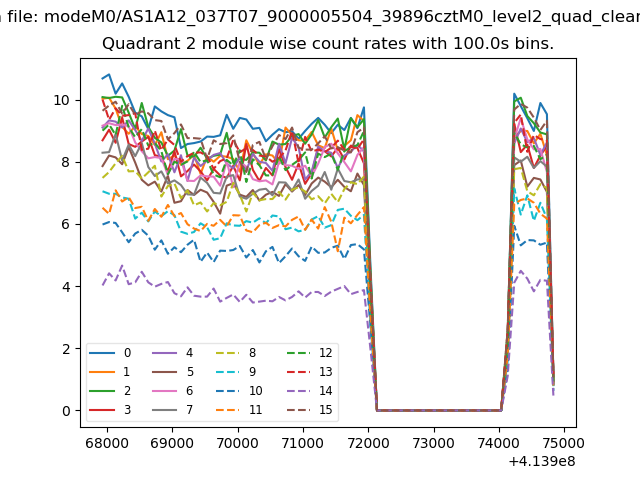
| Module-wise count rates for Quadrant B Data is divided into 100 sec bins |
 |
 |
| Module-wise count rates for Quadrant C Data is divided into 100 sec bins |
 |
 |
| Module-wise count rates for Quadrant D Data is divided into 100 sec bins |
 |
 |
| Parameter | Plot |
|---|---|
| CZT HV Monitor | 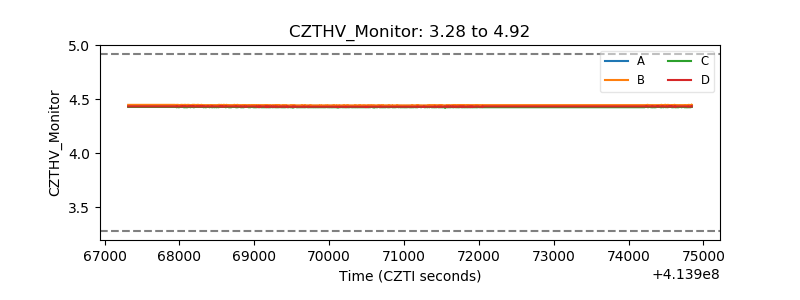 |
| D_VDD | 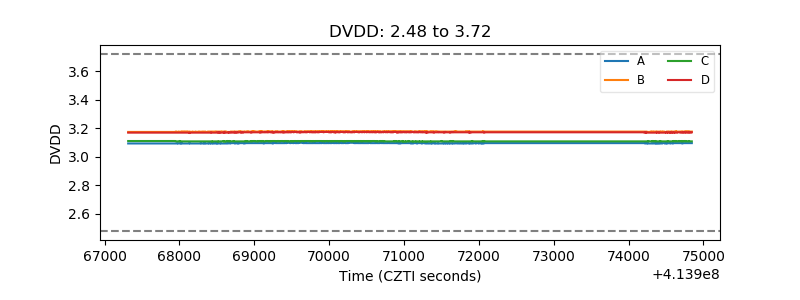 |
| Temperature 1 | 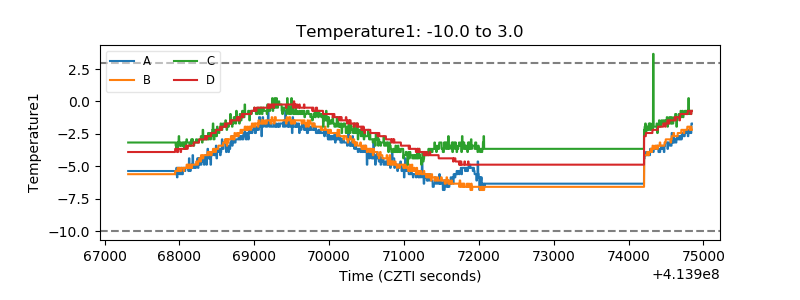 |
| Veto HV Monitor | 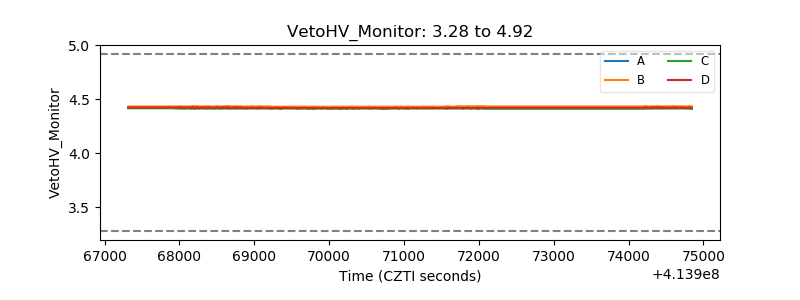 |
| Veto LLD | 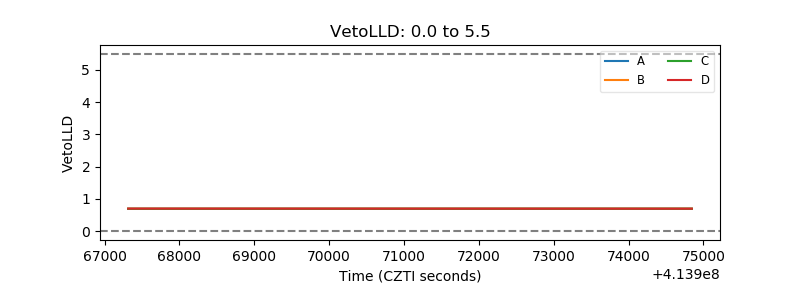 |
| Alpha Counter | 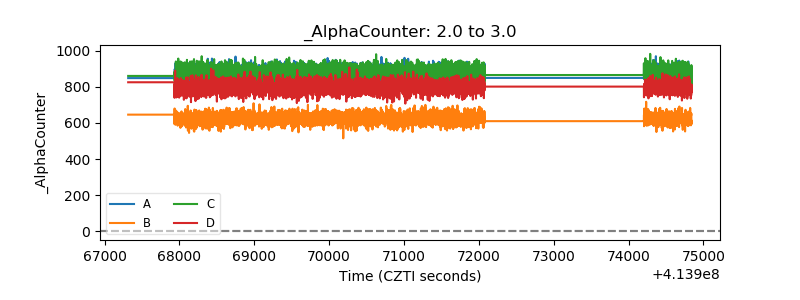 |
| _CPM_Rate | 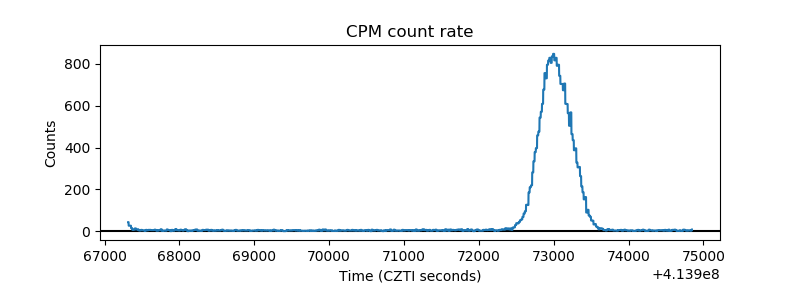 |
| CZT Counter | 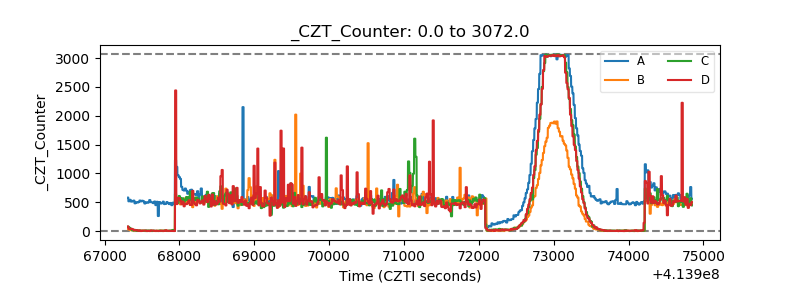 |
| +2.5 Volts monitor |  |
| +5 Volts monitor | 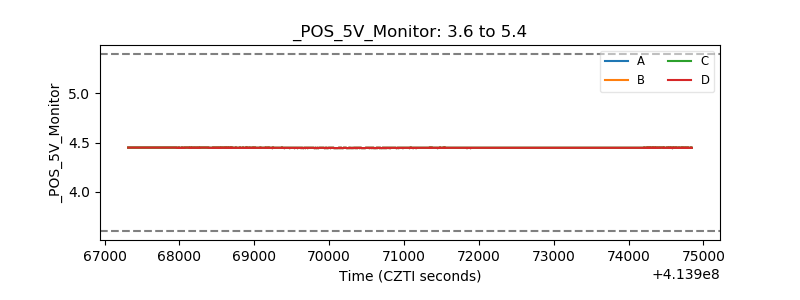 |
| _ROLL_ROT | 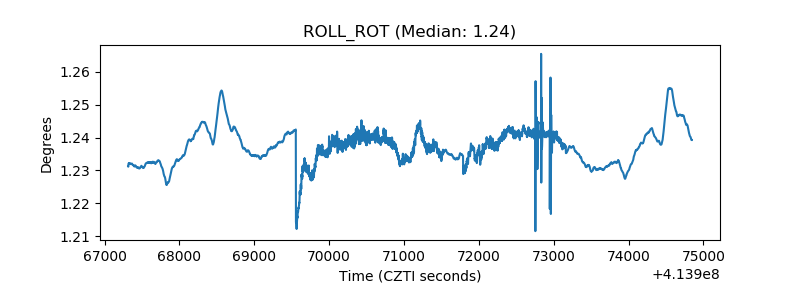 |
| _Roll_DEC | 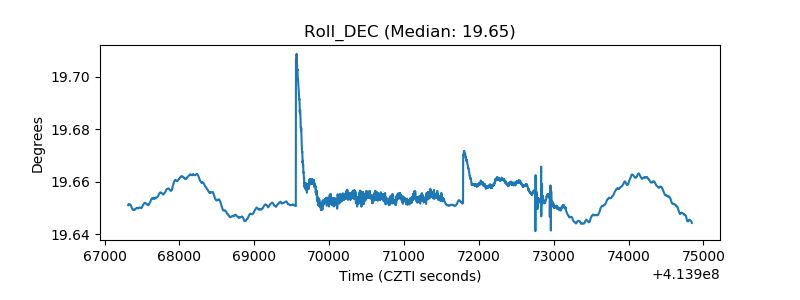 |
| _Roll_RA | 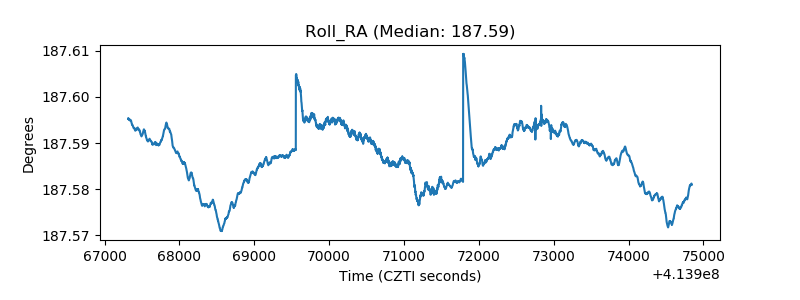 |
| Veto Counter | 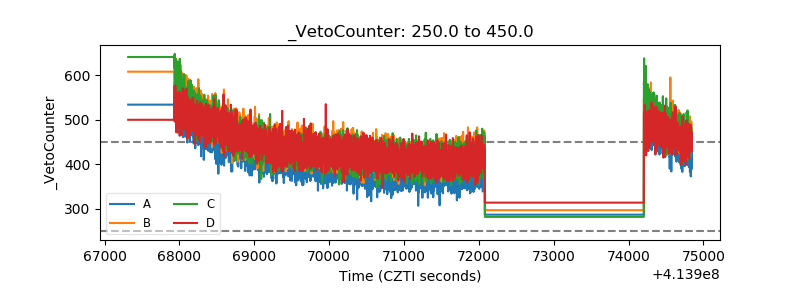 |