| Param | Original file | Final file |
|---|---|---|
| Filename | modeM0/AS1A12_037T07_9000005504_39897cztM0_level2.fits | modeM0/AS1A12_037T07_9000005504_39897cztM0_level2_quad_clean.evt |
| Size (bytes) | 346,893,120 | 91,932,480 |
| Size | 330.8 MB | 87.7 MB |
| Events in quadrant A | 3,511,429 | 622,196 |
| Events in quadrant B | 2,738,995 | 642,654 |
| Events in quadrant C | 2,753,366 | 601,124 |
| Events in quadrant D | 3,430,884 | 552,049 |
| Mode SS | |||
|---|---|---|---|
| Quadrant | BADHDUFLAG | Total packets | Discarded packets |
| A | 0 | 108 | 0 |
| B | 0 | 108 | 0 |
| C | 0 | 108 | 0 |
| D | 0 | 108 | 0 |
| Mode M0 | |||
|---|---|---|---|
| Quadrant | BADHDUFLAG | Total packets | Discarded packets |
| A | 0 | 13567 | 3 |
| B | 0 | 11260 | 2 |
| C | 0 | 11090 | 2 |
| D | 0 | 13545 | 2 |
| Mode M9 | |||
|---|---|---|---|
| Quadrant | BADHDUFLAG | Total packets | Discarded packets |
| A | 0 | 24 | 0 |
| B | 0 | 24 | 0 |
| C | 0 | 24 | 0 |
| D | 0 | 25 | 0 |
| Quadrant | Total seconds | Saturated seconds | Saturation percentage |
|---|---|---|---|
| A | 5216 | 184 | 3.527607% |
| B | 5216 | 31 | 0.594325% |
| C | 5216 | 54 | 1.035276% |
| D | 5216 | 180 | 3.450920% |
Noise dominated data is calculated using 1-second bins in cleaned event files. If a bin has >2000 counts, and if more than 50% of those come from <1% of pixels, then it is considered to be noise-dominated and hence unusable.
| Quadrant | # 1 sec bins | Bins with >0 counts | Bins with >2000 counts | High rate bins dominated by noise | Noise dominated (total time) | Noise dominated (detector-on time) | Marked lightcurve |
|---|---|---|---|---|---|---|---|
| A | 7338 | 5217 | 185 | 185 | 2.52% | 3.55% | 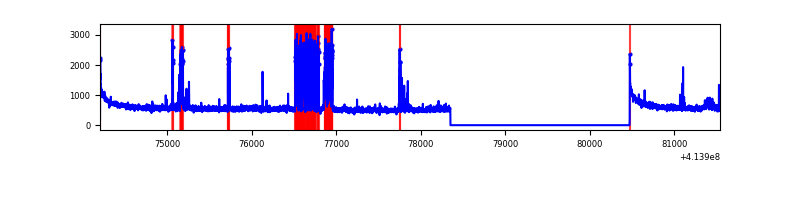 |
| B | 7338 | 5217 | 23 | 23 | 0.31% | 0.44% | 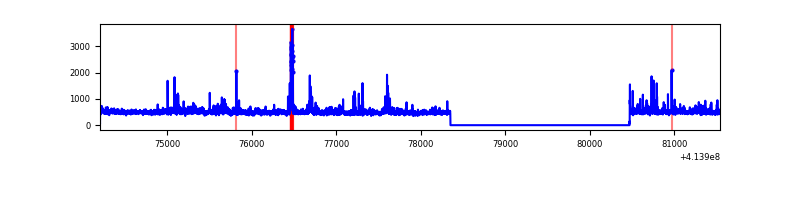 |
| C | 7338 | 5217 | 57 | 57 | 0.78% | 1.09% | 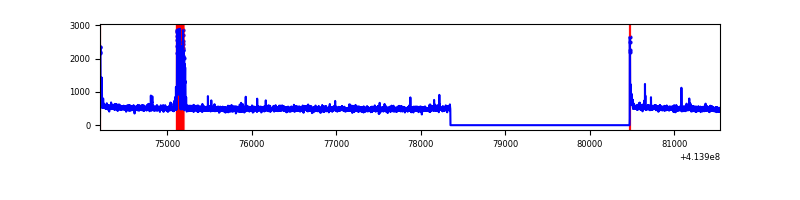 |
| D | 7338 | 5217 | 141 | 141 | 1.92% | 2.70% | 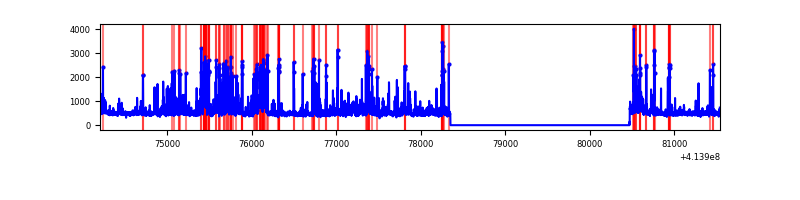 |
Top three noisy pixels from each quadrant. If the there are fewer than three noisy pixels in the level2.evt file, extra rows are filled as -1
| Pixel properties | Quadrant properties | ||||||
|---|---|---|---|---|---|---|---|
| Quadrant | DetID | PixID | Counts | Sigma | Mean | Median | Sigma |
| A | 6 | 10 | 514173 | 4105.31 | 615 | 604 | 125.1 |
| A | 10 | 83 | 483120 | 3857.09 | 615 | 604 | 125.1 |
| A | 13 | 248 | 82047 | 651.03 | 615 | 604 | 125.1 |
| B | 5 | 255 | 128914 | 1088.53 | 608 | 591 | 117.9 |
| B | 0 | 230 | 84181 | 709.07 | 608 | 591 | 117.9 |
| B | 0 | 229 | 53338 | 447.44 | 608 | 591 | 117.9 |
| C | 15 | 214 | 221066 | 1577.26 | 596 | 602 | 139.8 |
| C | 15 | 159 | 143353 | 1021.28 | 596 | 602 | 139.8 |
| C | 0 | 10 | 37605 | 264.73 | 596 | 602 | 139.8 |
| D | 13 | 249 | 393001 | 2635.67 | 599 | 582 | 148.9 |
| D | 2 | 249 | 236509 | 1584.6 | 599 | 582 | 148.9 |
| D | 12 | 227 | 231344 | 1549.91 | 599 | 582 | 148.9 |
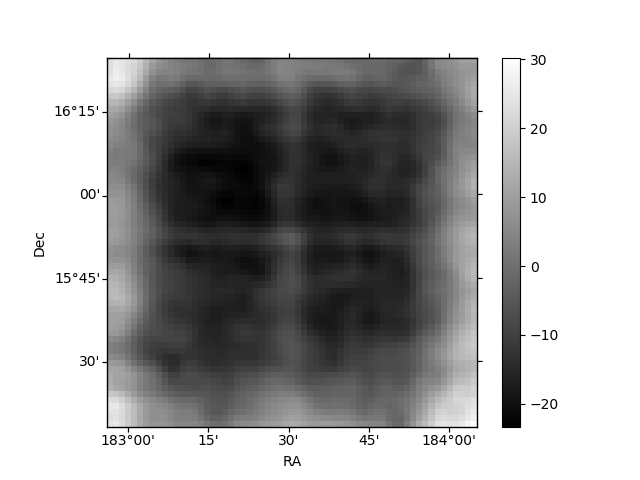
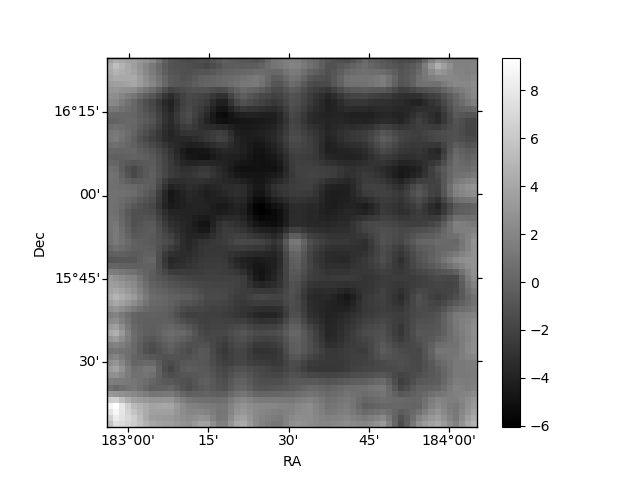
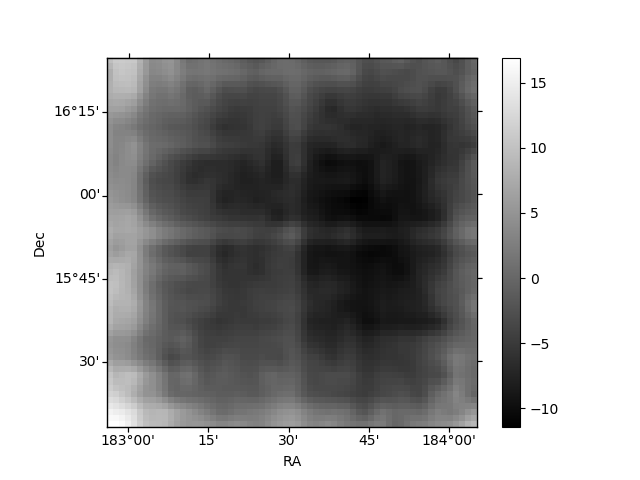
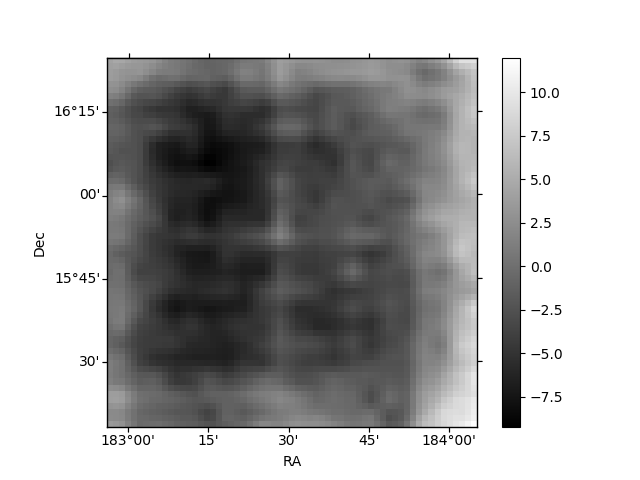
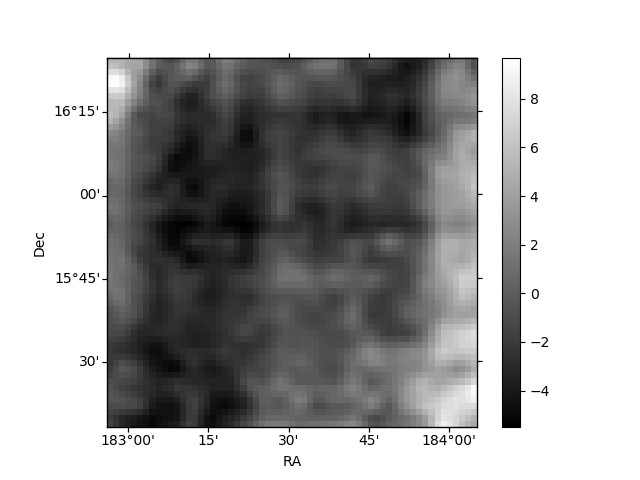
Histogram calculated using DETX and DETY for each event in the final _common_clean file
| Quadrant A | 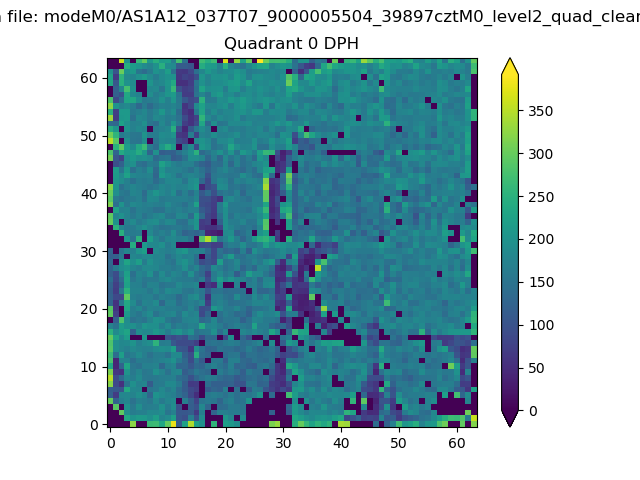 |
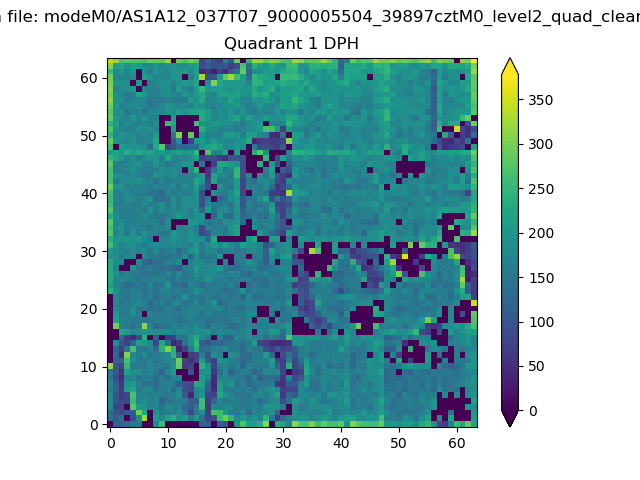 |
Quadrant B |
|---|---|---|---|
| Quadrant D | 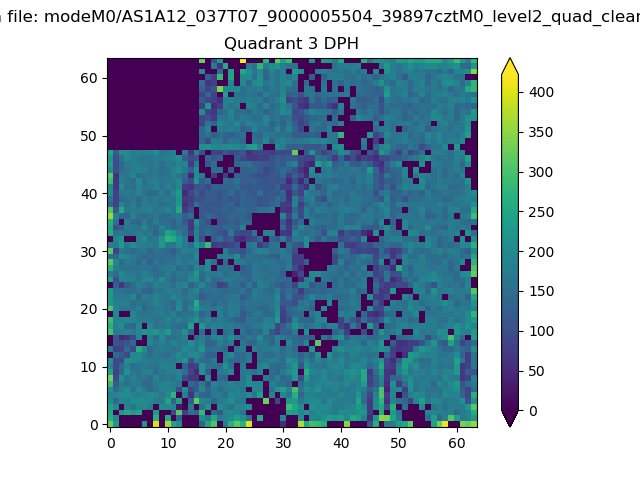 |
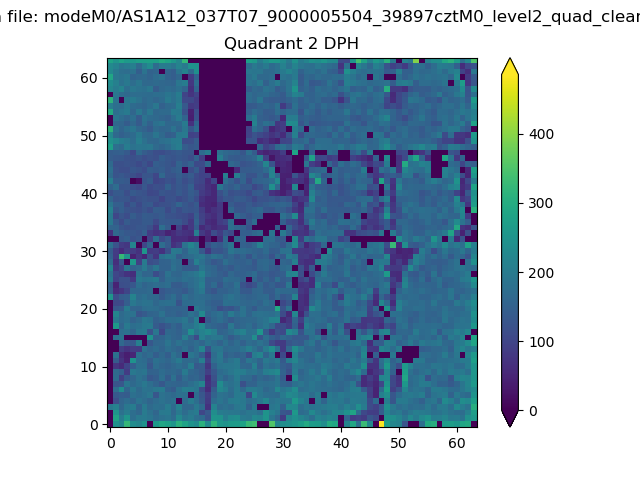 |
Quadrant C |
| Plot type | Count rate plots | Images |
|---|---|---|
| Comparison with Poisson distribution Blue bars denote a histogram of data divided into 1 sec bins. Red curve is a Poisson curve with rate = median count rate of data. |
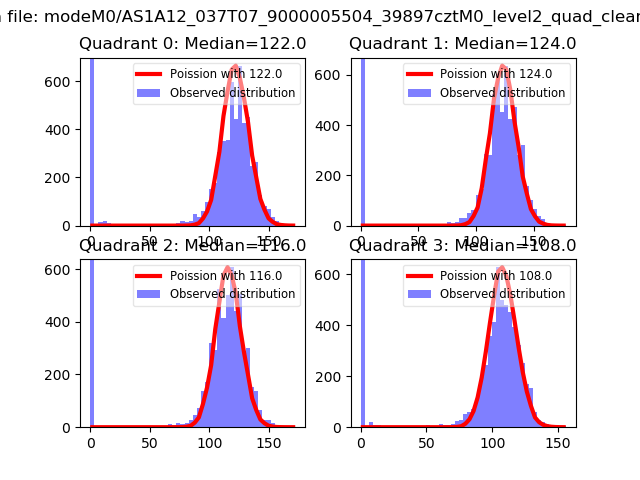 |
 |
| Quadrant-wise count rates Data is divided into 100 sec bins |
 |
|
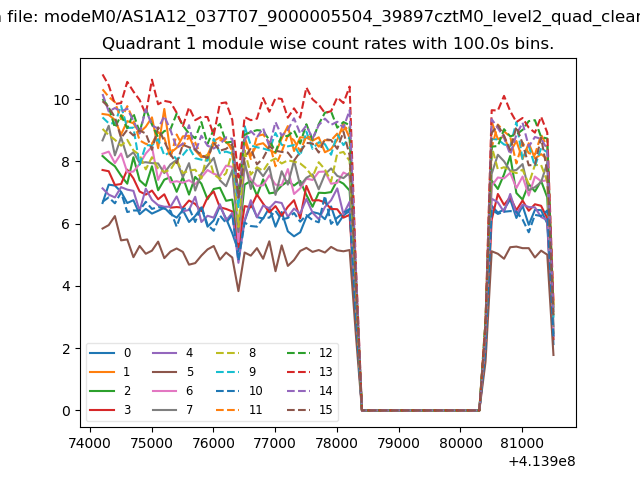
| Module-wise count rates for Quadrant A Data is divided into 100 sec bins |
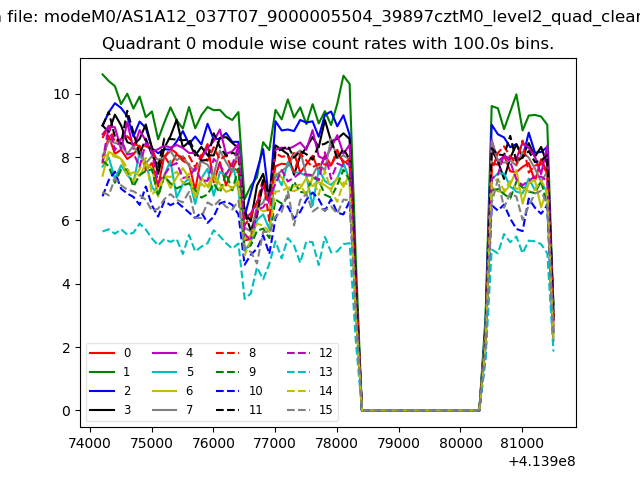 |
 |
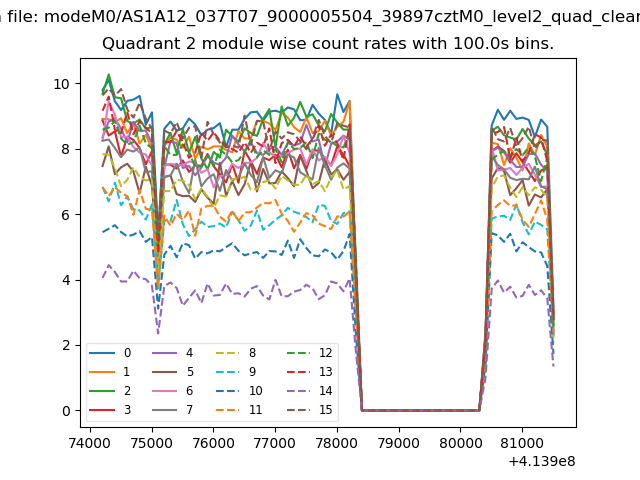
| Module-wise count rates for Quadrant B Data is divided into 100 sec bins |
 |
 |
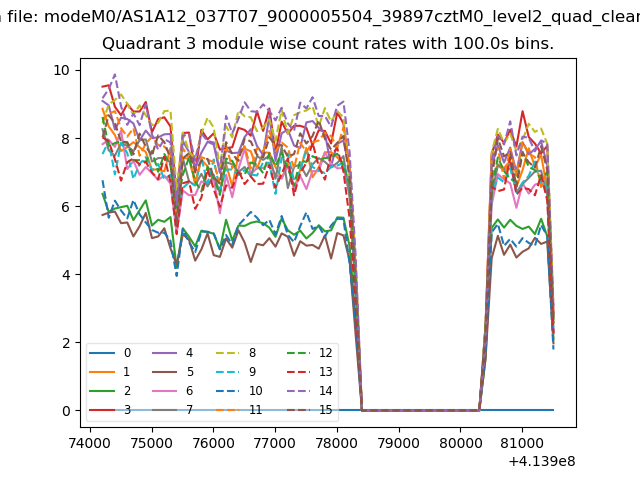
| Module-wise count rates for Quadrant C Data is divided into 100 sec bins |
 |
 |
| Module-wise count rates for Quadrant D Data is divided into 100 sec bins |
 |
 |
| Parameter | Plot |
|---|---|
| CZT HV Monitor | 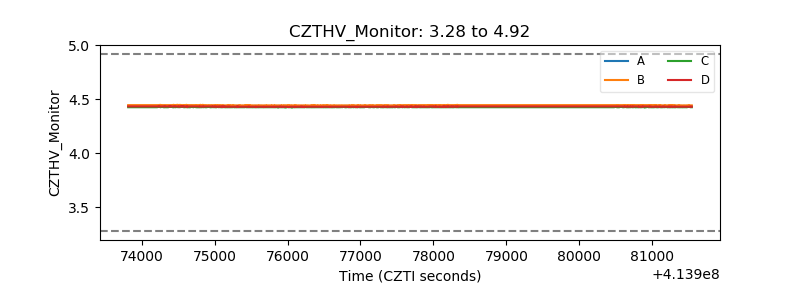 |
| D_VDD | 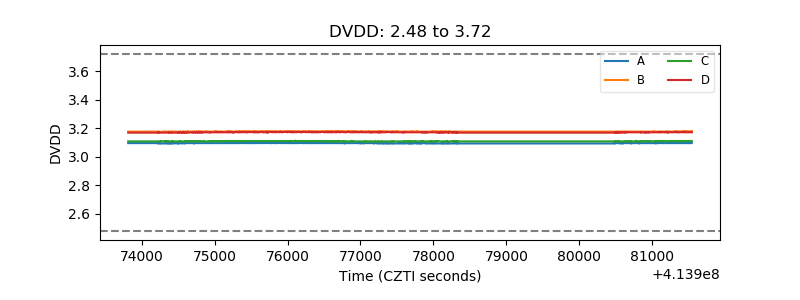 |
| Temperature 1 | 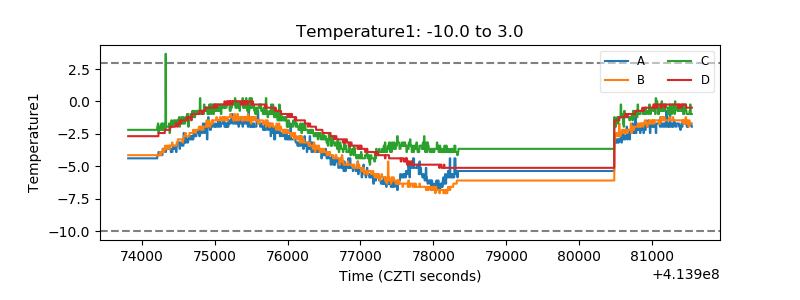 |
| Veto HV Monitor | 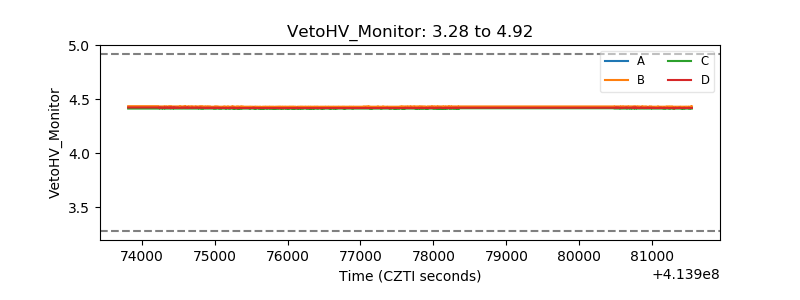 |
| Veto LLD | 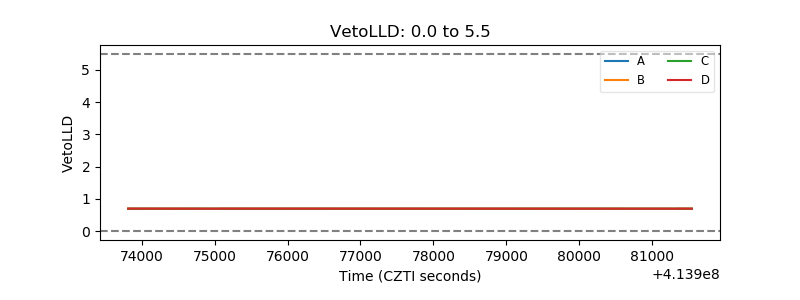 |
| Alpha Counter | 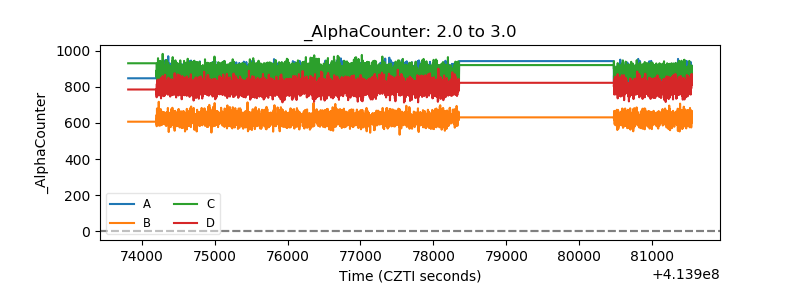 |
| _CPM_Rate | 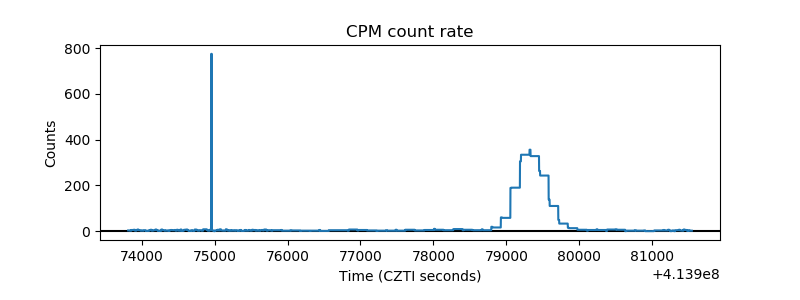 |
| CZT Counter | 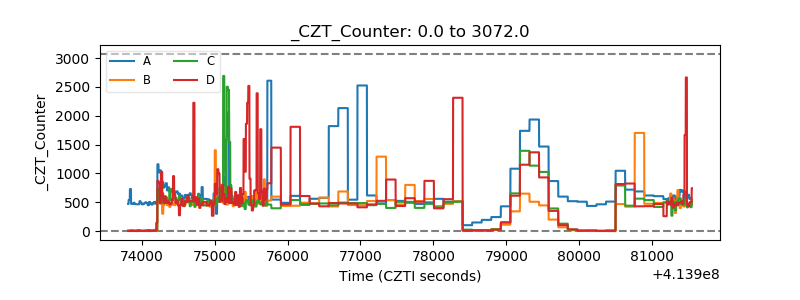 |
| +2.5 Volts monitor |  |
| +5 Volts monitor | 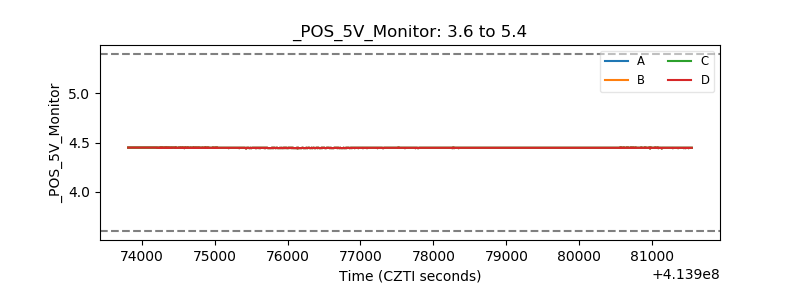 |
| _ROLL_ROT | 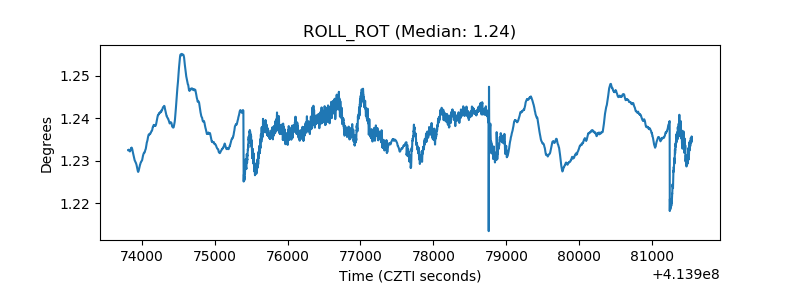 |
| _Roll_DEC | 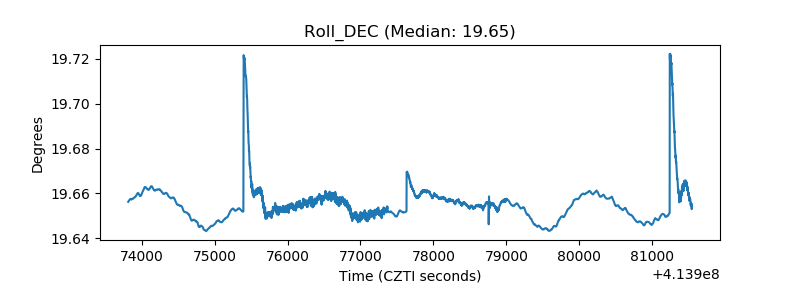 |
| _Roll_RA | 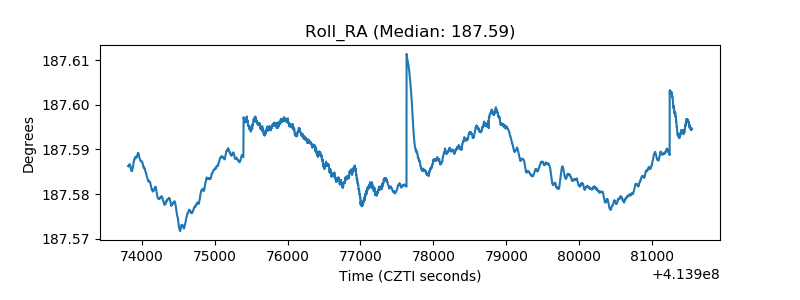 |
| Veto Counter | 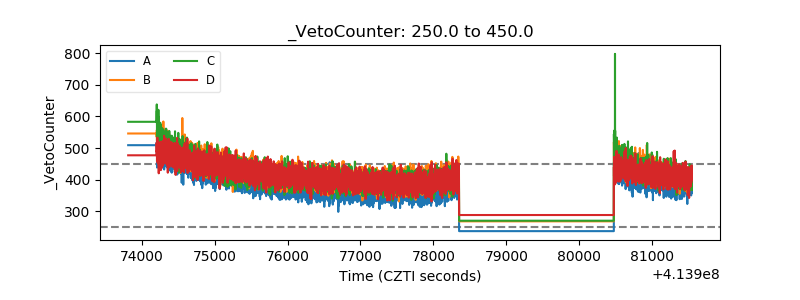 |