| Param | Original file | Final file |
|---|---|---|
| Filename | modeM0/AS1A12_044T09_9000005506_39898cztM0_level2.fits | modeM0/AS1A12_044T09_9000005506_39898cztM0_level2_quad_clean.evt |
| Size (bytes) | 120,905,280 | 33,197,760 |
| Size | 115.3 MB | 31.7 MB |
| Events in quadrant A | 1,110,970 | 225,966 |
| Events in quadrant B | 964,144 | 228,350 |
| Events in quadrant C | 965,923 | 215,204 |
| Events in quadrant D | 1,280,278 | 194,345 |
| Mode SS | |||
|---|---|---|---|
| Quadrant | BADHDUFLAG | Total packets | Discarded packets |
| A | 0 | 40 | 0 |
| B | 0 | 40 | 0 |
| C | 0 | 40 | 0 |
| D | 0 | 40 | 0 |
| Mode M9 | |||
|---|---|---|---|
| Quadrant | BADHDUFLAG | Total packets | Discarded packets |
| A | 0 | 20 | 0 |
| B | 0 | 20 | 0 |
| C | 0 | 20 | 0 |
| D | 0 | 20 | 0 |
| Mode M0 | |||
|---|---|---|---|
| Quadrant | BADHDUFLAG | Total packets | Discarded packets |
| A | 0 | 4457 | 2 |
| B | 0 | 4090 | 1 |
| C | 0 | 3996 | 1 |
| D | 0 | 5163 | 1 |
| Quadrant | Total seconds | Saturated seconds | Saturation percentage |
|---|---|---|---|
| A | 1949 | 6 | 0.307850% |
| B | 1949 | 4 | 0.205233% |
| C | 1949 | 7 | 0.359159% |
| D | 1949 | 112 | 5.746537% |
Noise dominated data is calculated using 1-second bins in cleaned event files. If a bin has >2000 counts, and if more than 50% of those come from <1% of pixels, then it is considered to be noise-dominated and hence unusable.
| Quadrant | # 1 sec bins | Bins with >0 counts | Bins with >2000 counts | High rate bins dominated by noise | Noise dominated (total time) | Noise dominated (detector-on time) | Marked lightcurve |
|---|---|---|---|---|---|---|---|
| A | 3952 | 1950 | 4 | 4 | 0.10% | 0.21% | 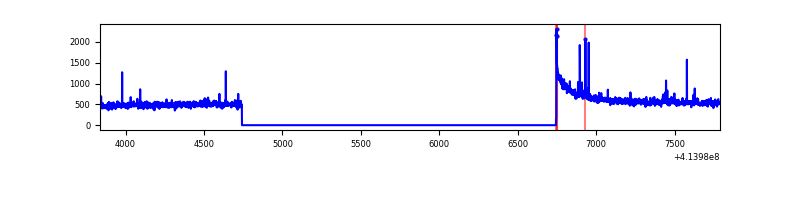 |
| B | 3952 | 1950 | 3 | 3 | 0.08% | 0.15% | 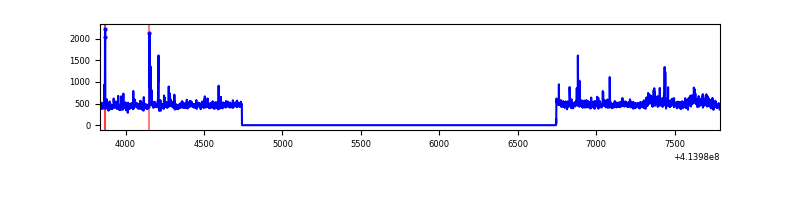 |
| C | 3952 | 1950 | 5 | 5 | 0.13% | 0.26% | 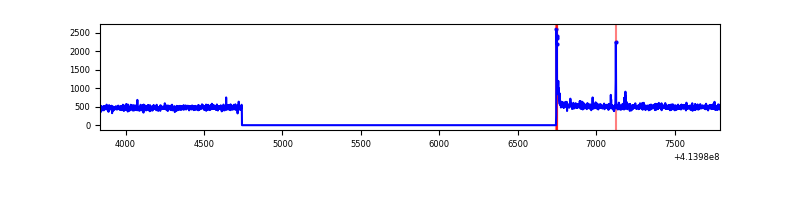 |
| D | 3952 | 1950 | 86 | 86 | 2.18% | 4.41% | 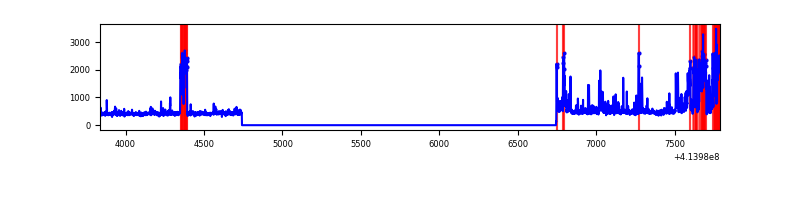 |
Top three noisy pixels from each quadrant. If the there are fewer than three noisy pixels in the level2.evt file, extra rows are filled as -1
| Pixel properties | Quadrant properties | ||||||
|---|---|---|---|---|---|---|---|
| Quadrant | DetID | PixID | Counts | Sigma | Mean | Median | Sigma |
| A | 10 | 83 | 200852 | 4172.57 | 225 | 220 | 48.1 |
| A | 6 | 10 | 11944 | 243.83 | 225 | 220 | 48.1 |
| A | 13 | 248 | 11097 | 226.21 | 225 | 220 | 48.1 |
| B | 0 | 230 | 24390 | 537.72 | 223 | 217 | 45.0 |
| B | 4 | 171 | 17557 | 385.72 | 223 | 217 | 45.0 |
| B | 5 | 255 | 12181 | 266.13 | 223 | 217 | 45.0 |
| C | 15 | 214 | 83134 | 1582.53 | 218 | 219 | 52.4 |
| C | 0 | 10 | 16537 | 311.45 | 218 | 219 | 52.4 |
| C | 14 | 254 | 4984 | 90.95 | 218 | 219 | 52.4 |
| D | 13 | 249 | 213860 | 3903.99 | 213 | 206 | 54.7 |
| D | 12 | 227 | 99139 | 1807.75 | 213 | 206 | 54.7 |
| D | 2 | 250 | 41341 | 751.64 | 213 | 206 | 54.7 |
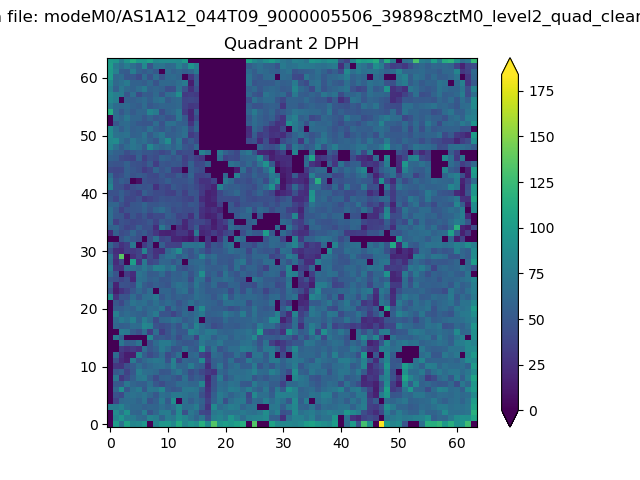
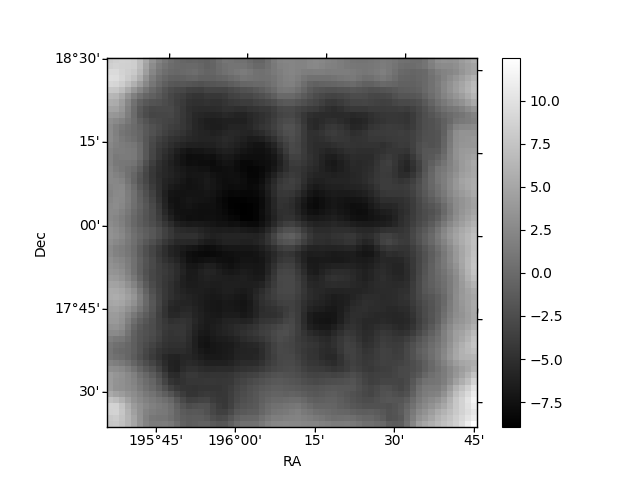
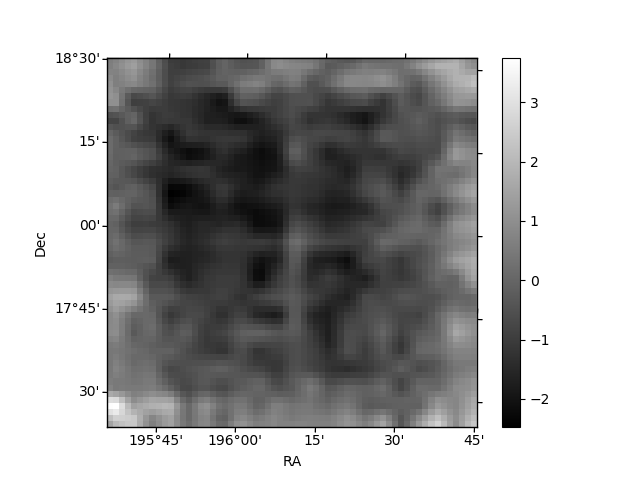
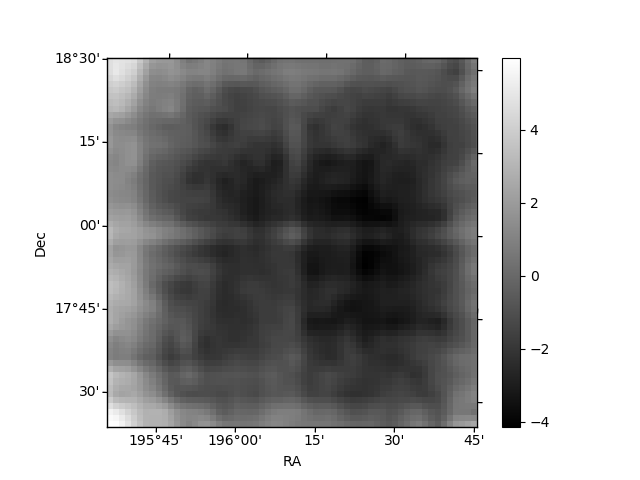
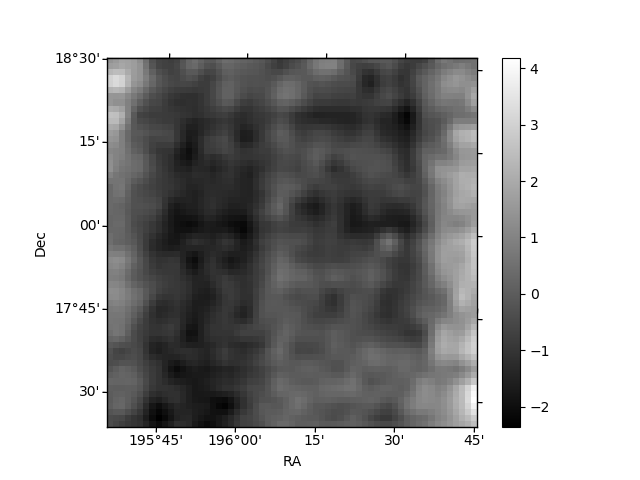
Histogram calculated using DETX and DETY for each event in the final _common_clean file
| Quadrant A | 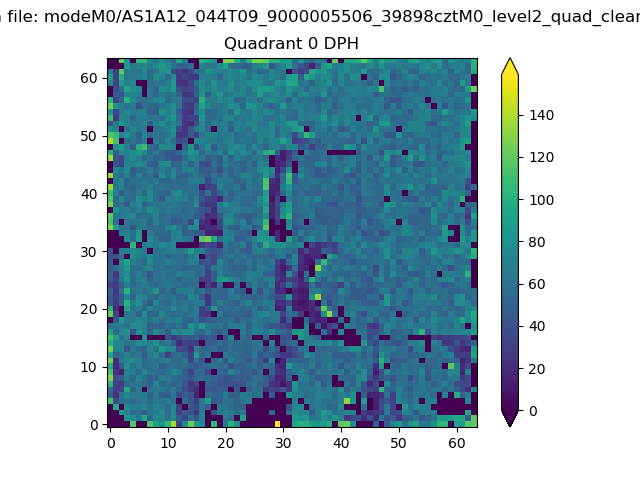 |
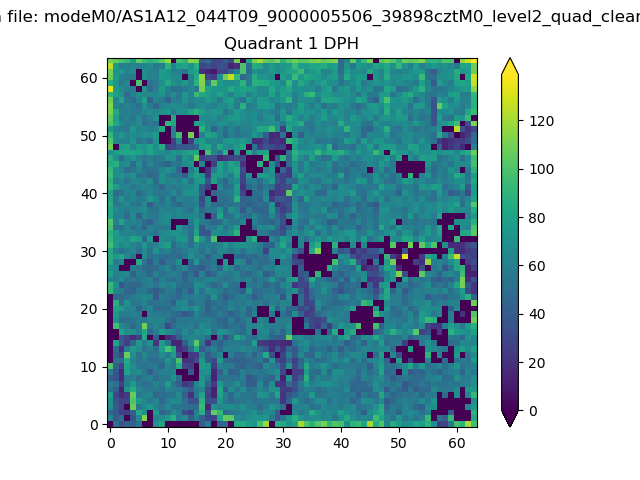 |
Quadrant B |
|---|---|---|---|
| Quadrant D | 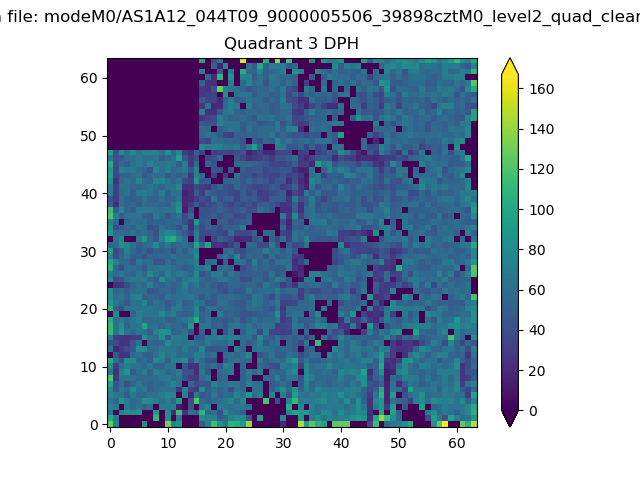 |
 |
Quadrant C |
| Plot type | Count rate plots | Images |
|---|---|---|
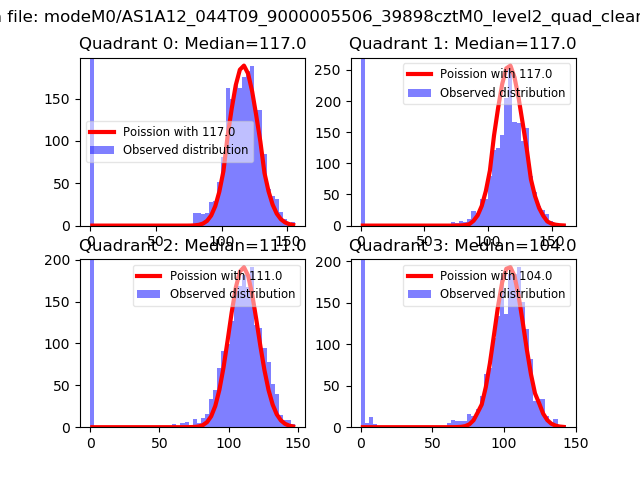
| Comparison with Poisson distribution Blue bars denote a histogram of data divided into 1 sec bins. Red curve is a Poisson curve with rate = median count rate of data. |
 |
 |
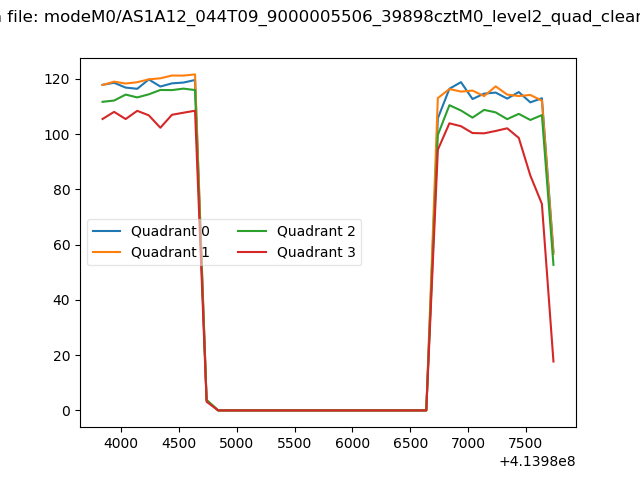
| Quadrant-wise count rates Data is divided into 100 sec bins |
 |
|
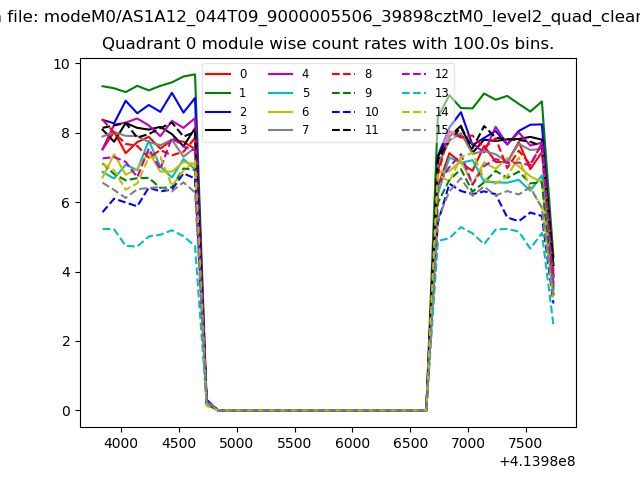
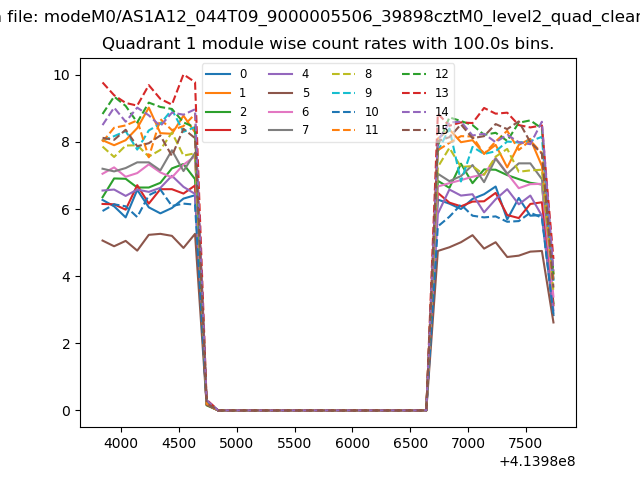
| Module-wise count rates for Quadrant A Data is divided into 100 sec bins |
 |
 |
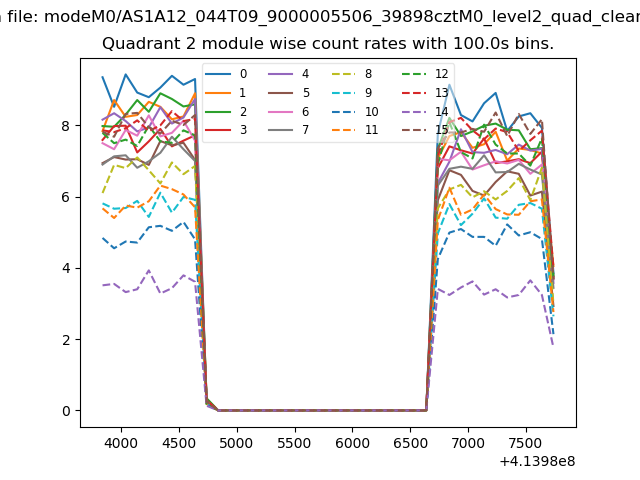
| Module-wise count rates for Quadrant B Data is divided into 100 sec bins |
 |
 |
| Module-wise count rates for Quadrant C Data is divided into 100 sec bins |
 |
 |
| Module-wise count rates for Quadrant D Data is divided into 100 sec bins |
 |
 |
| Parameter | Plot |
|---|---|
| CZT HV Monitor | 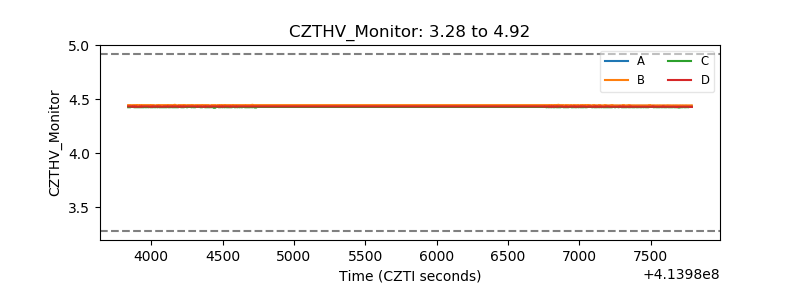 |
| D_VDD | 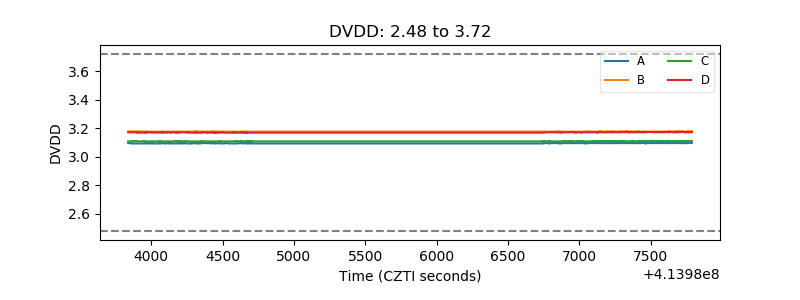 |
| Temperature 1 | 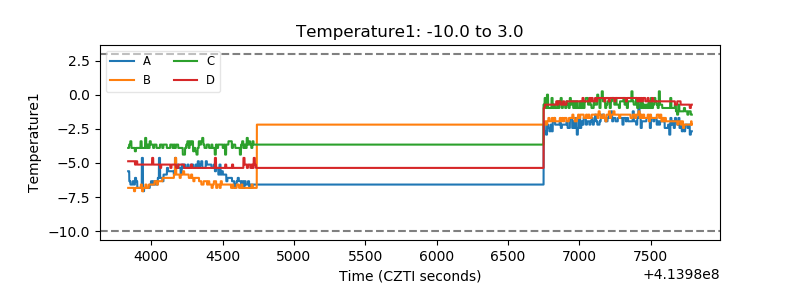 |
| Veto HV Monitor | 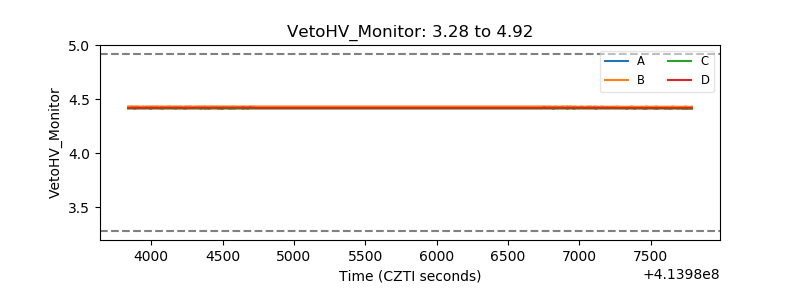 |
| Veto LLD | 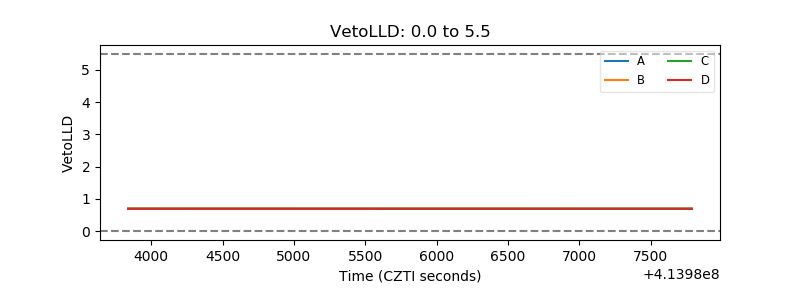 |
| Alpha Counter | 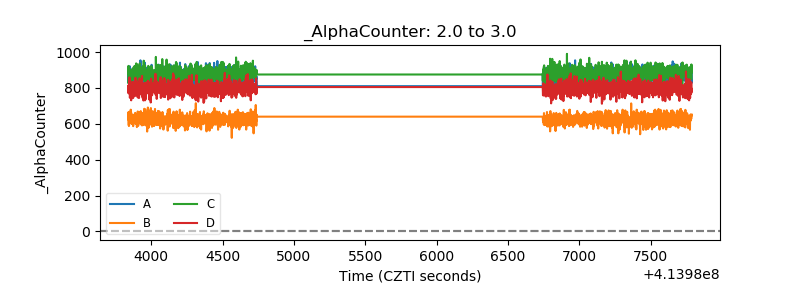 |
| _CPM_Rate | 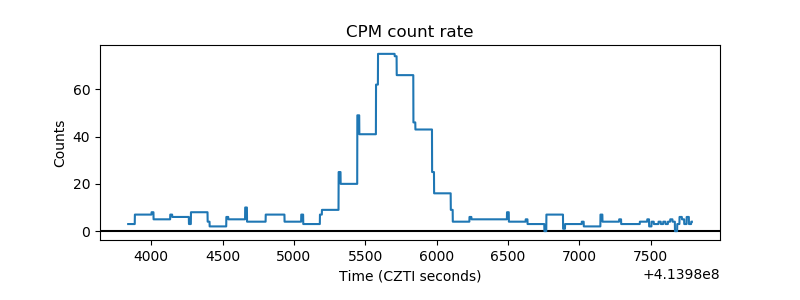 |
| CZT Counter | 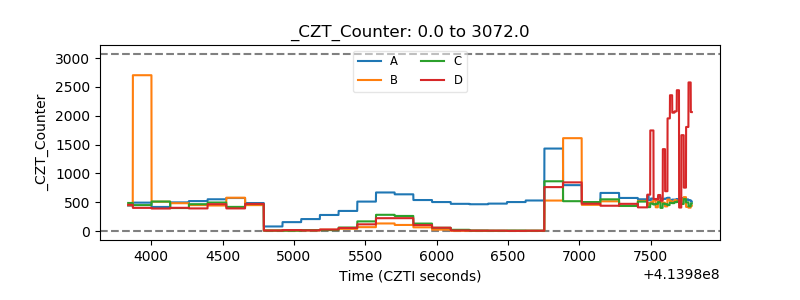 |
| +2.5 Volts monitor | 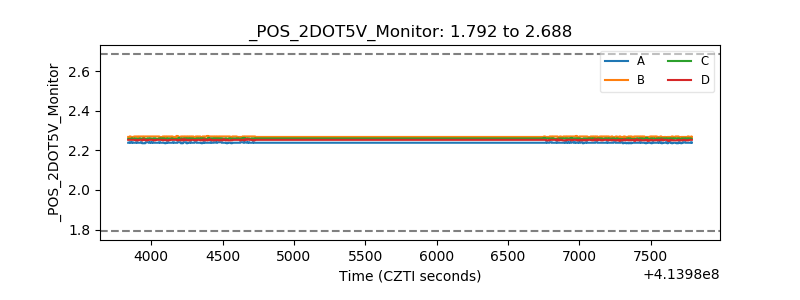 |
| +5 Volts monitor | 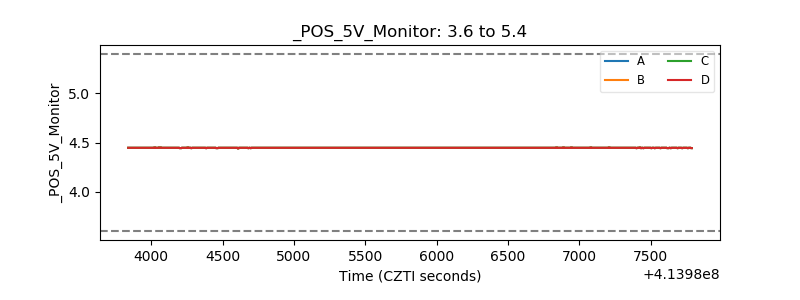 |
| _ROLL_ROT | 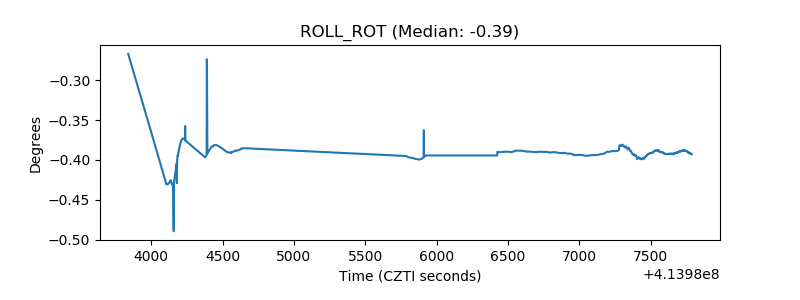 |
| _Roll_DEC | 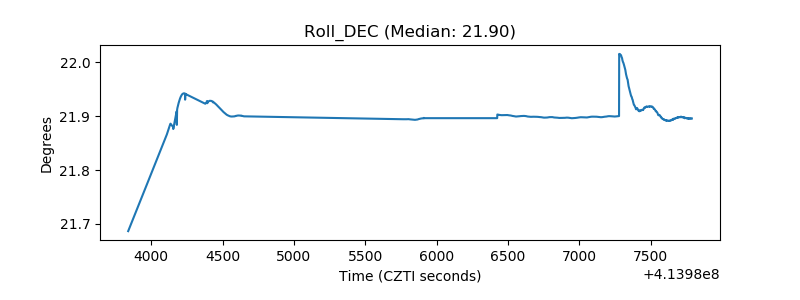 |
| _Roll_RA | 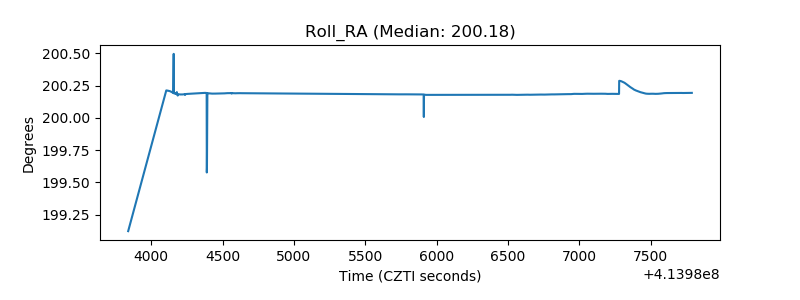 |
| Veto Counter | 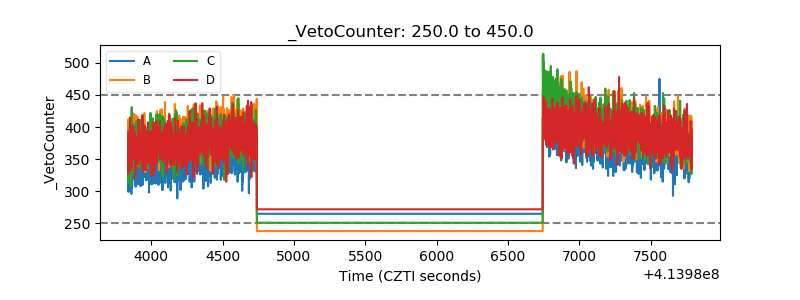 |