| Param | Original file | Final file |
|---|---|---|
| Filename | modeM0/AS1A12_044T09_9000005506_39899cztM0_level2.fits | modeM0/AS1A12_044T09_9000005506_39899cztM0_level2_quad_clean.evt |
| Size (bytes) | 340,297,920 | 90,331,200 |
| Size | 324.5 MB | 86.1 MB |
| Events in quadrant A | 3,030,098 | 614,646 |
| Events in quadrant B | 2,836,615 | 618,866 |
| Events in quadrant C | 2,650,198 | 590,320 |
| Events in quadrant D | 3,653,368 | 528,542 |
| Mode SS | |||
|---|---|---|---|
| Quadrant | BADHDUFLAG | Total packets | Discarded packets |
| A | 0 | 110 | 0 |
| B | 0 | 110 | 0 |
| C | 0 | 110 | 0 |
| D | 0 | 110 | 0 |
| Mode M9 | |||
|---|---|---|---|
| Quadrant | BADHDUFLAG | Total packets | Discarded packets |
| A | 0 | 26 | 0 |
| B | 0 | 26 | 0 |
| C | 0 | 26 | 0 |
| D | 0 | 27 | 0 |
| Mode M0 | |||
|---|---|---|---|
| Quadrant | BADHDUFLAG | Total packets | Discarded packets |
| A | 0 | 12365 | 2 |
| B | 0 | 11937 | 1 |
| C | 0 | 11192 | 1 |
| D | 0 | 14580 | 1 |
| Quadrant | Total seconds | Saturated seconds | Saturation percentage |
|---|---|---|---|
| A | 5472 | 34 | 0.621345% |
| B | 5472 | 41 | 0.749269% |
| C | 5472 | 16 | 0.292398% |
| D | 5472 | 319 | 5.829678% |
Noise dominated data is calculated using 1-second bins in cleaned event files. If a bin has >2000 counts, and if more than 50% of those come from <1% of pixels, then it is considered to be noise-dominated and hence unusable.
| Quadrant | # 1 sec bins | Bins with >0 counts | Bins with >2000 counts | High rate bins dominated by noise | Noise dominated (total time) | Noise dominated (detector-on time) | Marked lightcurve |
|---|---|---|---|---|---|---|---|
| A | 7175 | 5473 | 21 | 21 | 0.29% | 0.38% | 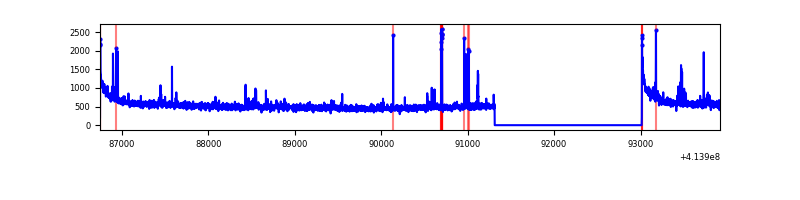 |
| B | 7175 | 5473 | 28 | 28 | 0.39% | 0.51% | 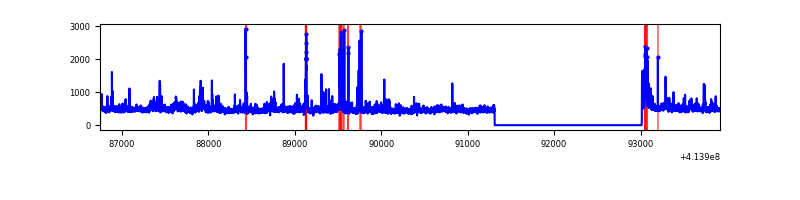 |
| C | 7175 | 5473 | 12 | 12 | 0.17% | 0.22% | 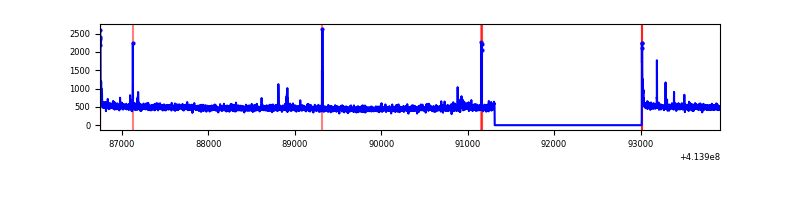 |
| D | 7175 | 5473 | 278 | 278 | 3.87% | 5.08% | 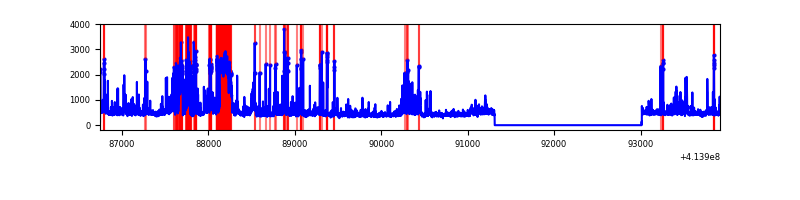 |
Top three noisy pixels from each quadrant. If the there are fewer than three noisy pixels in the level2.evt file, extra rows are filled as -1
| Pixel properties | Quadrant properties | ||||||
|---|---|---|---|---|---|---|---|
| Quadrant | DetID | PixID | Counts | Sigma | Mean | Median | Sigma |
| A | 10 | 83 | 497287 | 3955.3 | 614 | 601 | 125.6 |
| A | 2 | 79 | 55489 | 437.09 | 614 | 601 | 125.6 |
| A | 7 | 3 | 41124 | 322.7 | 614 | 601 | 125.6 |
| B | 0 | 230 | 145662 | 1222.94 | 609 | 592 | 118.6 |
| B | 5 | 255 | 122203 | 1025.18 | 609 | 592 | 118.6 |
| B | 15 | 85 | 50257 | 418.68 | 609 | 592 | 118.6 |
| C | 15 | 214 | 228966 | 1627.05 | 597 | 601 | 140.4 |
| C | 0 | 10 | 33087 | 231.46 | 597 | 601 | 140.4 |
| C | 14 | 254 | 17932 | 123.48 | 597 | 601 | 140.4 |
| D | 13 | 249 | 608723 | 4169.8 | 586 | 568 | 145.8 |
| D | 1 | 47 | 388244 | 2658.09 | 586 | 568 | 145.8 |
| D | 12 | 227 | 159685 | 1090.98 | 586 | 568 | 145.8 |
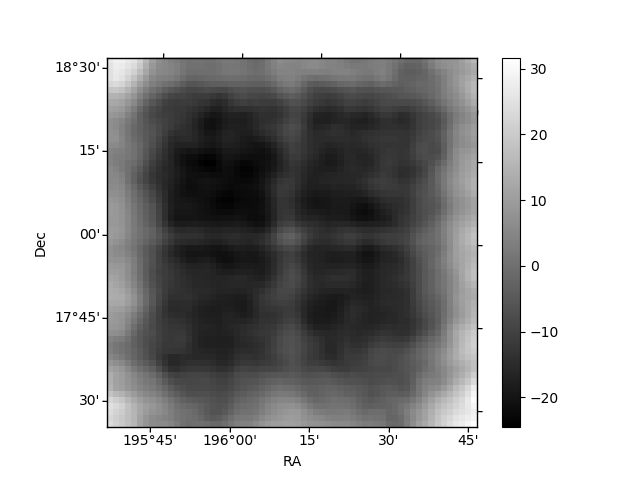
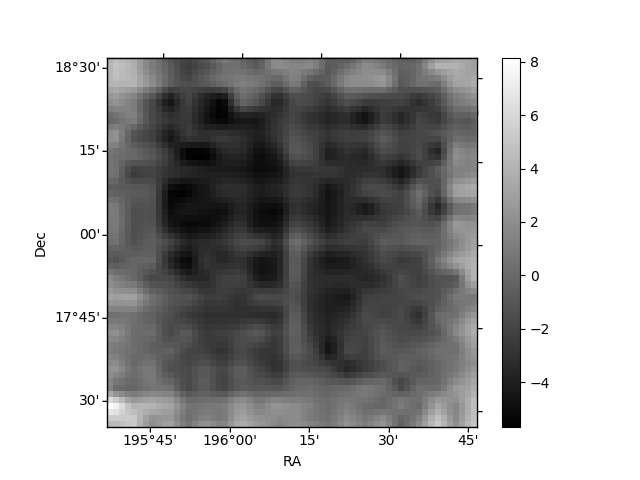
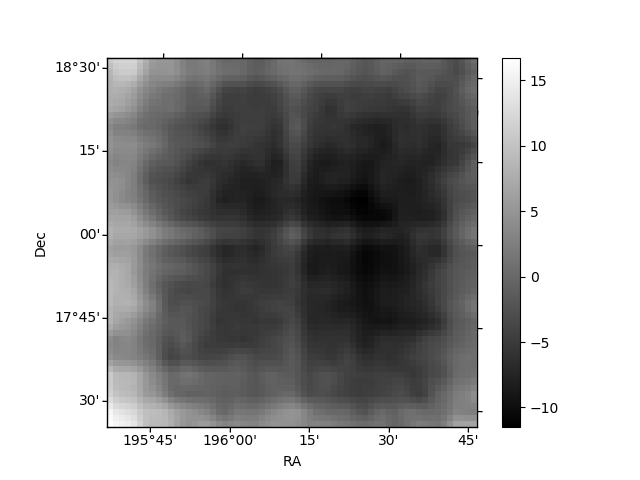
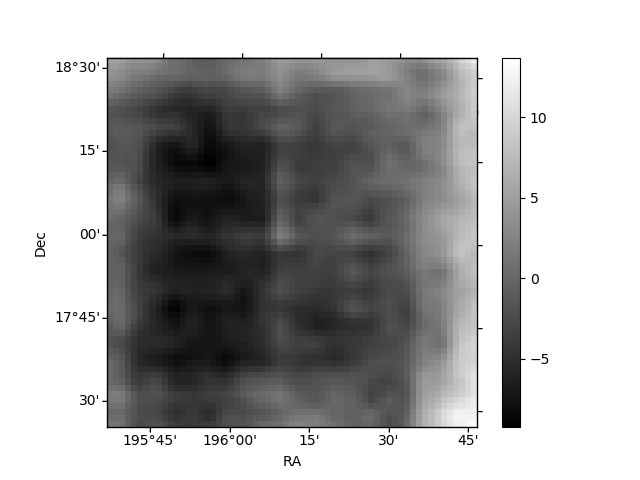
Histogram calculated using DETX and DETY for each event in the final _common_clean file
| Quadrant A | 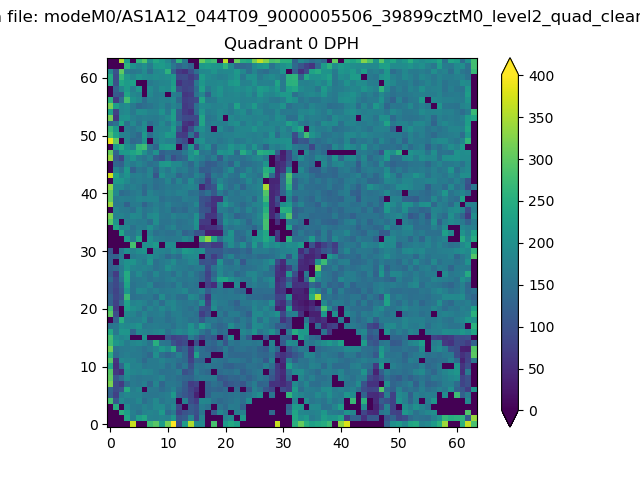 |
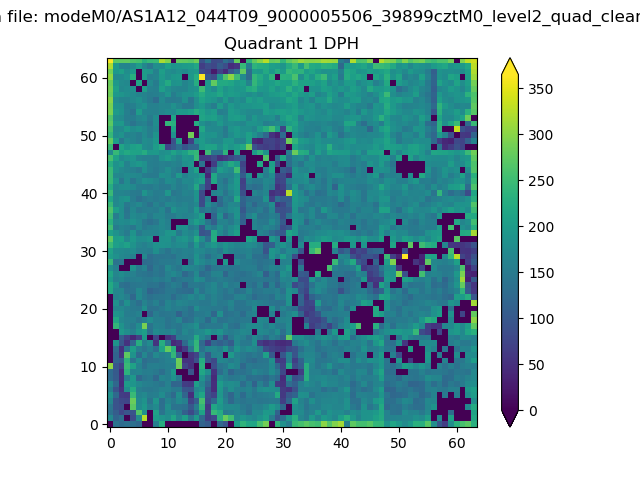 |
Quadrant B |
|---|---|---|---|
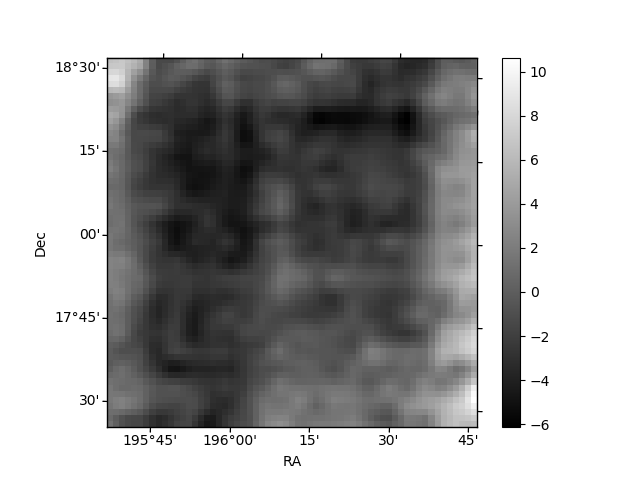
| Quadrant D | 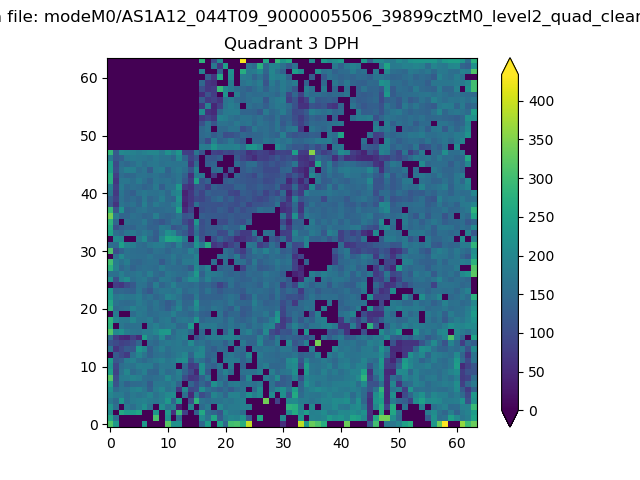 |
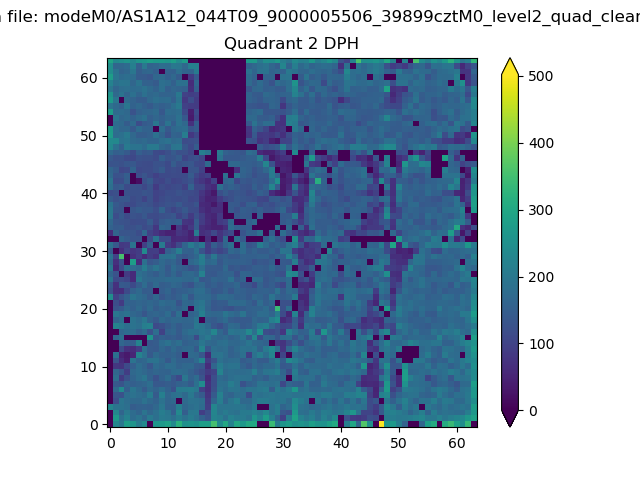 |
Quadrant C |
| Plot type | Count rate plots | Images |
|---|---|---|
| Comparison with Poisson distribution Blue bars denote a histogram of data divided into 1 sec bins. Red curve is a Poisson curve with rate = median count rate of data. |
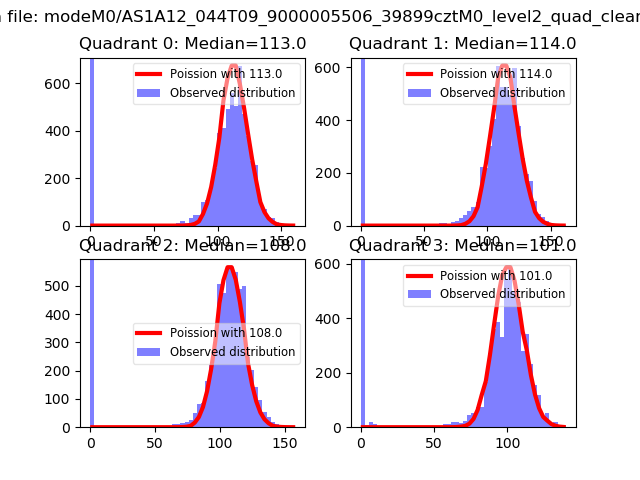 |
 |
| Quadrant-wise count rates Data is divided into 100 sec bins |
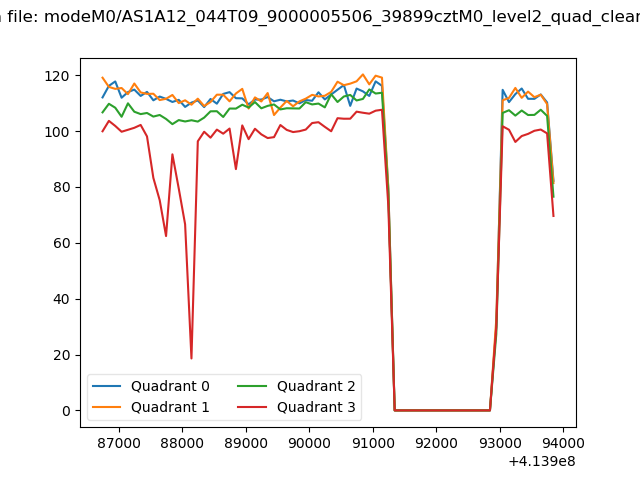 |
|
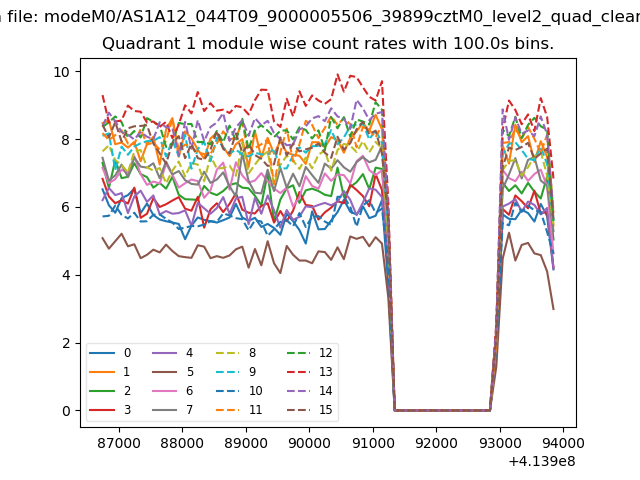
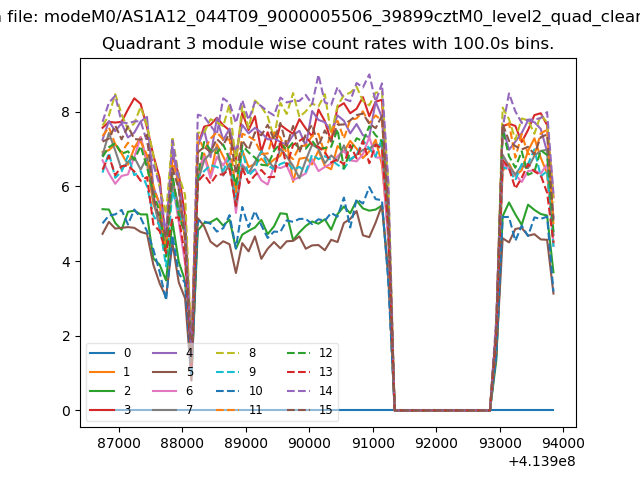
| Module-wise count rates for Quadrant A Data is divided into 100 sec bins |
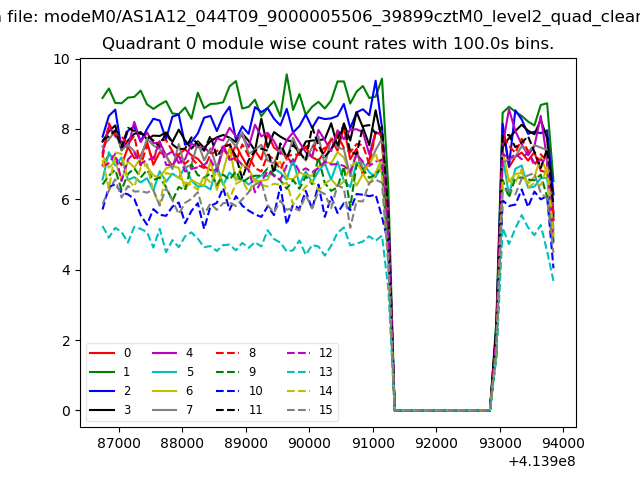 |
 |
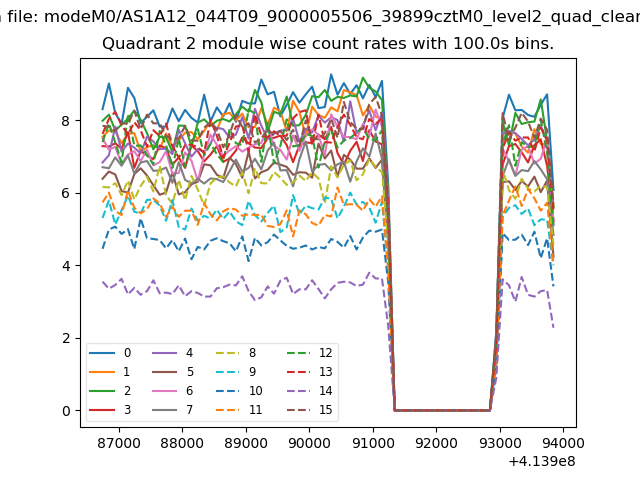
| Module-wise count rates for Quadrant B Data is divided into 100 sec bins |
 |
 |
| Module-wise count rates for Quadrant C Data is divided into 100 sec bins |
 |
 |
| Module-wise count rates for Quadrant D Data is divided into 100 sec bins |
 |
 |
| Parameter | Plot |
|---|---|
| CZT HV Monitor | 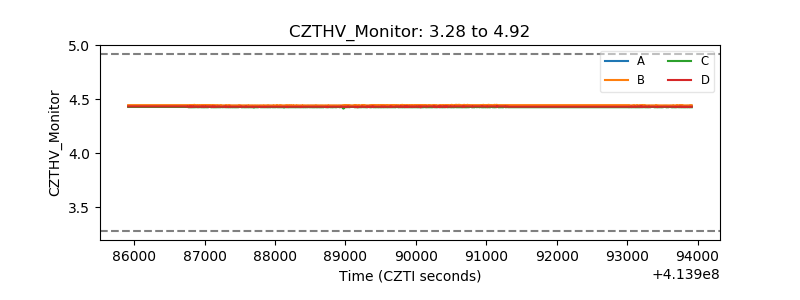 |
| D_VDD | 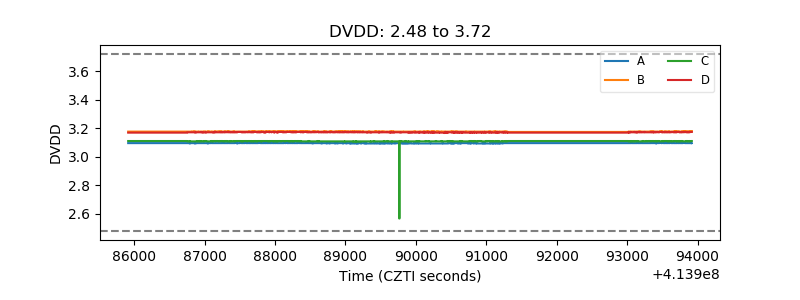 |
| Temperature 1 | 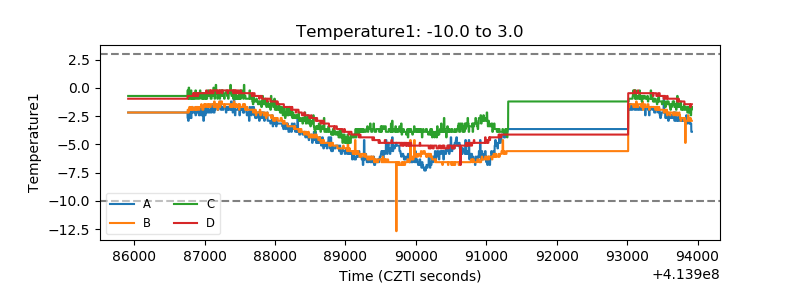 |
| Veto HV Monitor | 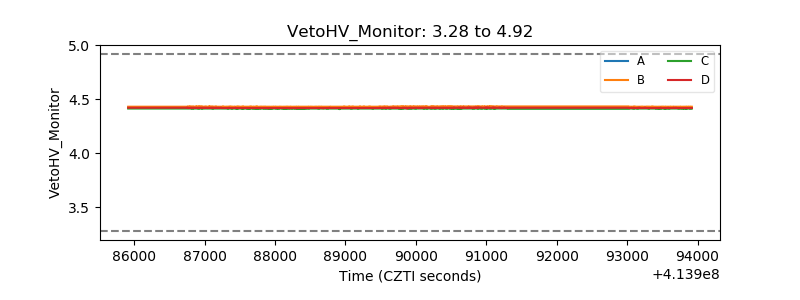 |
| Veto LLD | 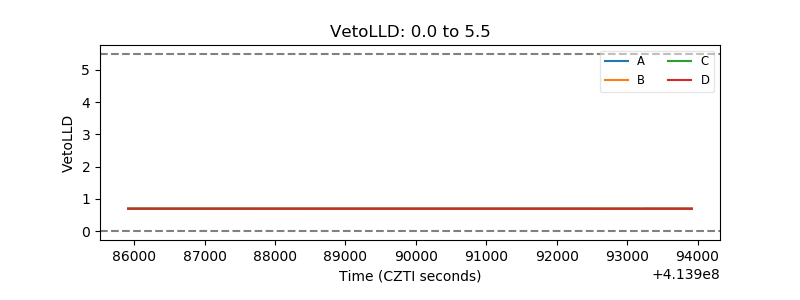 |
| Alpha Counter | 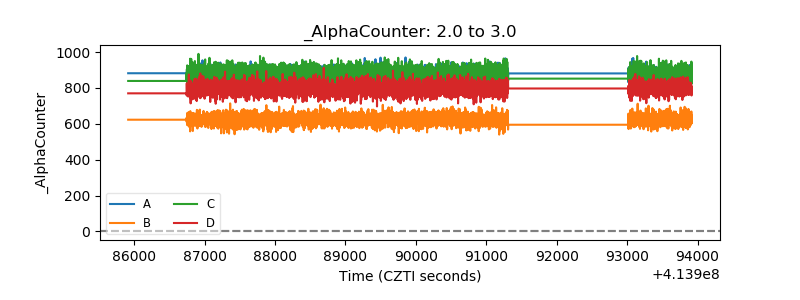 |
| _CPM_Rate | 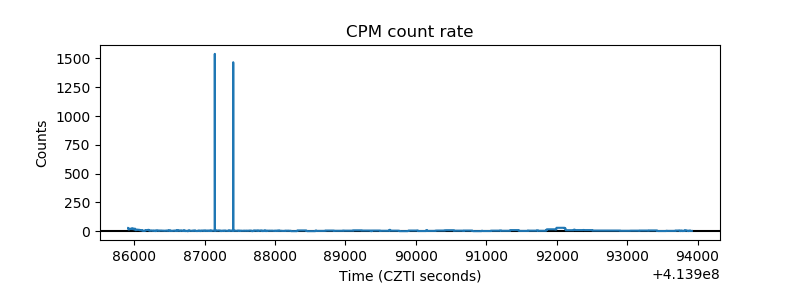 |
| CZT Counter | 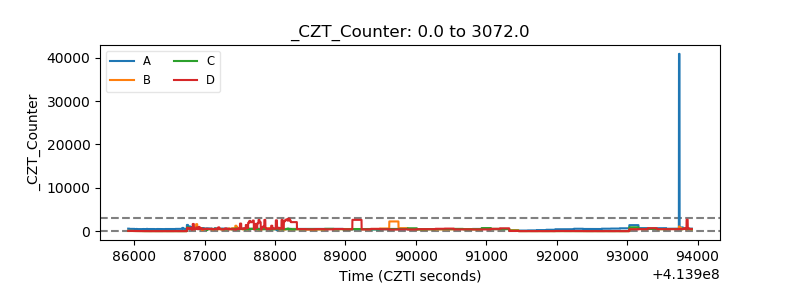 |
| +2.5 Volts monitor | 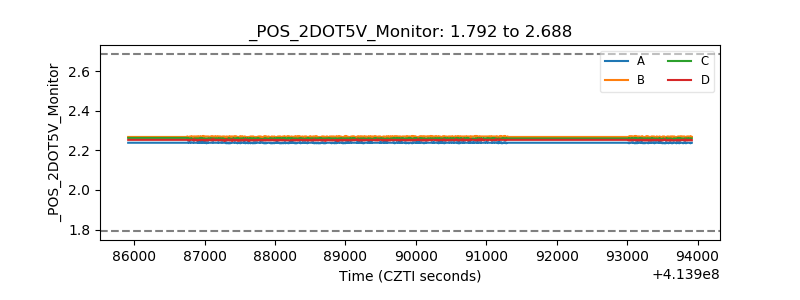 |
| +5 Volts monitor | 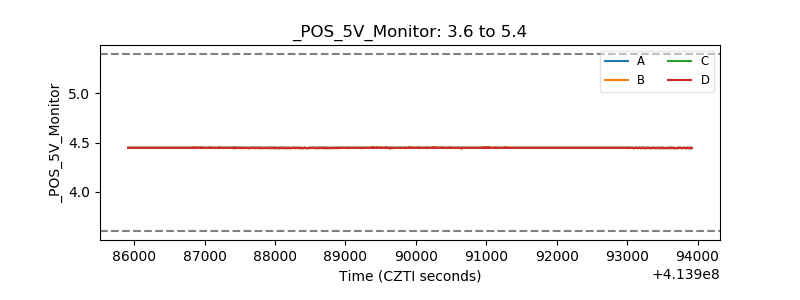 |
| _ROLL_ROT | 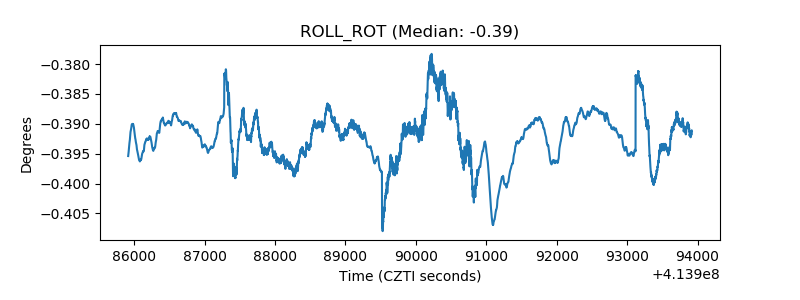 |
| _Roll_DEC | 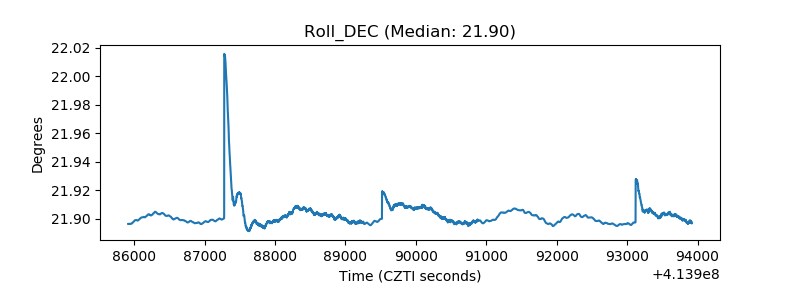 |
| _Roll_RA | 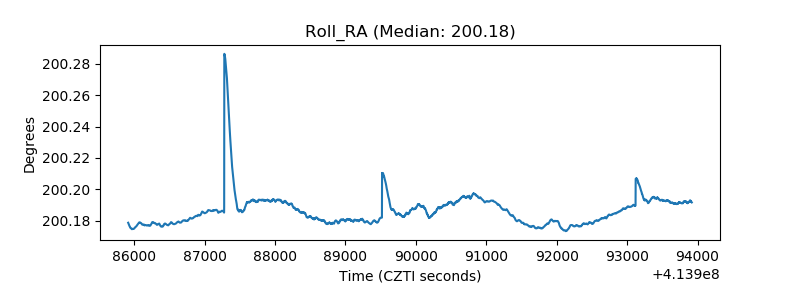 |
| Veto Counter | 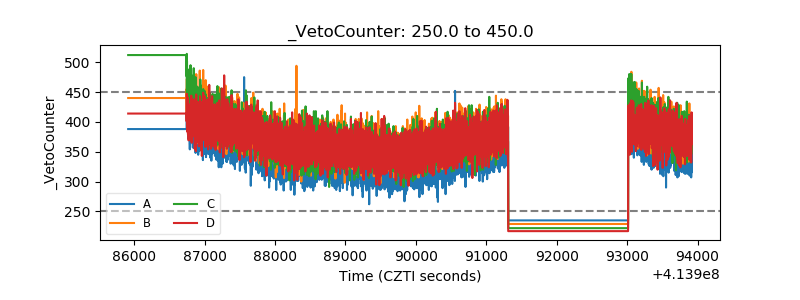 |