| Param | Original file | Final file |
|---|---|---|
| Filename | modeM0/AS1A12_044T09_9000005506_39900cztM0_level2.fits | modeM0/AS1A12_044T09_9000005506_39900cztM0_level2_quad_clean.evt |
| Size (bytes) | 369,495,360 | 95,250,240 |
| Size | 352.4 MB | 90.8 MB |
| Events in quadrant A | 3,160,229 | 644,961 |
| Events in quadrant B | 3,219,094 | 644,763 |
| Events in quadrant C | 2,865,803 | 622,698 |
| Events in quadrant D | 3,980,625 | 565,885 |
| Mode SS | |||
|---|---|---|---|
| Quadrant | BADHDUFLAG | Total packets | Discarded packets |
| A | 0 | 118 | 0 |
| B | 0 | 118 | 0 |
| C | 0 | 118 | 0 |
| D | 0 | 118 | 0 |
| Mode M9 | |||
|---|---|---|---|
| Quadrant | BADHDUFLAG | Total packets | Discarded packets |
| A | 0 | 22 | 0 |
| B | 0 | 22 | 0 |
| C | 0 | 22 | 0 |
| D | 0 | 23 | 0 |
| Mode M0 | |||
|---|---|---|---|
| Quadrant | BADHDUFLAG | Total packets | Discarded packets |
| A | 0 | 12995 | 2 |
| B | 0 | 13403 | 1 |
| C | 0 | 12039 | 1 |
| D | 0 | 15901 | 1 |
| Quadrant | Total seconds | Saturated seconds | Saturation percentage |
|---|---|---|---|
| A | 5804 | 26 | 0.447967% |
| B | 5804 | 119 | 2.050310% |
| C | 5804 | 17 | 0.292901% |
| D | 5804 | 247 | 4.255686% |
Noise dominated data is calculated using 1-second bins in cleaned event files. If a bin has >2000 counts, and if more than 50% of those come from <1% of pixels, then it is considered to be noise-dominated and hence unusable.
| Quadrant | # 1 sec bins | Bins with >0 counts | Bins with >2000 counts | High rate bins dominated by noise | Noise dominated (total time) | Noise dominated (detector-on time) | Marked lightcurve |
|---|---|---|---|---|---|---|---|
| A | 7207 | 5805 | 12 | 12 | 0.17% | 0.21% | 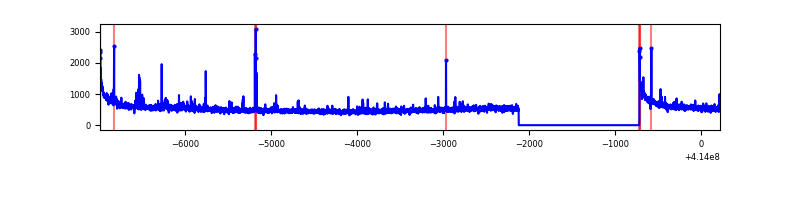 |
| B | 7207 | 5805 | 77 | 77 | 1.07% | 1.33% | 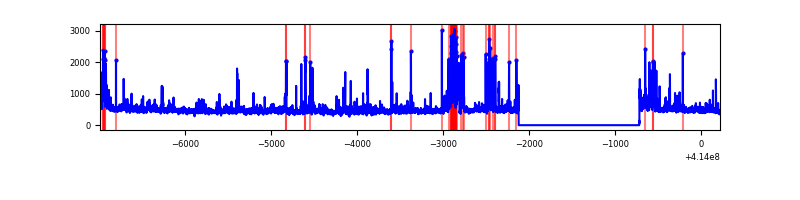 |
| C | 7207 | 5805 | 8 | 8 | 0.11% | 0.14% | 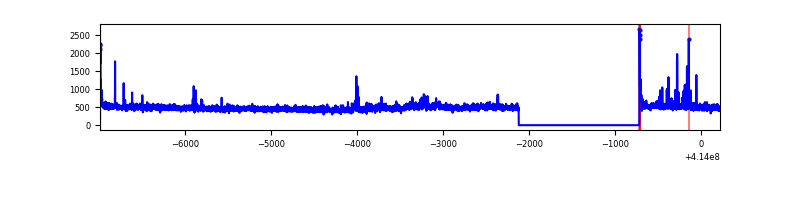 |
| D | 7207 | 5805 | 247 | 247 | 3.43% | 4.25% | 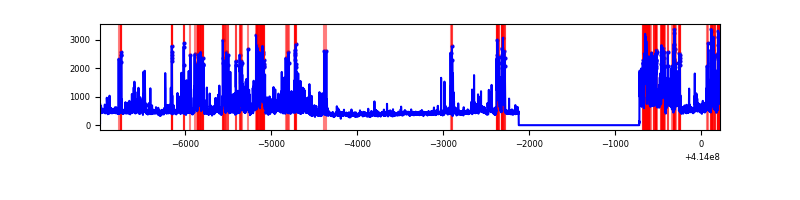 |
Top three noisy pixels from each quadrant. If the there are fewer than three noisy pixels in the level2.evt file, extra rows are filled as -1
| Pixel properties | Quadrant properties | ||||||
|---|---|---|---|---|---|---|---|
| Quadrant | DetID | PixID | Counts | Sigma | Mean | Median | Sigma |
| A | 10 | 83 | 521998 | 3928.8 | 648 | 636 | 132.7 |
| A | 7 | 3 | 47828 | 355.62 | 648 | 636 | 132.7 |
| A | 13 | 248 | 37686 | 279.2 | 648 | 636 | 132.7 |
| B | 5 | 255 | 331392 | 2641.45 | 639 | 623 | 125.2 |
| B | 0 | 230 | 148821 | 1183.48 | 639 | 623 | 125.2 |
| B | 15 | 85 | 40904 | 321.68 | 639 | 623 | 125.2 |
| C | 15 | 214 | 242175 | 1628.48 | 629 | 633 | 148.3 |
| C | 1 | 23 | 76979 | 514.72 | 629 | 633 | 148.3 |
| C | 3 | 233 | 39823 | 264.22 | 629 | 633 | 148.3 |
| D | 12 | 227 | 592428 | 3838.8 | 622 | 604 | 154.2 |
| D | 1 | 47 | 513586 | 3327.4 | 622 | 604 | 154.2 |
| D | 13 | 249 | 218834 | 1415.52 | 622 | 604 | 154.2 |
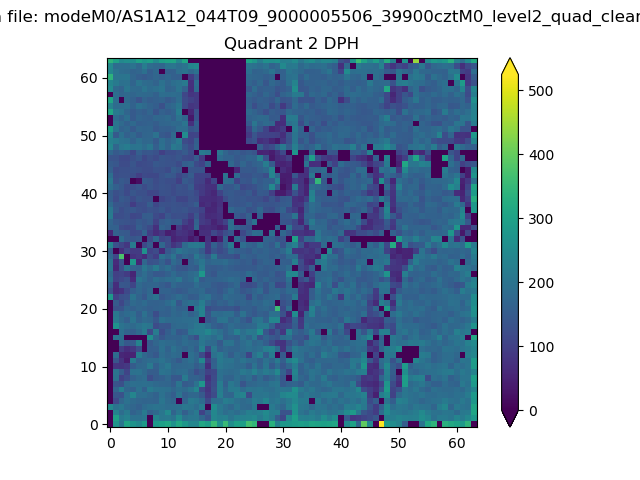
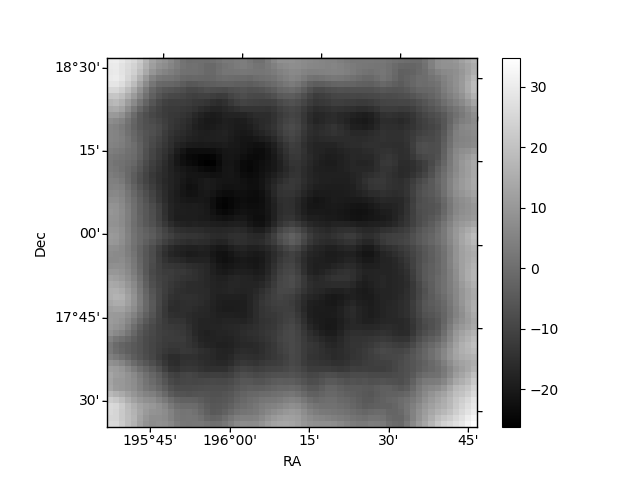
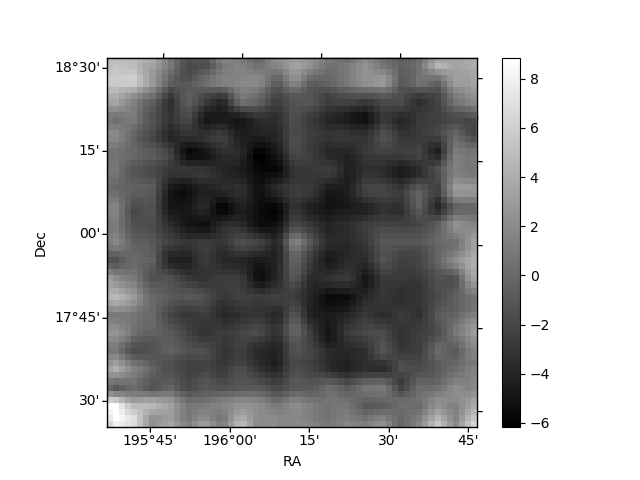
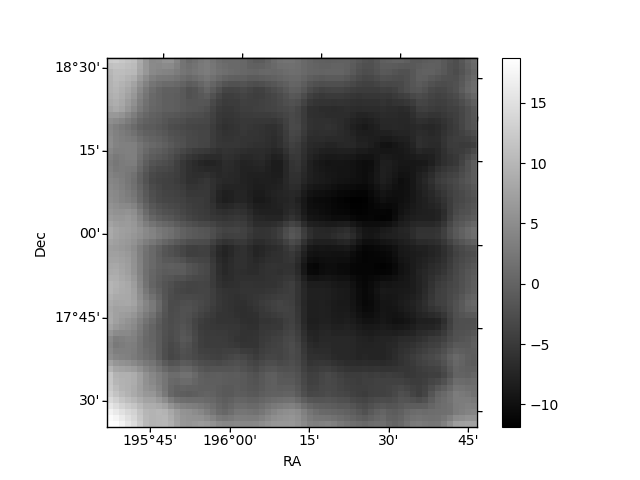
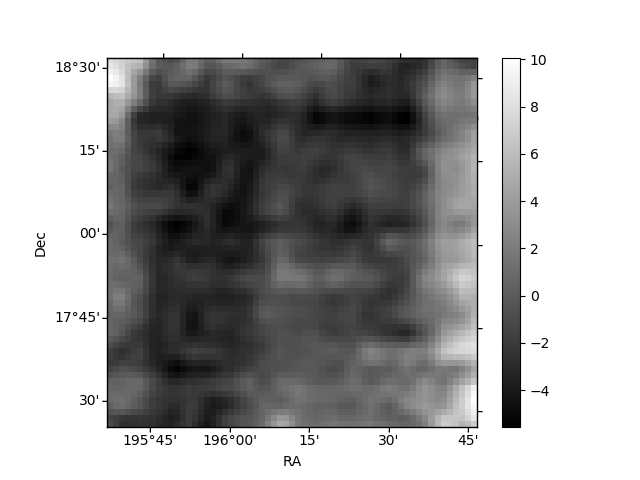
Histogram calculated using DETX and DETY for each event in the final _common_clean file
| Quadrant A | 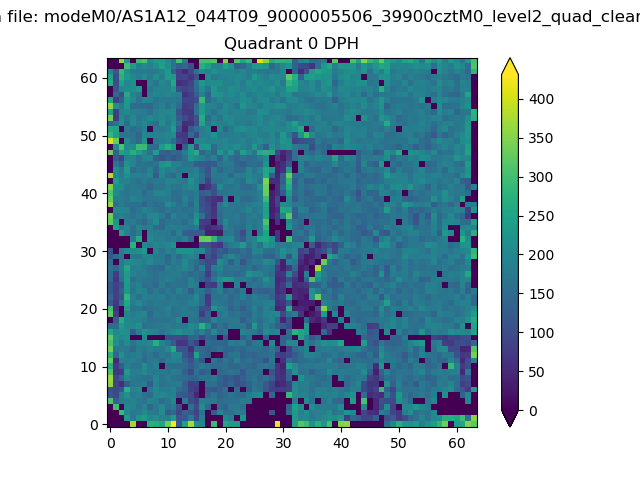 |
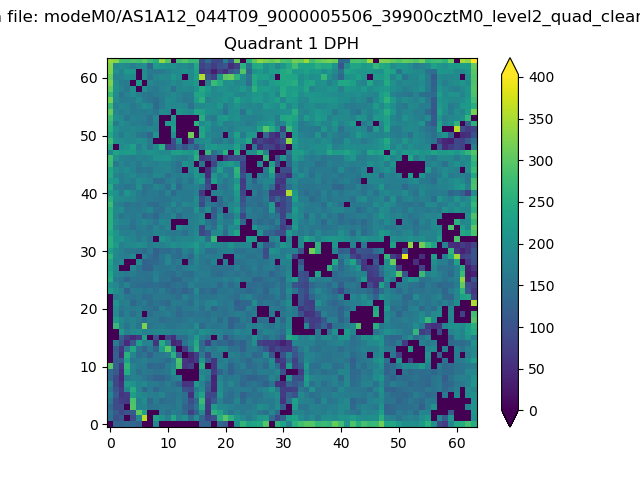 |
Quadrant B |
|---|---|---|---|
| Quadrant D | 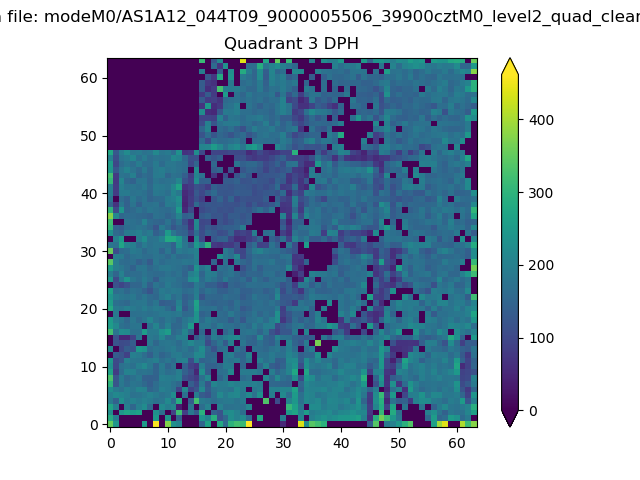 |
 |
Quadrant C |
| Plot type | Count rate plots | Images |
|---|---|---|
| Comparison with Poisson distribution Blue bars denote a histogram of data divided into 1 sec bins. Red curve is a Poisson curve with rate = median count rate of data. |
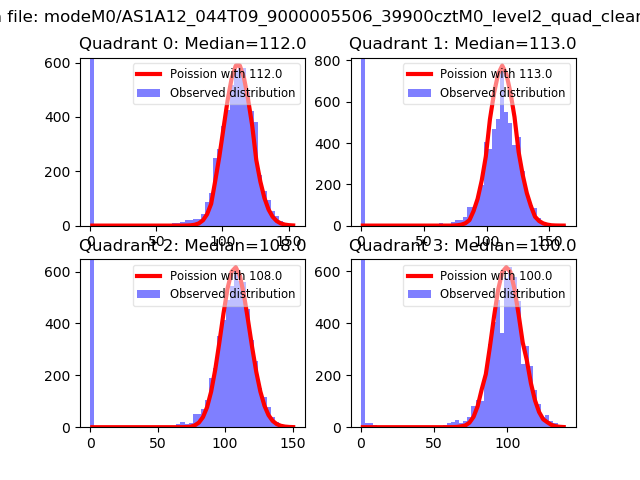 |
 |
| Quadrant-wise count rates Data is divided into 100 sec bins |
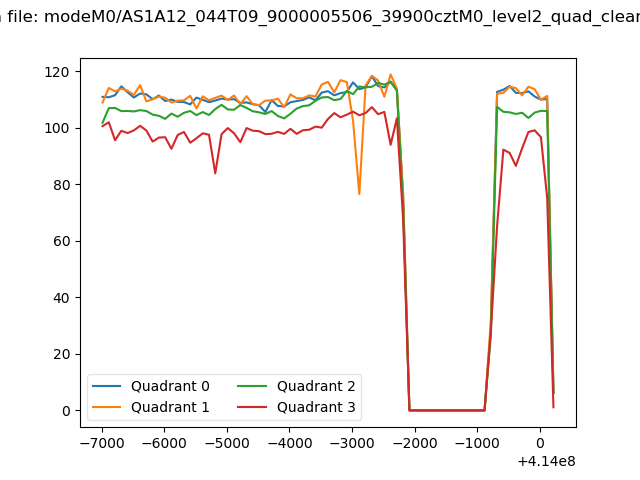 |
|
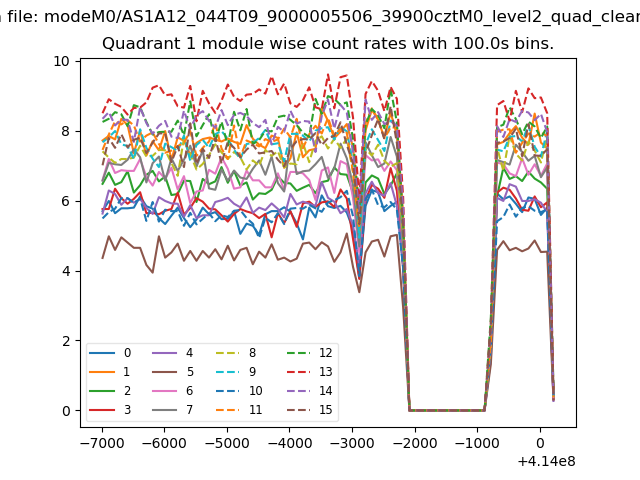
| Module-wise count rates for Quadrant A Data is divided into 100 sec bins |
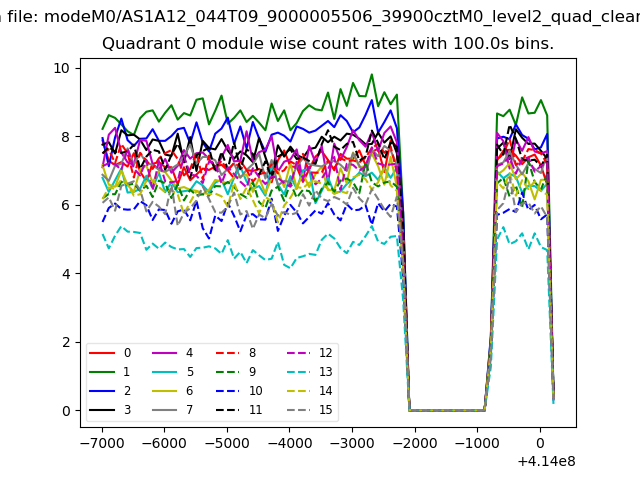 |
 |
| Module-wise count rates for Quadrant B Data is divided into 100 sec bins |
 |
 |
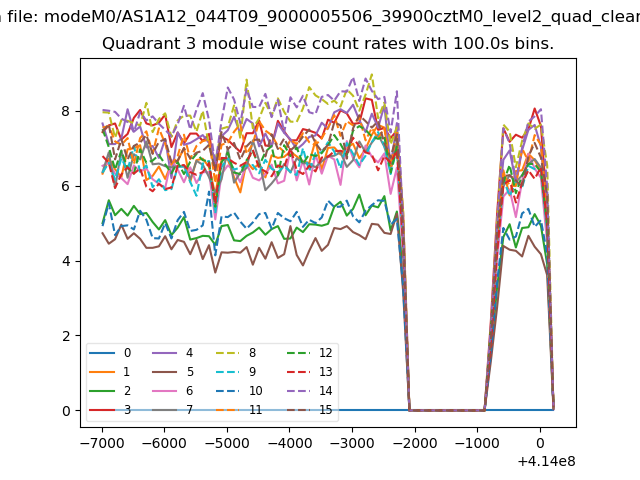
| Module-wise count rates for Quadrant C Data is divided into 100 sec bins |
 |
 |
| Module-wise count rates for Quadrant D Data is divided into 100 sec bins |
 |
 |
| Parameter | Plot |
|---|---|
| CZT HV Monitor | 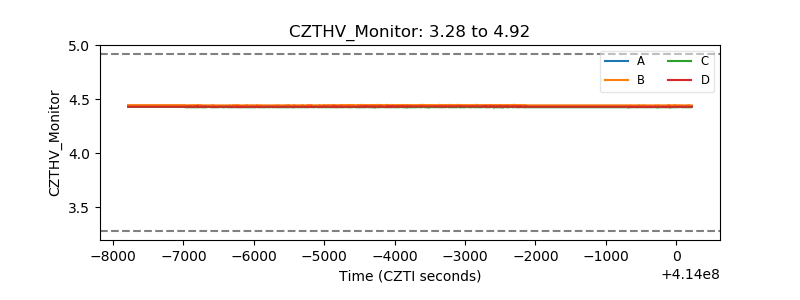 |
| D_VDD |  |
| Temperature 1 |  |
| Veto HV Monitor | 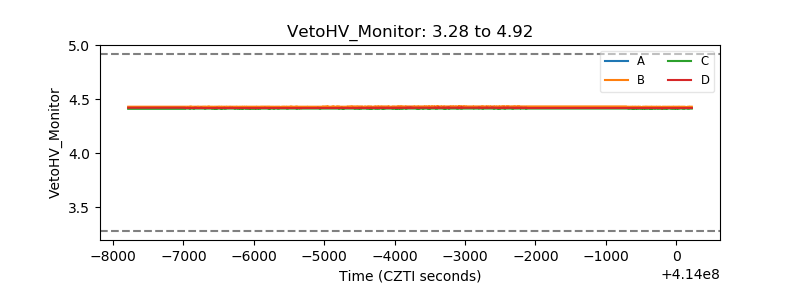 |
| Veto LLD | 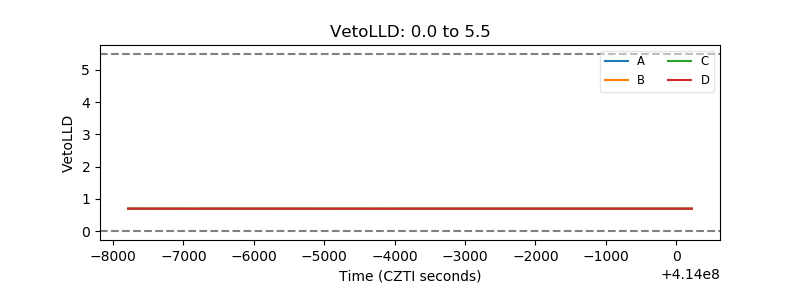 |
| Alpha Counter | 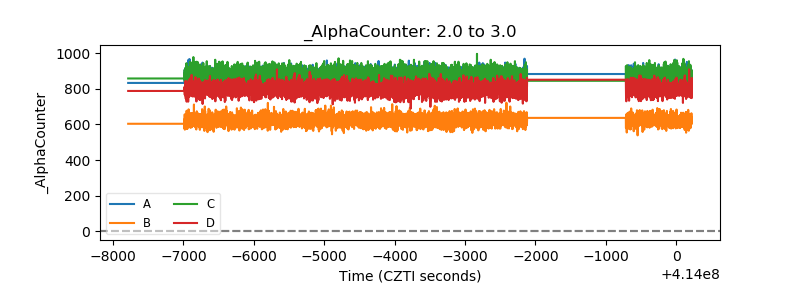 |
| _CPM_Rate | 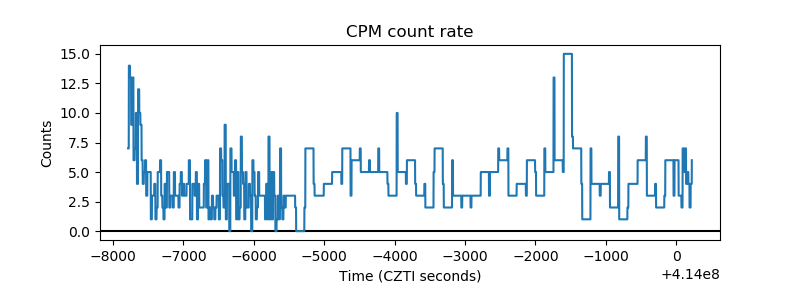 |
| CZT Counter | 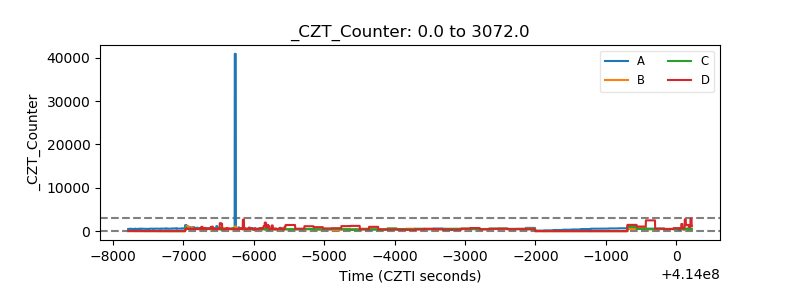 |
| +2.5 Volts monitor | 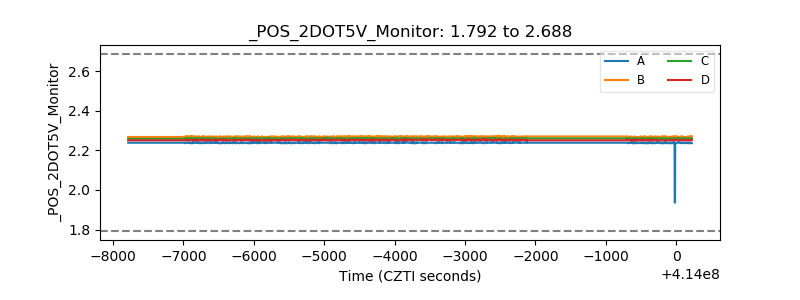 |
| +5 Volts monitor | 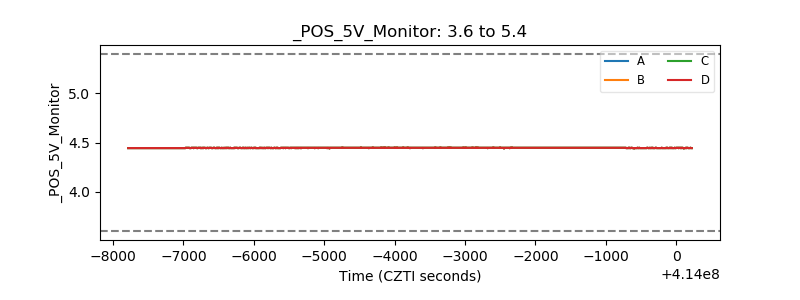 |
| _ROLL_ROT | 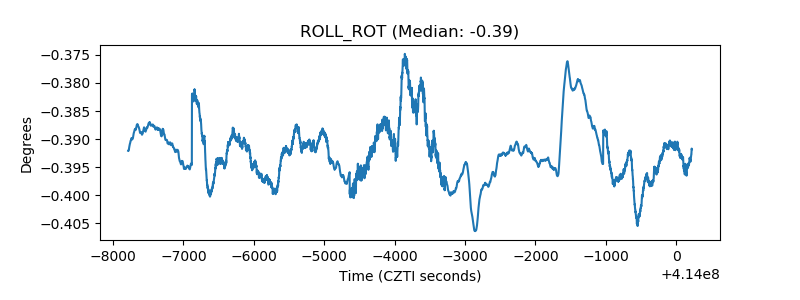 |
| _Roll_DEC |  |
| _Roll_RA | 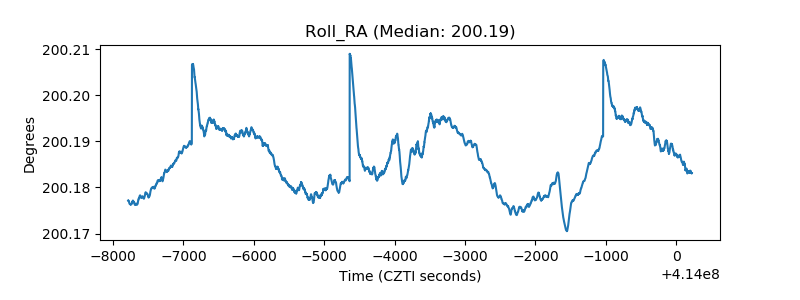 |
| Veto Counter | 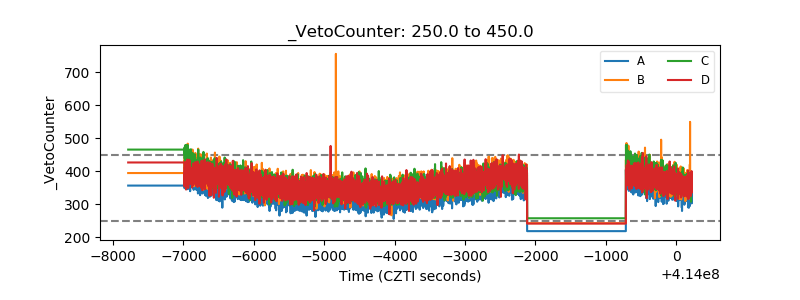 |