| Param | Original file | Final file |
|---|---|---|
| Filename | modeM0/AS1A12_044T09_9000005506_39901cztM0_level2.fits | modeM0/AS1A12_044T09_9000005506_39901cztM0_level2_quad_clean.evt |
| Size (bytes) | 410,984,640 | 94,996,800 |
| Size | 391.9 MB | 90.6 MB |
| Events in quadrant A | 3,188,038 | 649,921 |
| Events in quadrant B | 3,003,193 | 658,743 |
| Events in quadrant C | 2,905,566 | 633,267 |
| Events in quadrant D | 5,657,832 | 522,186 |
| Mode SS | |||
|---|---|---|---|
| Quadrant | BADHDUFLAG | Total packets | Discarded packets |
| A | 0 | 120 | 0 |
| B | 0 | 120 | 0 |
| C | 0 | 120 | 0 |
| D | 0 | 120 | 0 |
| Mode M9 | |||
|---|---|---|---|
| Quadrant | BADHDUFLAG | Total packets | Discarded packets |
| A | 0 | 13 | 0 |
| B | 0 | 13 | 0 |
| C | 0 | 13 | 0 |
| D | 0 | 13 | 0 |
| Mode M0 | |||
|---|---|---|---|
| Quadrant | BADHDUFLAG | Total packets | Discarded packets |
| A | 0 | 13135 | 3 |
| B | 0 | 12875 | 2 |
| C | 0 | 12183 | 2 |
| D | 0 | 20903 | 2 |
| Quadrant | Total seconds | Saturated seconds | Saturation percentage |
|---|---|---|---|
| A | 5897 | 22 | 0.373071% |
| B | 5897 | 41 | 0.695269% |
| C | 5897 | 13 | 0.220451% |
| D | 5898 | 835 | 14.157341% |
Noise dominated data is calculated using 1-second bins in cleaned event files. If a bin has >2000 counts, and if more than 50% of those come from <1% of pixels, then it is considered to be noise-dominated and hence unusable.
| Quadrant | # 1 sec bins | Bins with >0 counts | Bins with >2000 counts | High rate bins dominated by noise | Noise dominated (total time) | Noise dominated (detector-on time) | Marked lightcurve |
|---|---|---|---|---|---|---|---|
| A | 7209 | 5898 | 8 | 8 | 0.11% | 0.14% | 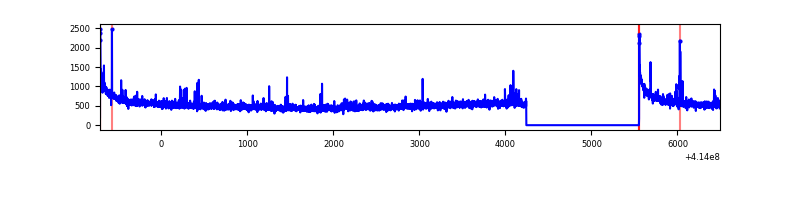 |
| B | 7209 | 5898 | 17 | 17 | 0.24% | 0.29% | 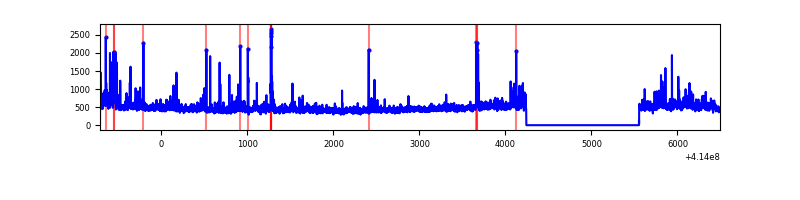 |
| C | 7209 | 5898 | 8 | 8 | 0.11% | 0.14% | 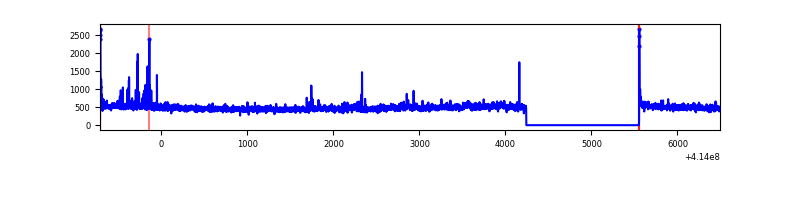 |
| D | 7210 | 5899 | 855 | 855 | 11.86% | 14.49% | 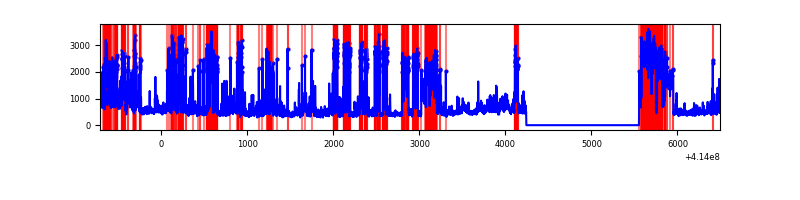 |
Top three noisy pixels from each quadrant. If the there are fewer than three noisy pixels in the level2.evt file, extra rows are filled as -1
| Pixel properties | Quadrant properties | ||||||
|---|---|---|---|---|---|---|---|
| Quadrant | DetID | PixID | Counts | Sigma | Mean | Median | Sigma |
| A | 10 | 83 | 523687 | 3877.28 | 657 | 644 | 134.9 |
| A | 15 | 223 | 33339 | 242.37 | 657 | 644 | 134.9 |
| A | 13 | 248 | 27253 | 197.25 | 657 | 644 | 134.9 |
| B | 0 | 230 | 128650 | 1014.59 | 651 | 635 | 126.2 |
| B | 5 | 255 | 62620 | 491.26 | 651 | 635 | 126.2 |
| B | 4 | 171 | 57972 | 454.43 | 651 | 635 | 126.2 |
| C | 15 | 214 | 245466 | 1618.82 | 639 | 643 | 151.2 |
| C | 3 | 233 | 43607 | 284.09 | 639 | 643 | 151.2 |
| C | 1 | 23 | 37195 | 241.69 | 639 | 643 | 151.2 |
| D | 12 | 227 | 2136615 | 14452.78 | 596 | 578 | 147.8 |
| D | 13 | 249 | 850937 | 5753.67 | 596 | 578 | 147.8 |
| D | 1 | 47 | 125807 | 847.32 | 596 | 578 | 147.8 |
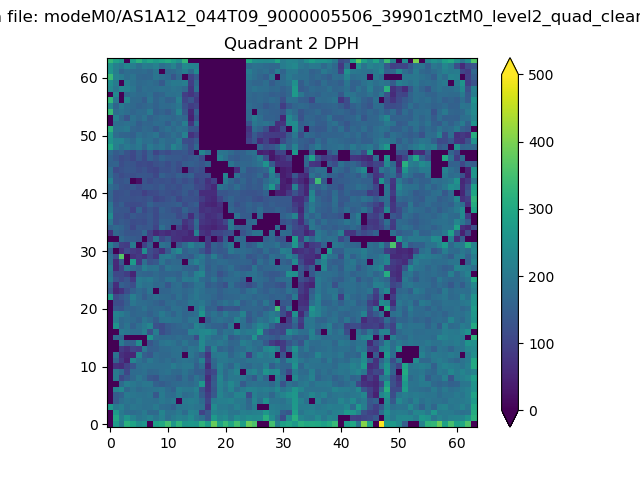
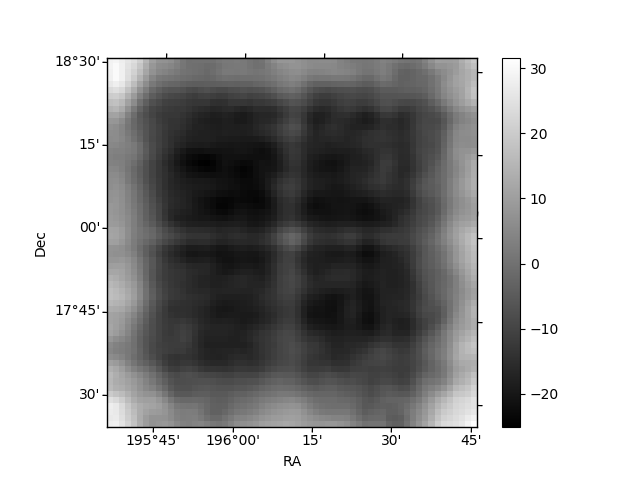
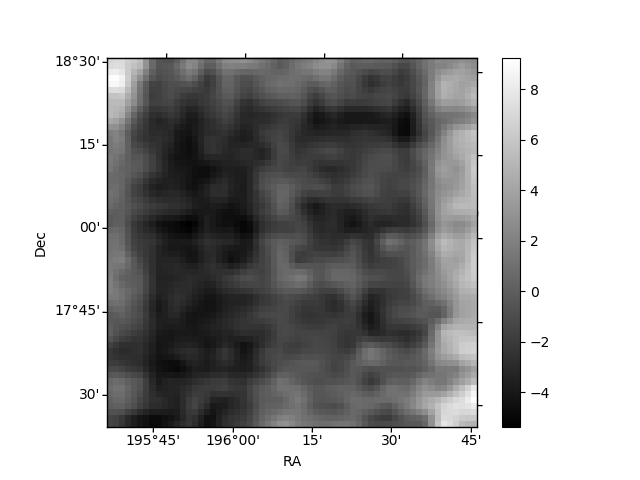
Histogram calculated using DETX and DETY for each event in the final _common_clean file
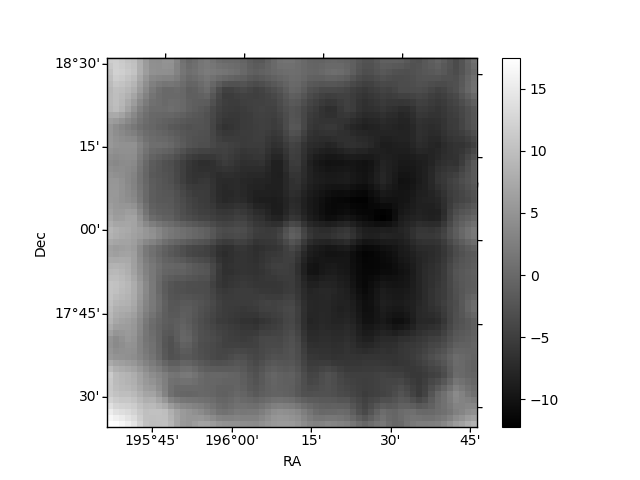
| Quadrant A | 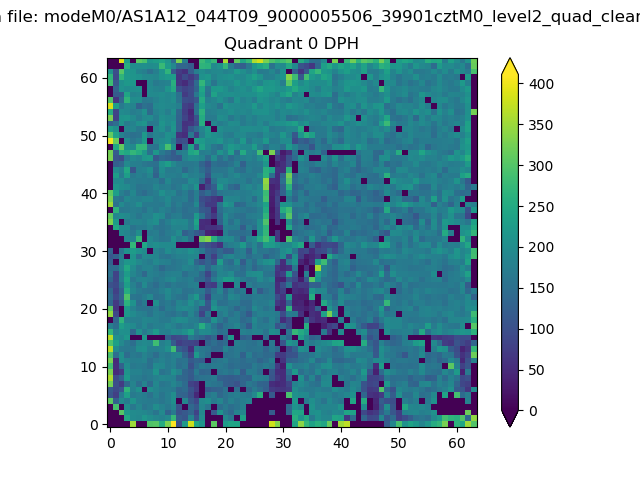 |
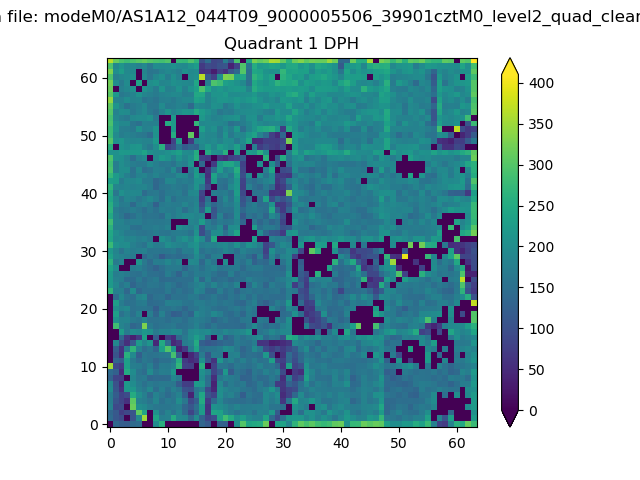 |
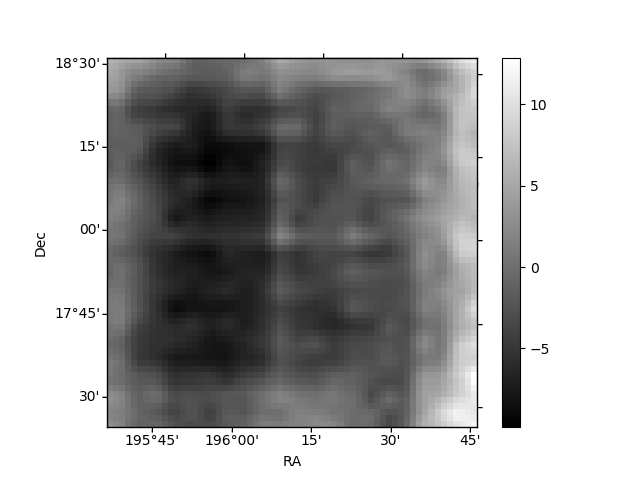
Quadrant B |
|---|---|---|---|
| Quadrant D | 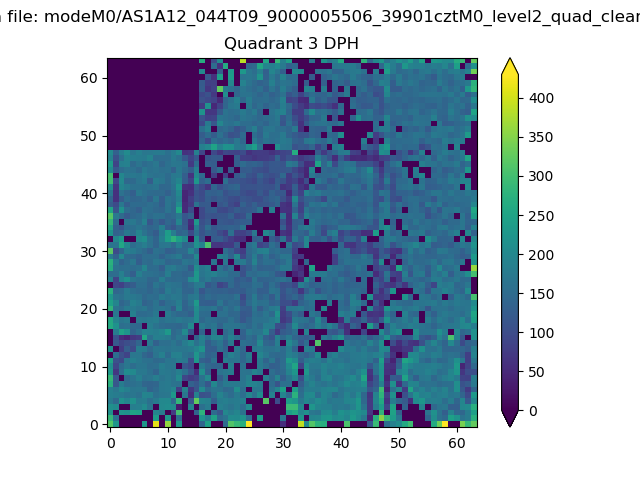 |
 |
Quadrant C |
| Plot type | Count rate plots | Images |
|---|---|---|
| Comparison with Poisson distribution Blue bars denote a histogram of data divided into 1 sec bins. Red curve is a Poisson curve with rate = median count rate of data. |
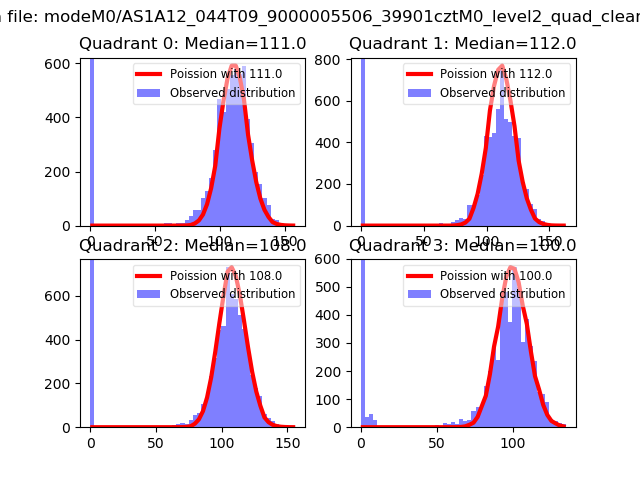 |
 |
| Quadrant-wise count rates Data is divided into 100 sec bins |
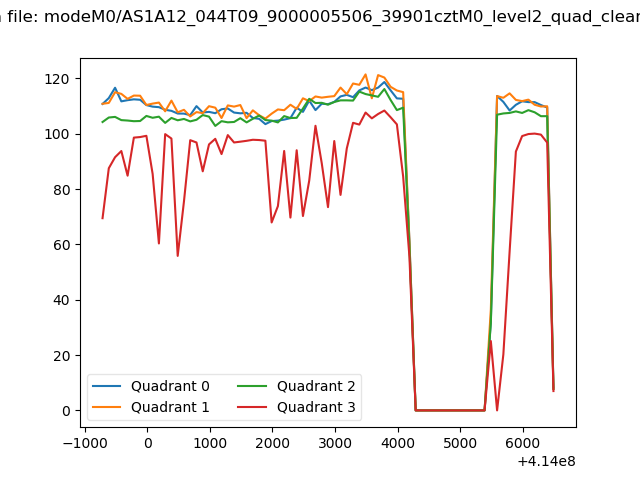 |
|
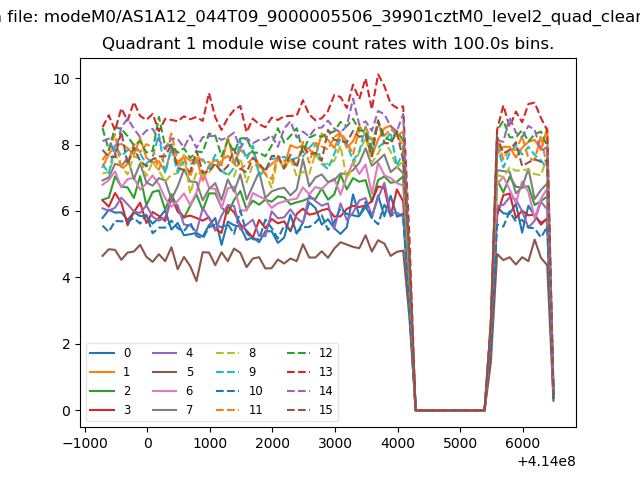
| Module-wise count rates for Quadrant A Data is divided into 100 sec bins |
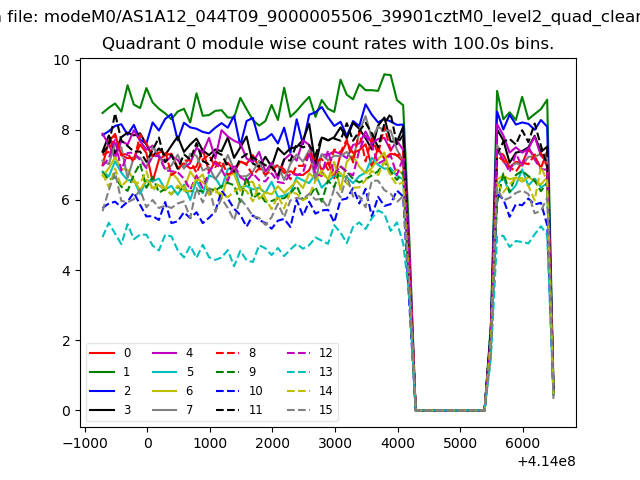 |
 |
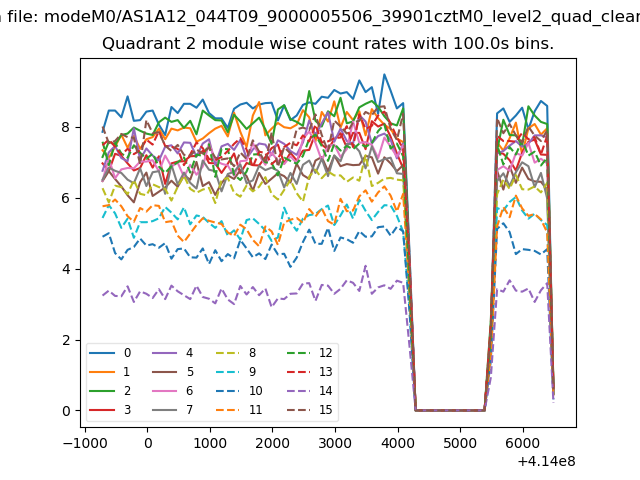
| Module-wise count rates for Quadrant B Data is divided into 100 sec bins |
 |
 |
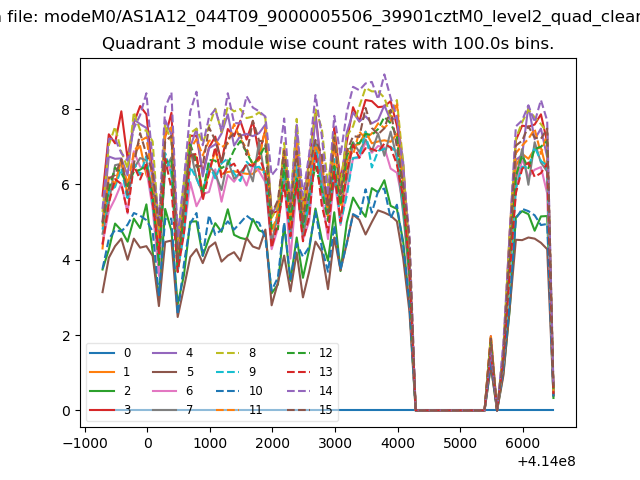
| Module-wise count rates for Quadrant C Data is divided into 100 sec bins |
 |
 |
| Module-wise count rates for Quadrant D Data is divided into 100 sec bins |
 |
 |
| Parameter | Plot |
|---|---|
| CZT HV Monitor | 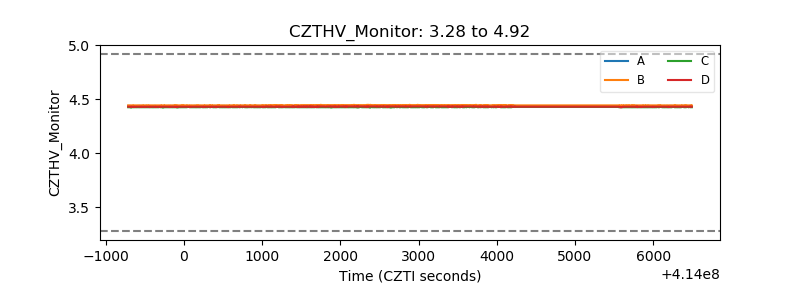 |
| D_VDD | 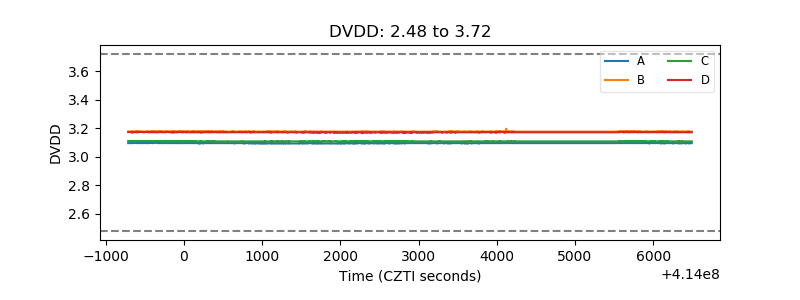 |
| Temperature 1 | 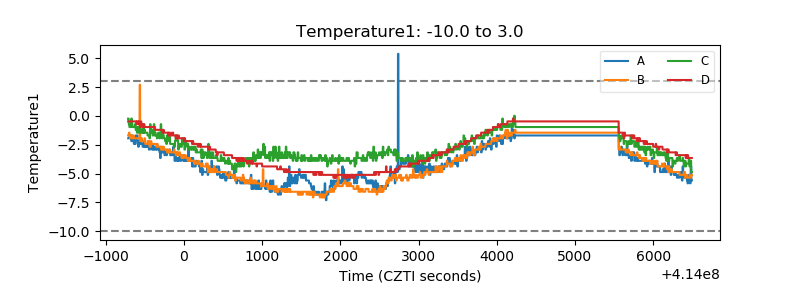 |
| Veto HV Monitor | 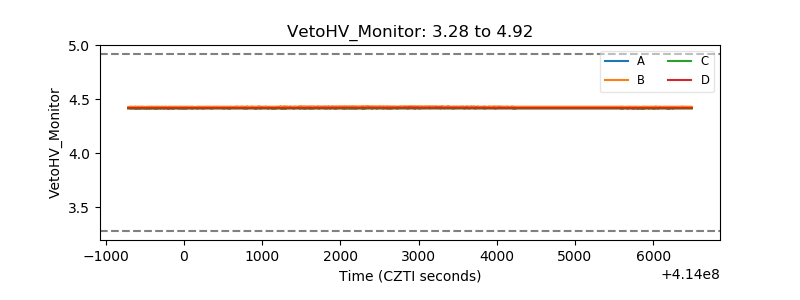 |
| Veto LLD | 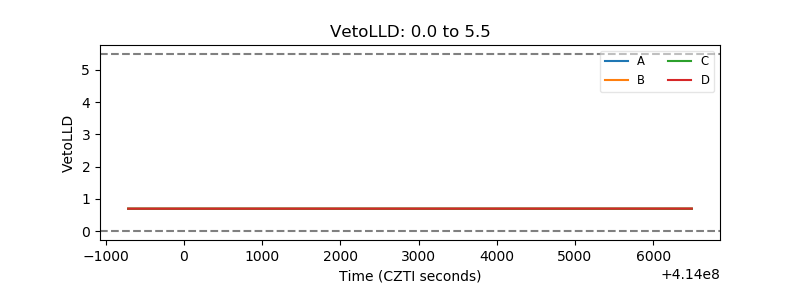 |
| Alpha Counter | 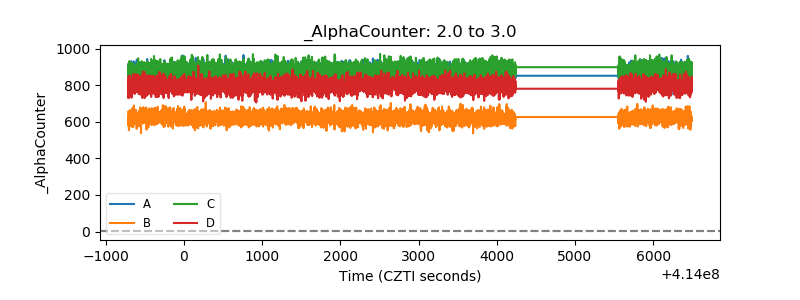 |
| _CPM_Rate | 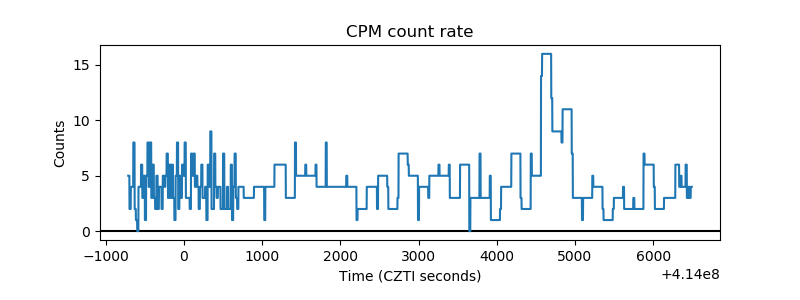 |
| CZT Counter | 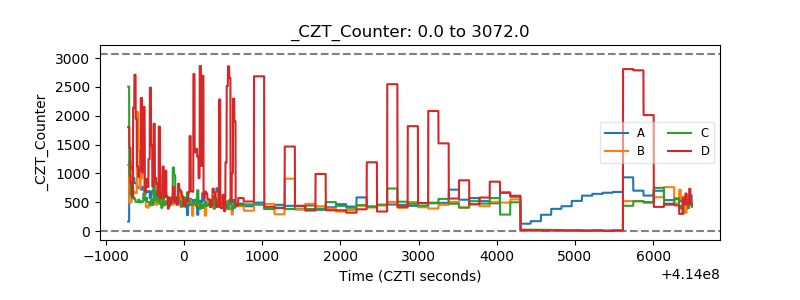 |
| +2.5 Volts monitor | 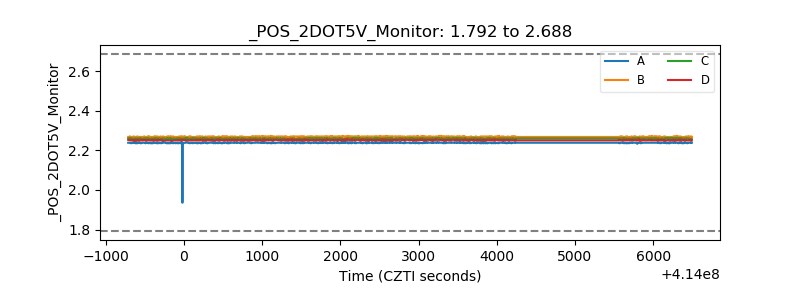 |
| +5 Volts monitor | 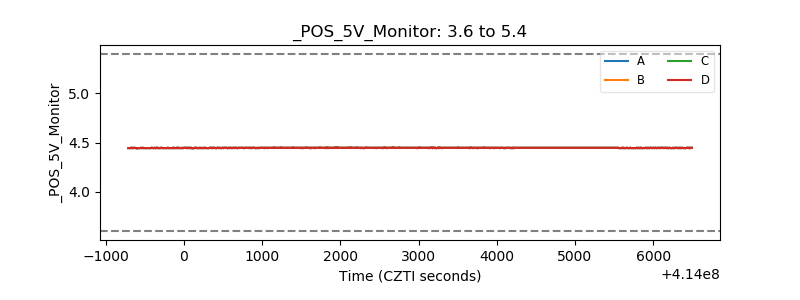 |
| _ROLL_ROT | 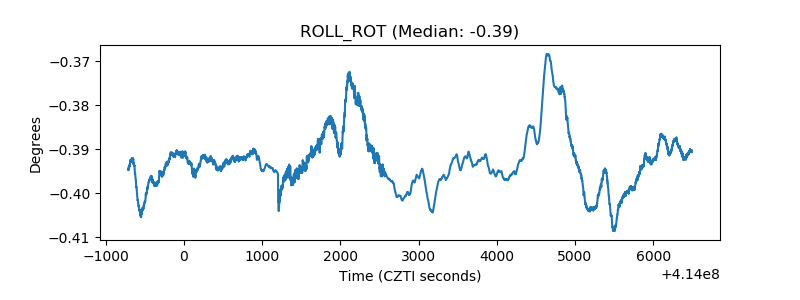 |
| _Roll_DEC | 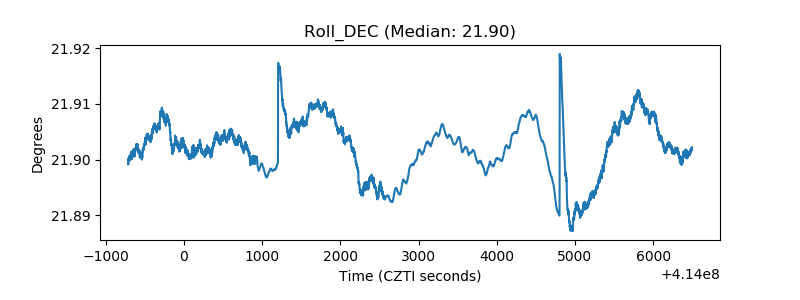 |
| _Roll_RA | 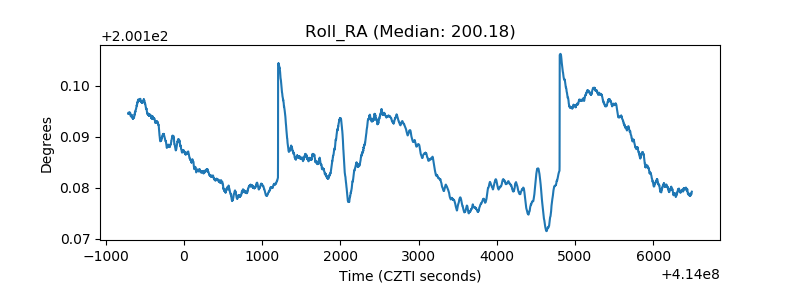 |
| Veto Counter | 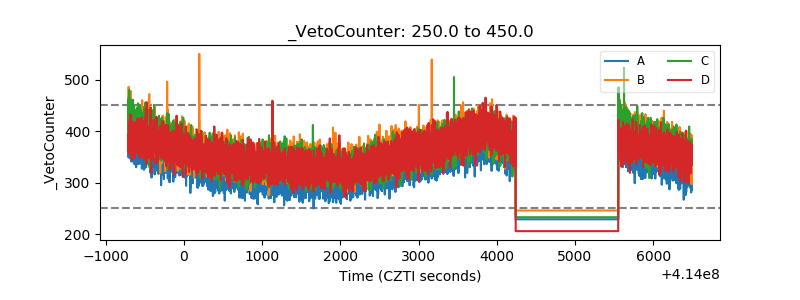 |