| Param | Original file | Final file |
|---|---|---|
| Filename | modeM0/AS1A12_044T09_9000005506_39905cztM0_level2.fits | modeM0/AS1A12_044T09_9000005506_39905cztM0_level2_quad_clean.evt |
| Size (bytes) | 484,528,320 | 126,668,160 |
| Size | 462.1 MB | 120.8 MB |
| Events in quadrant A | 4,424,697 | 845,777 |
| Events in quadrant B | 3,903,393 | 867,094 |
| Events in quadrant C | 3,638,136 | 835,194 |
| Events in quadrant D | 5,353,031 | 735,754 |
| Mode SS | |||
|---|---|---|---|
| Quadrant | BADHDUFLAG | Total packets | Discarded packets |
| A | 0 | 160 | 0 |
| B | 0 | 160 | 0 |
| C | 0 | 160 | 0 |
| D | 0 | 160 | 0 |
| Mode M9 | |||
|---|---|---|---|
| Quadrant | BADHDUFLAG | Total packets | Discarded packets |
| A | 0 | 14 | 0 |
| B | 0 | 14 | 0 |
| C | 0 | 14 | 0 |
| D | 0 | 15 | 0 |
| Mode M0 | |||
|---|---|---|---|
| Quadrant | BADHDUFLAG | Total packets | Discarded packets |
| A | 0 | 18386 | 3 |
| B | 0 | 17111 | 2 |
| C | 0 | 16043 | 2 |
| D | 0 | 21740 | 2 |
| Quadrant | Total seconds | Saturated seconds | Saturation percentage |
|---|---|---|---|
| A | 7933 | 62 | 0.781545% |
| B | 7933 | 35 | 0.441195% |
| C | 7933 | 16 | 0.201689% |
| D | 7933 | 454 | 5.722930% |
Noise dominated data is calculated using 1-second bins in cleaned event files. If a bin has >2000 counts, and if more than 50% of those come from <1% of pixels, then it is considered to be noise-dominated and hence unusable.
| Quadrant | # 1 sec bins | Bins with >0 counts | Bins with >2000 counts | High rate bins dominated by noise | Noise dominated (total time) | Noise dominated (detector-on time) | Marked lightcurve |
|---|---|---|---|---|---|---|---|
| A | 9276 | 7934 | 53 | 53 | 0.57% | 0.67% | 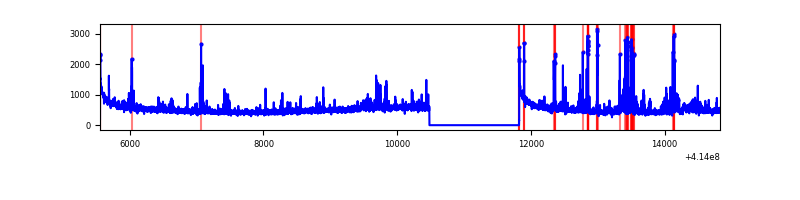 |
| B | 9276 | 7934 | 22 | 22 | 0.24% | 0.28% | 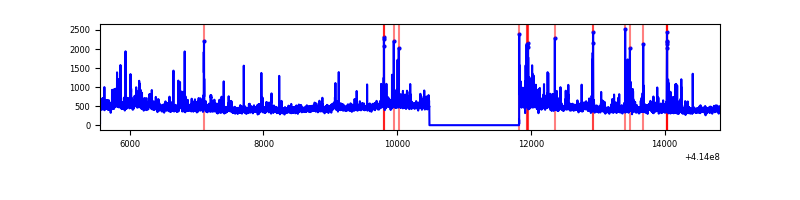 |
| C | 9276 | 7934 | 6 | 6 | 0.06% | 0.08% | 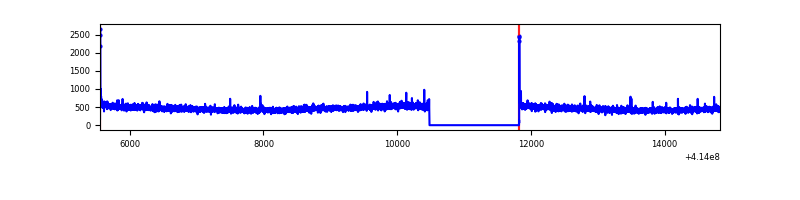 |
| D | 9276 | 7934 | 430 | 430 | 4.64% | 5.42% | 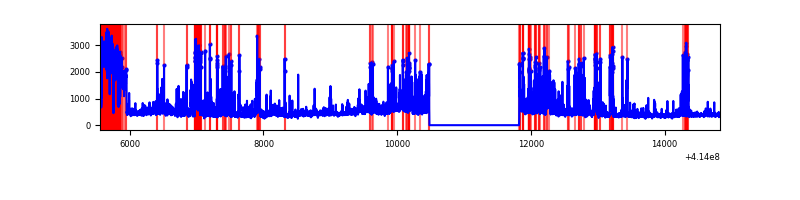 |
Top three noisy pixels from each quadrant. If the there are fewer than three noisy pixels in the level2.evt file, extra rows are filled as -1
| Pixel properties | Quadrant properties | ||||||
|---|---|---|---|---|---|---|---|
| Quadrant | DetID | PixID | Counts | Sigma | Mean | Median | Sigma |
| A | 10 | 83 | 607631 | 3486.15 | 847 | 831 | 174.1 |
| A | 6 | 10 | 254341 | 1456.45 | 847 | 831 | 174.1 |
| A | 13 | 248 | 113422 | 646.85 | 847 | 831 | 174.1 |
| B | 0 | 230 | 201043 | 1218.62 | 847 | 822 | 164.3 |
| B | 5 | 255 | 177935 | 1077.98 | 847 | 822 | 164.3 |
| B | 4 | 171 | 50335 | 301.36 | 847 | 822 | 164.3 |
| C | 15 | 214 | 336917 | 1706.57 | 835 | 839 | 196.9 |
| C | 0 | 10 | 23641 | 115.79 | 835 | 839 | 196.9 |
| C | 10 | 70 | 13047 | 61.99 | 835 | 839 | 196.9 |
| D | 13 | 249 | 911122 | 4601.64 | 803 | 781 | 197.8 |
| D | 12 | 227 | 883723 | 4463.15 | 803 | 781 | 197.8 |
| D | 2 | 250 | 203777 | 1026.12 | 803 | 781 | 197.8 |
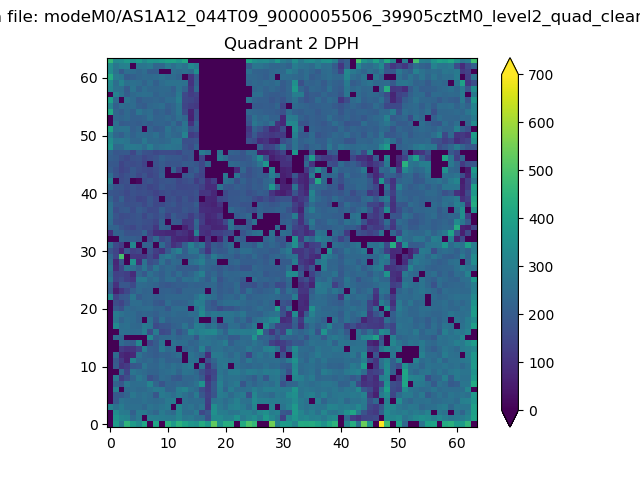
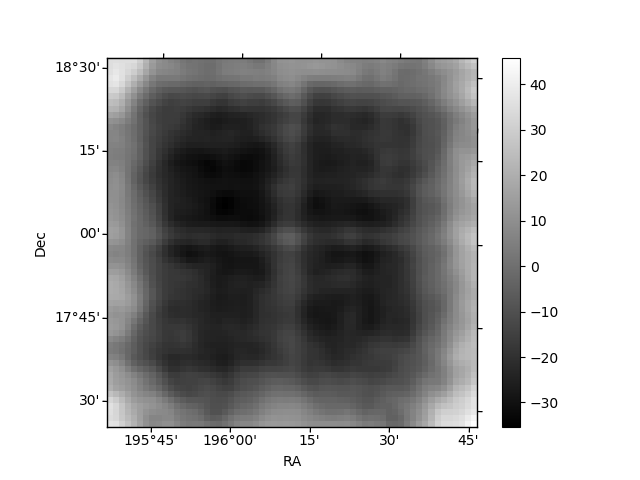
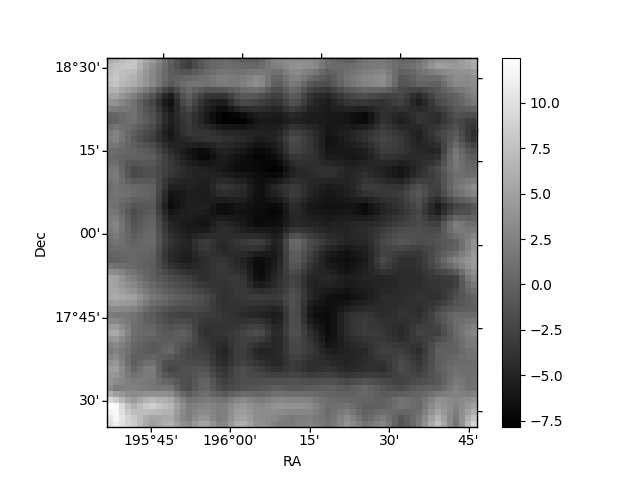
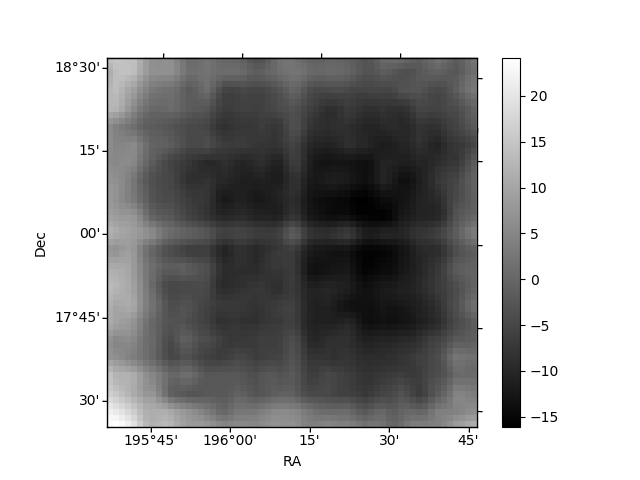
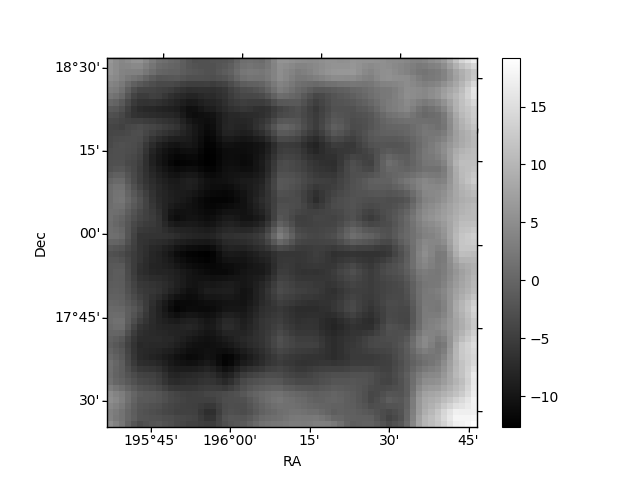
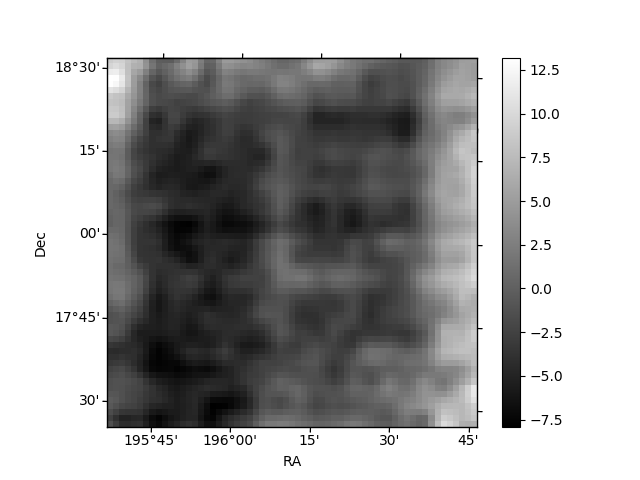
Histogram calculated using DETX and DETY for each event in the final _common_clean file
| Quadrant A | 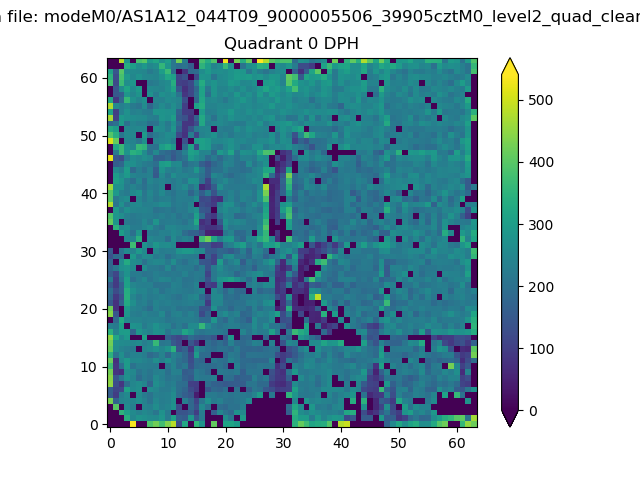 |
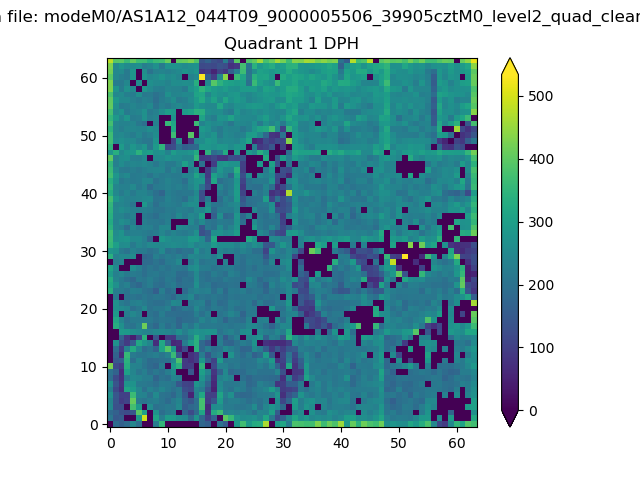 |
Quadrant B |
|---|---|---|---|
| Quadrant D | 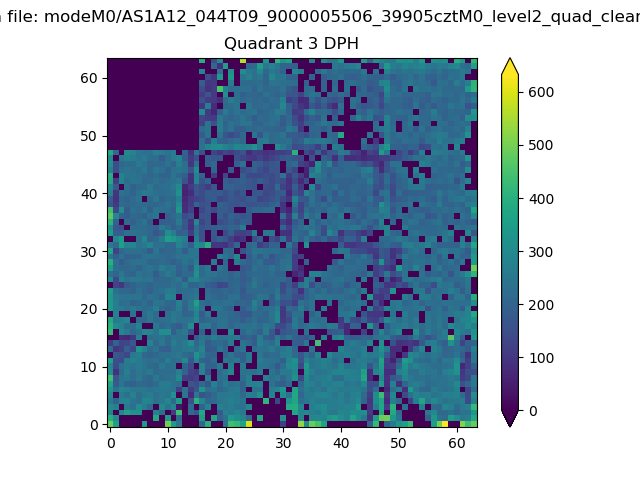 |
 |
Quadrant C |
| Plot type | Count rate plots | Images |
|---|---|---|
| Comparison with Poisson distribution Blue bars denote a histogram of data divided into 1 sec bins. Red curve is a Poisson curve with rate = median count rate of data. |
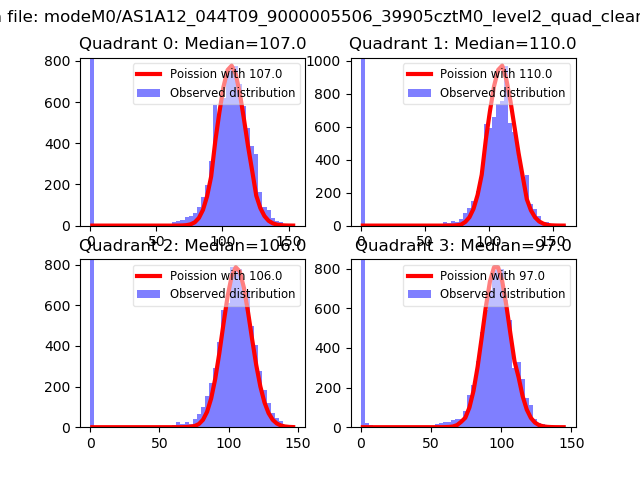 |
 |
| Quadrant-wise count rates Data is divided into 100 sec bins |
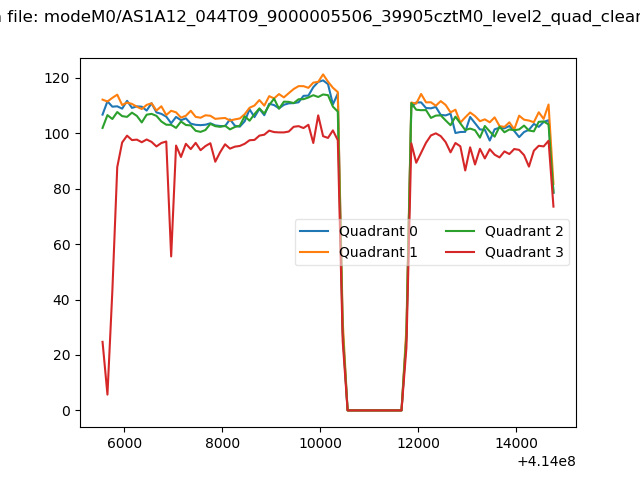 |
|
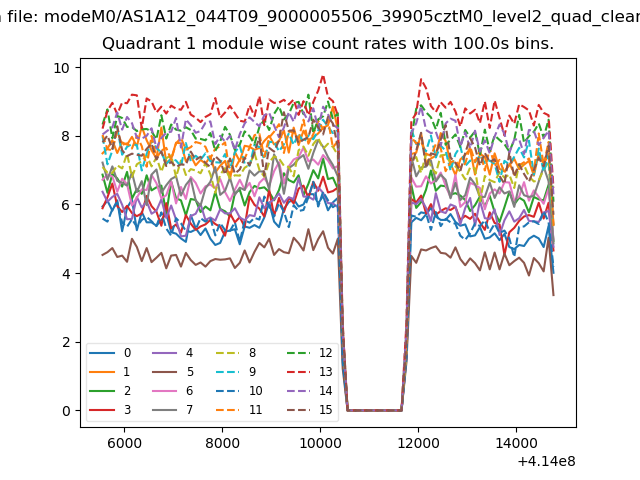
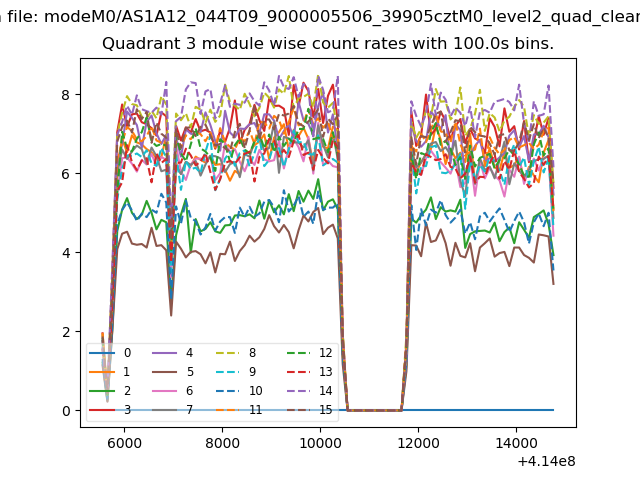
| Module-wise count rates for Quadrant A Data is divided into 100 sec bins |
 |
 |
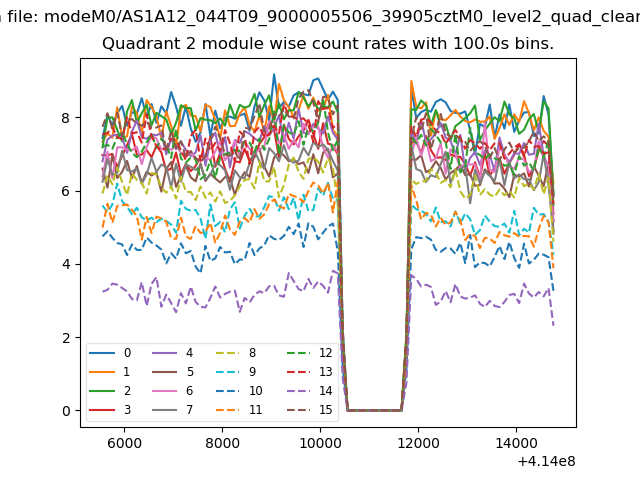
| Module-wise count rates for Quadrant B Data is divided into 100 sec bins |
 |
 |
| Module-wise count rates for Quadrant C Data is divided into 100 sec bins |
 |
 |
| Module-wise count rates for Quadrant D Data is divided into 100 sec bins |
 |
 |
| Parameter | Plot |
|---|---|
| CZT HV Monitor | 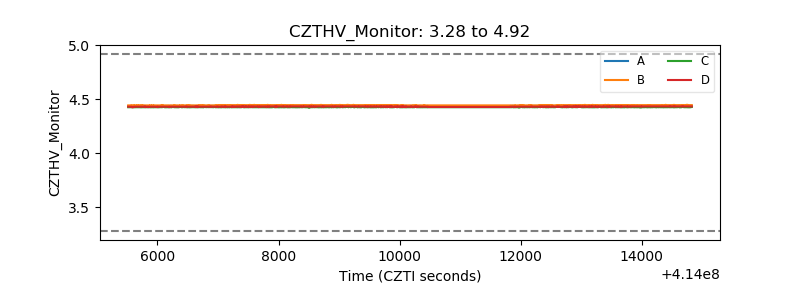 |
| D_VDD | 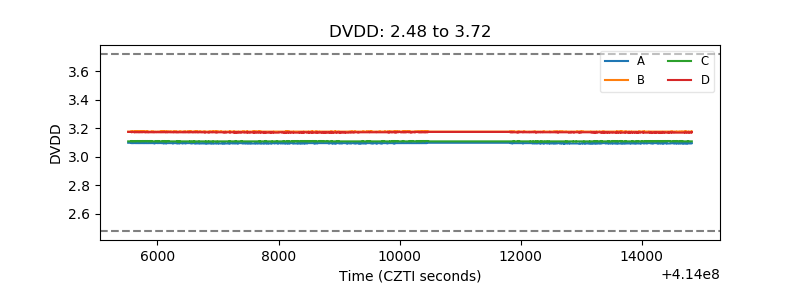 |
| Temperature 1 | 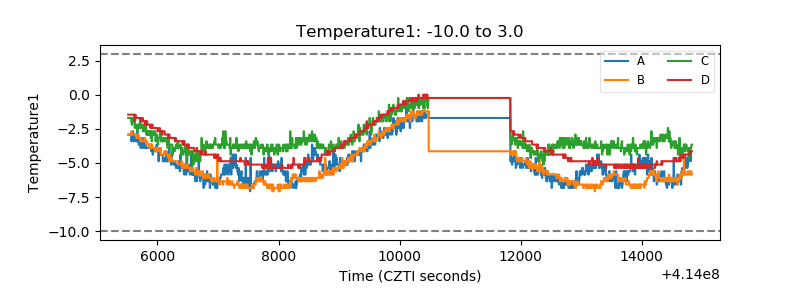 |
| Veto HV Monitor | 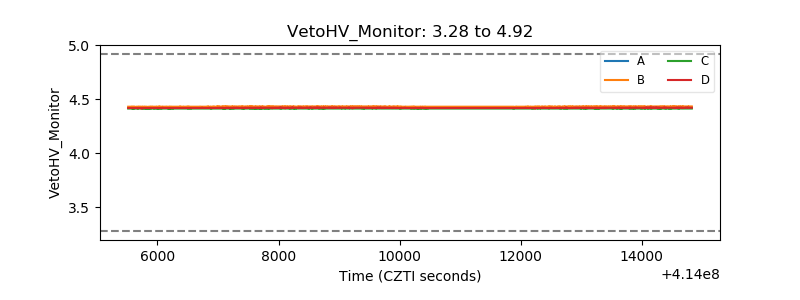 |
| Veto LLD |  |
| Alpha Counter | 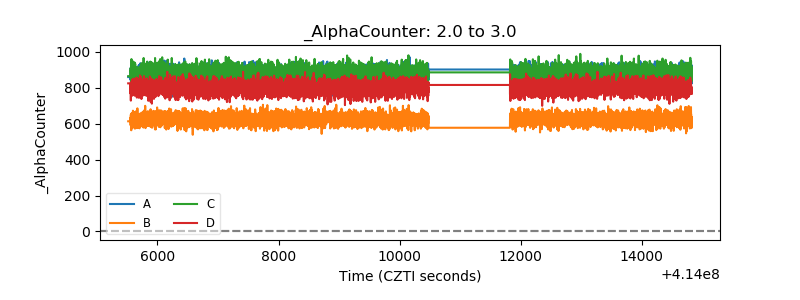 |
| _CPM_Rate | 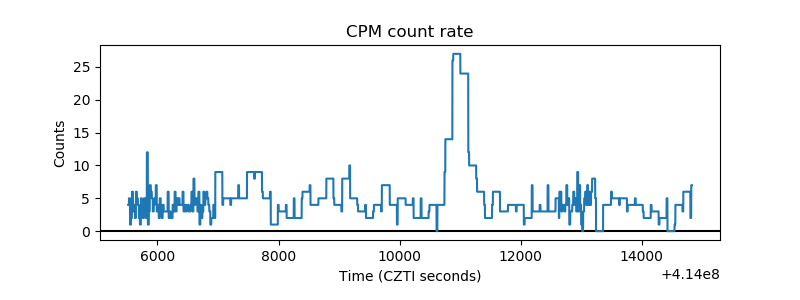 |
| CZT Counter | 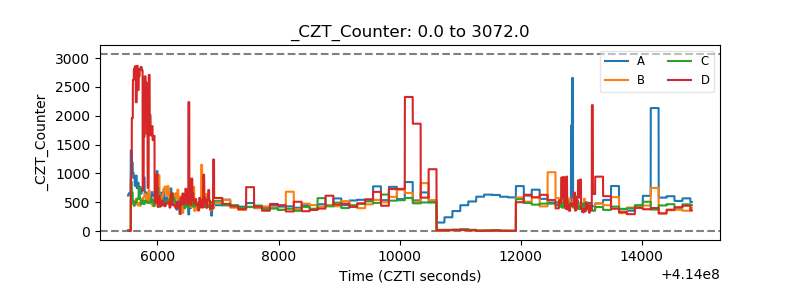 |
| +2.5 Volts monitor | 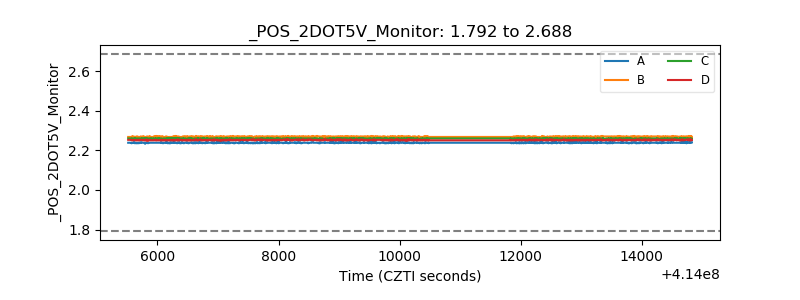 |
| +5 Volts monitor | 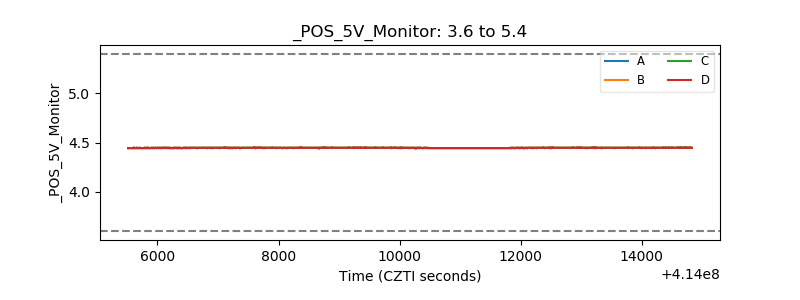 |
| _ROLL_ROT | 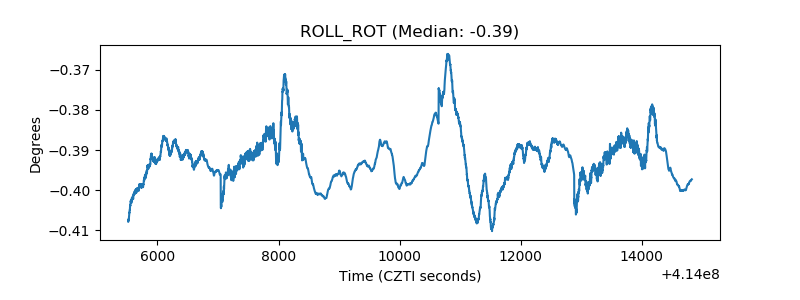 |
| _Roll_DEC | 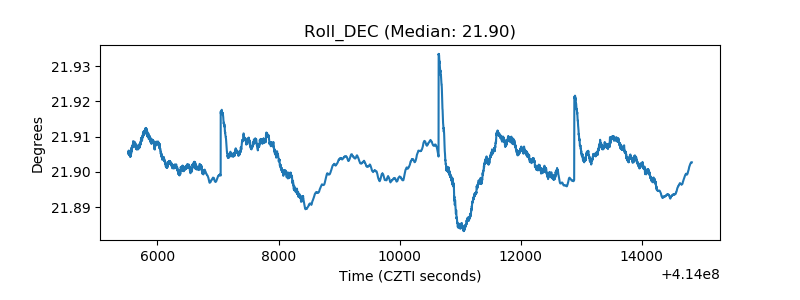 |
| _Roll_RA | 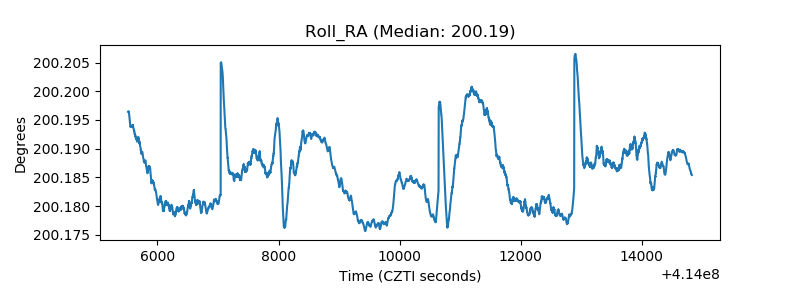 |
| Veto Counter | 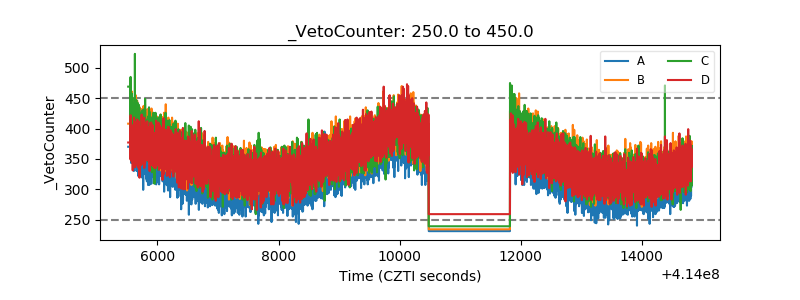 |