| Param | Original file | Final file |
|---|---|---|
| Filename | modeM0/AS1A12_044T09_9000005506_39907cztM0_level2.fits | modeM0/AS1A12_044T09_9000005506_39907cztM0_level2_quad_clean.evt |
| Size (bytes) | 513,169,920 | 119,577,600 |
| Size | 489.4 MB | 114.0 MB |
| Events in quadrant A | 4,461,461 | 816,375 |
| Events in quadrant B | 3,904,205 | 831,281 |
| Events in quadrant C | 3,601,881 | 803,868 |
| Events in quadrant D | 6,443,222 | 645,348 |
| Mode SS | |||
|---|---|---|---|
| Quadrant | BADHDUFLAG | Total packets | Discarded packets |
| A | 0 | 160 | 1 |
| B | 0 | 158 | 8 |
| C | 0 | 164 | 6 |
| D | 0 | 162 | 6 |
| Mode M9 | |||
|---|---|---|---|
| Quadrant | BADHDUFLAG | Total packets | Discarded packets |
| A | 0 | 29 | 0 |
| B | 0 | 29 | 0 |
| C | 0 | 29 | 0 |
| D | 0 | 28 | 1 |
| Mode M0 | |||
|---|---|---|---|
| Quadrant | BADHDUFLAG | Total packets | Discarded packets |
| A | 0 | 19084 | 857 |
| B | 0 | 17687 | 882 |
| C | 0 | 16243 | 786 |
| D | 0 | 25898 | 1547 |
| Quadrant | Total seconds | Saturated seconds | Saturation percentage |
|---|---|---|---|
| A | 7561 | 73 | 0.965481% |
| B | 7531 | 72 | 0.956048% |
| C | 7526 | 30 | 0.398618% |
| D | 7464 | 1055 | 14.134512% |
Noise dominated data is calculated using 1-second bins in cleaned event files. If a bin has >2000 counts, and if more than 50% of those come from <1% of pixels, then it is considered to be noise-dominated and hence unusable.
| Quadrant | # 1 sec bins | Bins with >0 counts | Bins with >2000 counts | High rate bins dominated by noise | Noise dominated (total time) | Noise dominated (detector-on time) | Marked lightcurve |
|---|---|---|---|---|---|---|---|
| A | 10940 | 7793 | 46 | 46 | 0.42% | 0.59% | 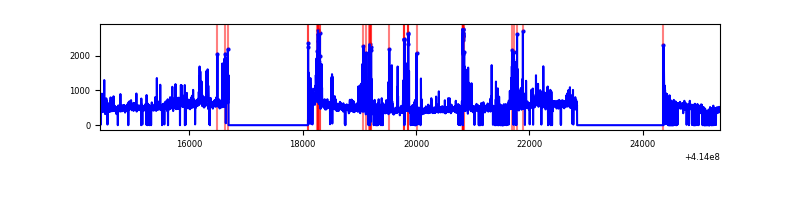 |
| B | 10940 | 7781 | 44 | 44 | 0.40% | 0.57% | 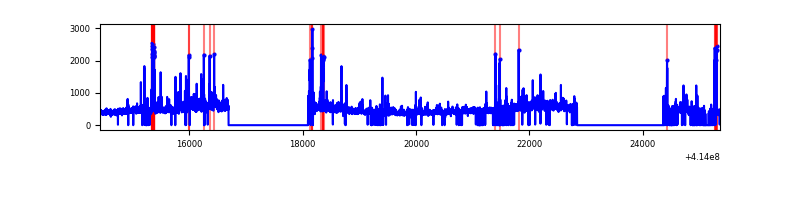 |
| C | 10940 | 7768 | 23 | 23 | 0.21% | 0.30% | 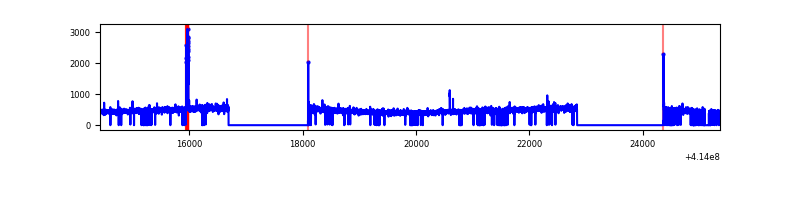 |
| D | 10940 | 7770 | 981 | 981 | 8.97% | 12.63% | 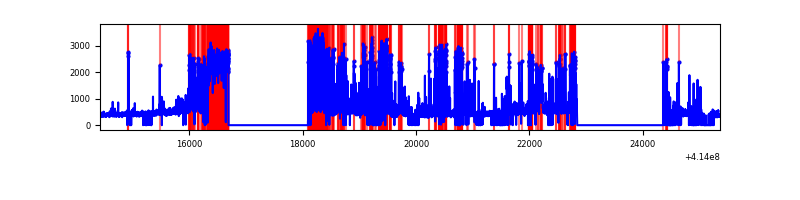 |
Top three noisy pixels from each quadrant. If the there are fewer than three noisy pixels in the level2.evt file, extra rows are filled as -1
| Pixel properties | Quadrant properties | ||||||
|---|---|---|---|---|---|---|---|
| Quadrant | DetID | PixID | Counts | Sigma | Mean | Median | Sigma |
| A | 10 | 83 | 558437 | 3232.71 | 844 | 825 | 172.5 |
| A | 6 | 10 | 520274 | 3011.46 | 844 | 825 | 172.5 |
| A | 13 | 248 | 78686 | 451.39 | 844 | 825 | 172.5 |
| B | 5 | 255 | 215209 | 1324.95 | 834 | 810 | 161.8 |
| B | 0 | 230 | 193922 | 1193.4 | 834 | 810 | 161.8 |
| B | 4 | 171 | 85572 | 523.81 | 834 | 810 | 161.8 |
| C | 15 | 214 | 329270 | 1720.84 | 816 | 820 | 190.9 |
| C | 14 | 254 | 72531 | 375.71 | 816 | 820 | 190.9 |
| C | 0 | 10 | 11158 | 54.16 | 816 | 820 | 190.9 |
| D | 12 | 227 | 1766414 | 9491.14 | 756 | 733 | 186.0 |
| D | 12 | 233 | 580954 | 3118.89 | 756 | 733 | 186.0 |
| D | 2 | 250 | 447955 | 2403.97 | 756 | 733 | 186.0 |
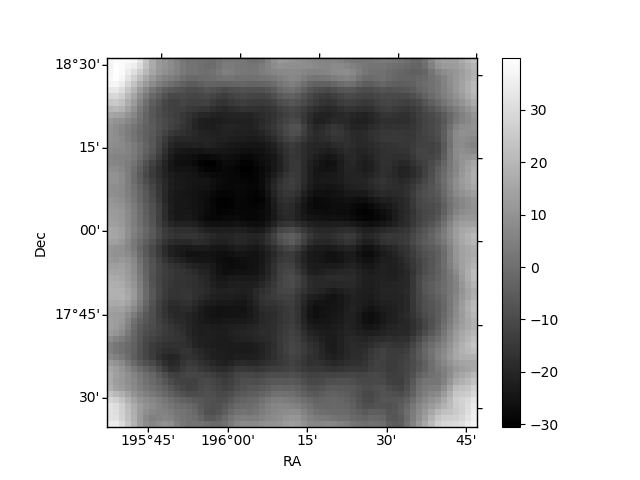
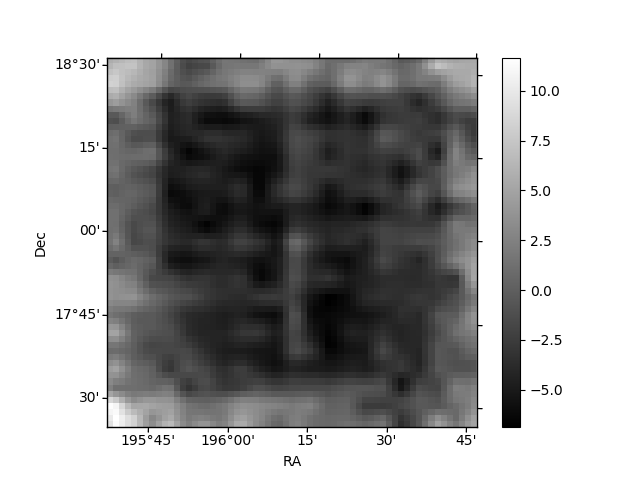
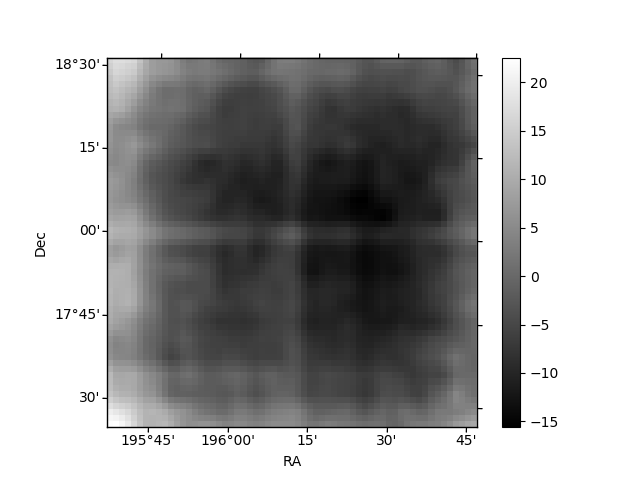
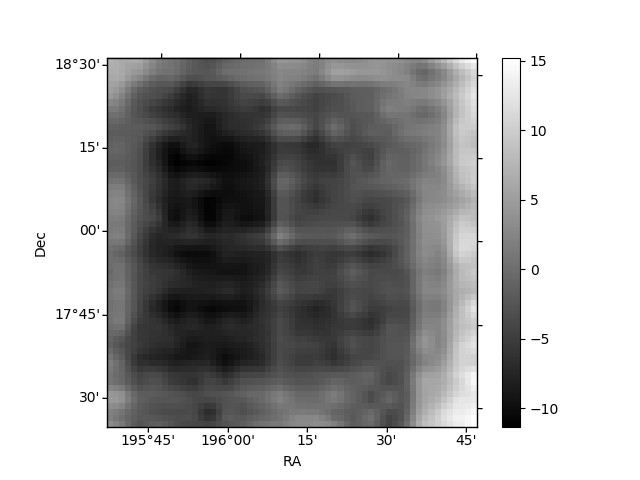
Histogram calculated using DETX and DETY for each event in the final _common_clean file
| Quadrant A | 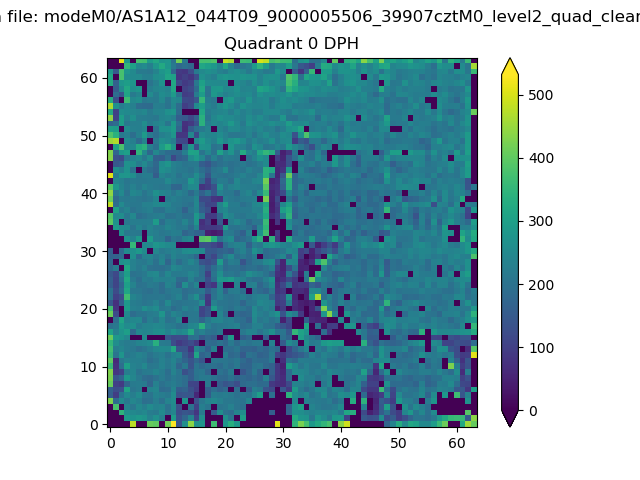 |
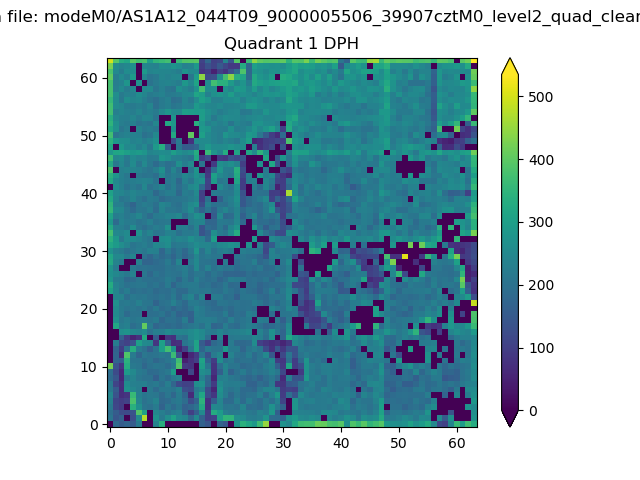 |
Quadrant B |
|---|---|---|---|
| Quadrant D | 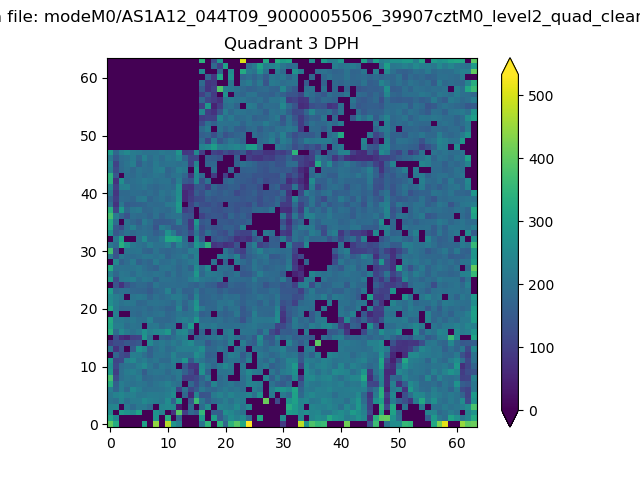 |
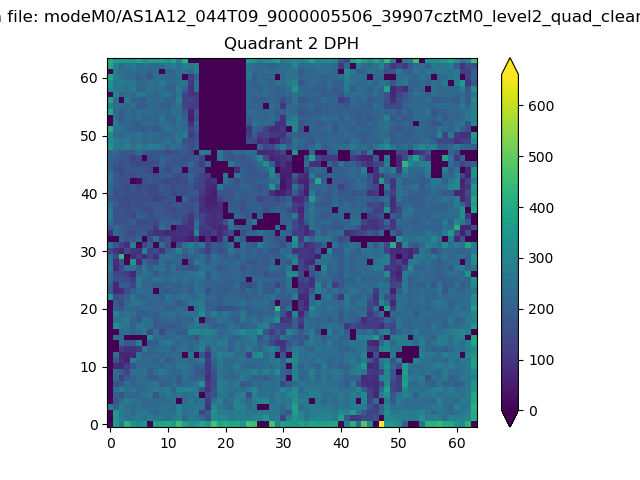 |
Quadrant C |
| Plot type | Count rate plots | Images |
|---|---|---|
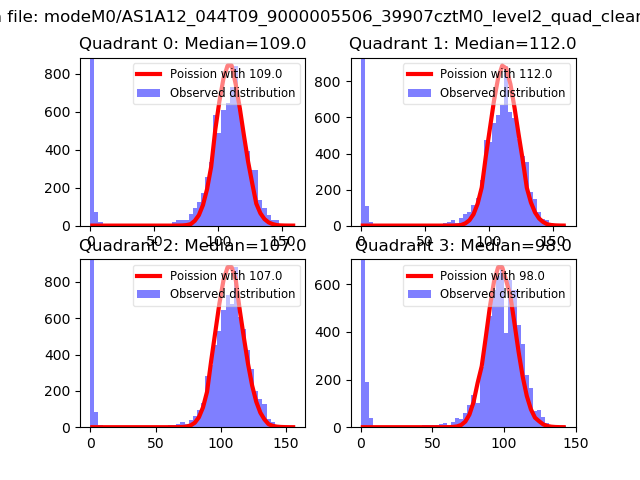
| Comparison with Poisson distribution Blue bars denote a histogram of data divided into 1 sec bins. Red curve is a Poisson curve with rate = median count rate of data. |
 |
 |
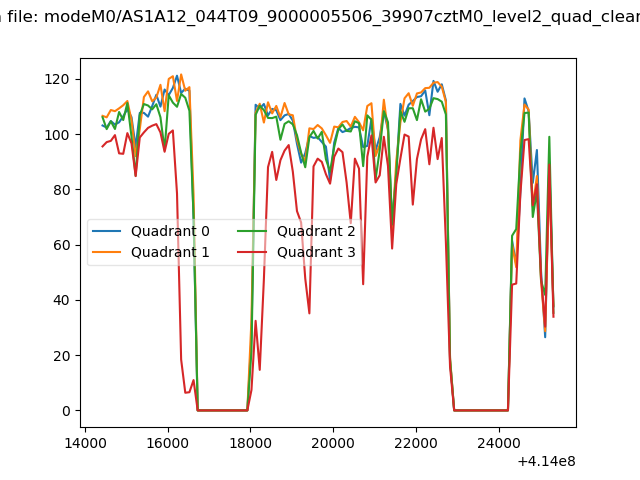
| Quadrant-wise count rates Data is divided into 100 sec bins |
 |
|
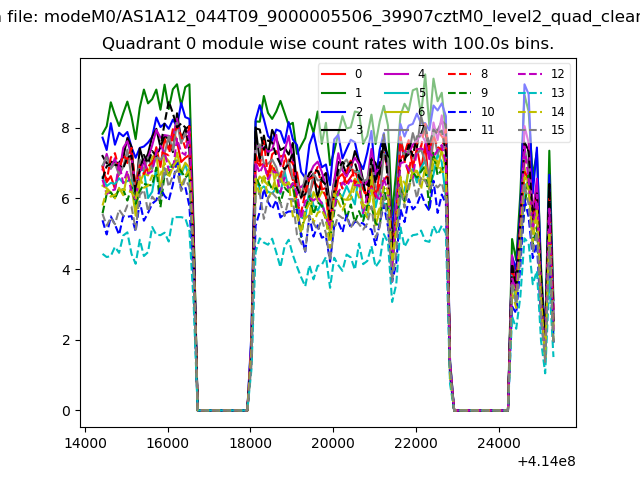
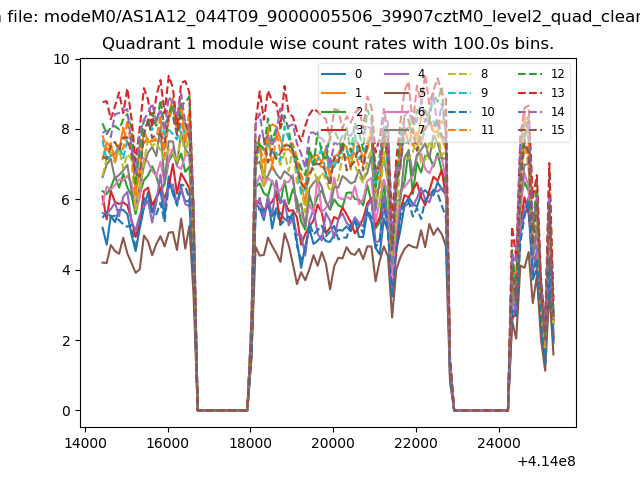
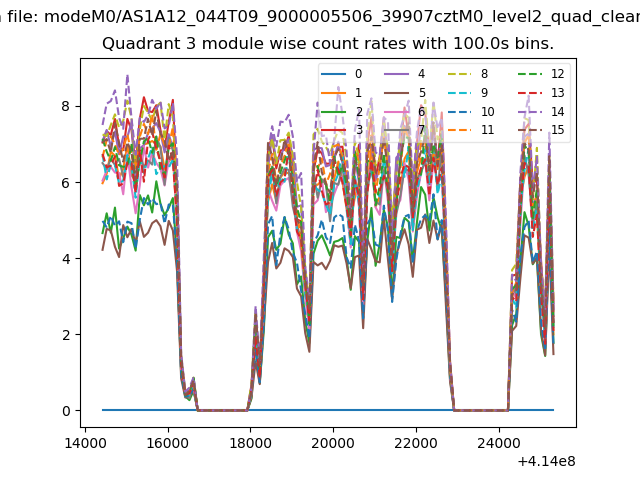
| Module-wise count rates for Quadrant A Data is divided into 100 sec bins |
 |
 |
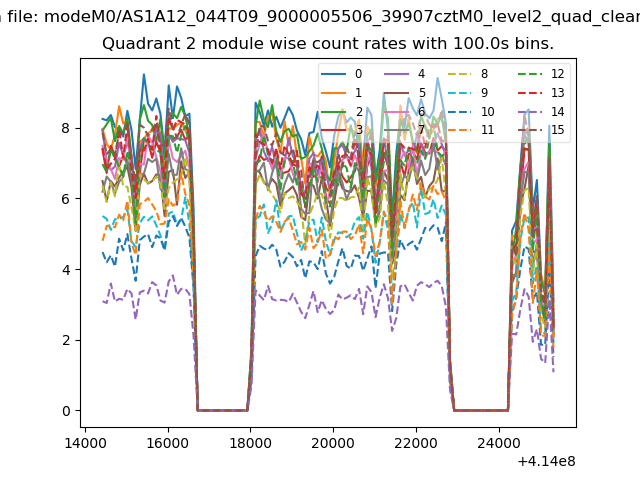
| Module-wise count rates for Quadrant B Data is divided into 100 sec bins |
 |
 |
| Module-wise count rates for Quadrant C Data is divided into 100 sec bins |
 |
 |
| Module-wise count rates for Quadrant D Data is divided into 100 sec bins |
 |
 |
| Parameter | Plot |
|---|---|
| CZT HV Monitor | 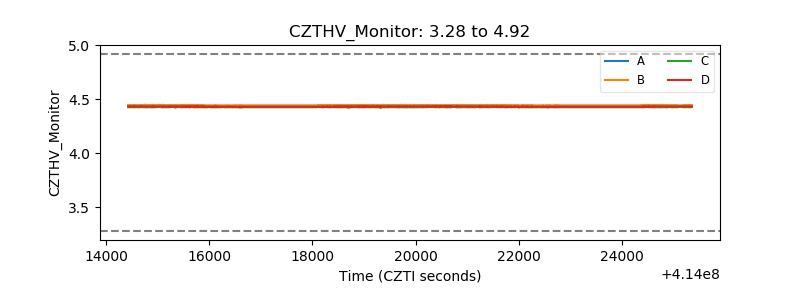 |
| D_VDD | 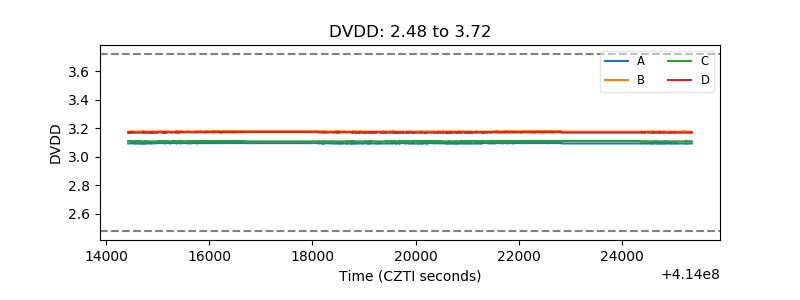 |
| Temperature 1 | 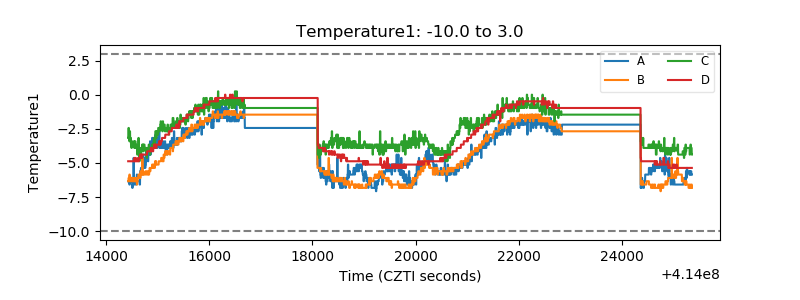 |
| Veto HV Monitor | 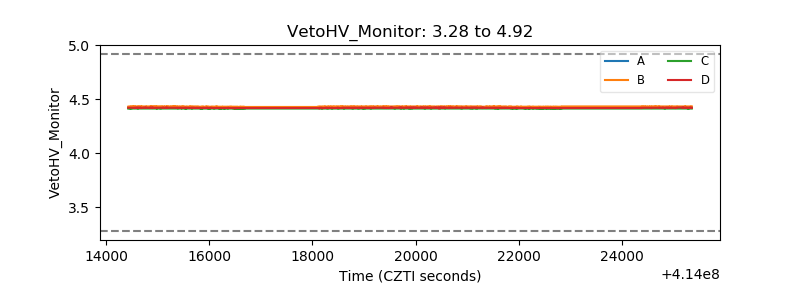 |
| Veto LLD |  |
| Alpha Counter | 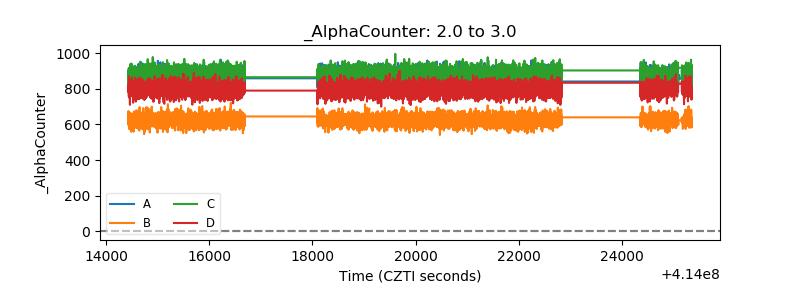 |
| _CPM_Rate | 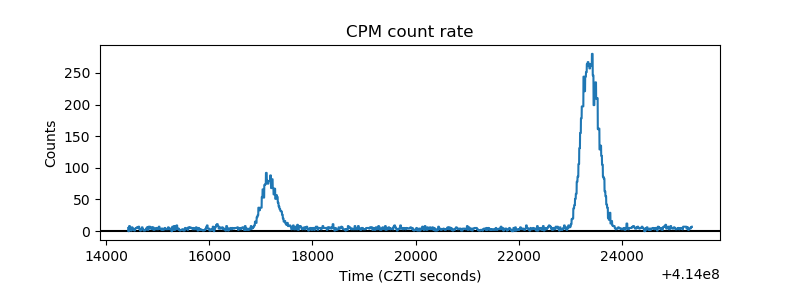 |
| CZT Counter | 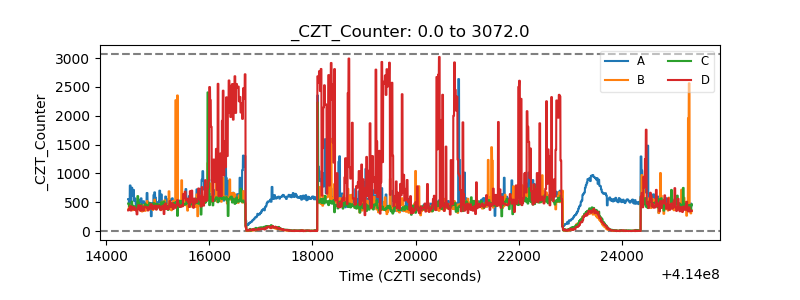 |
| +2.5 Volts monitor | 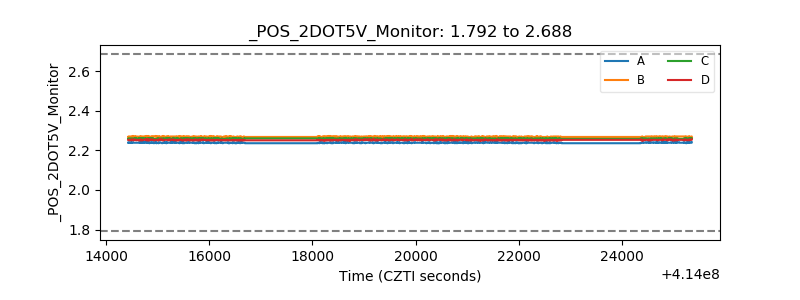 |
| +5 Volts monitor | 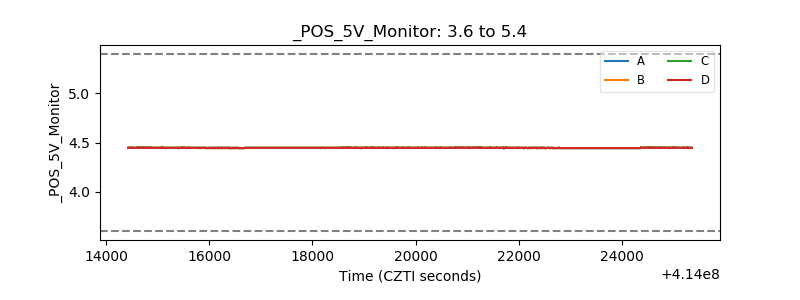 |
| _ROLL_ROT | 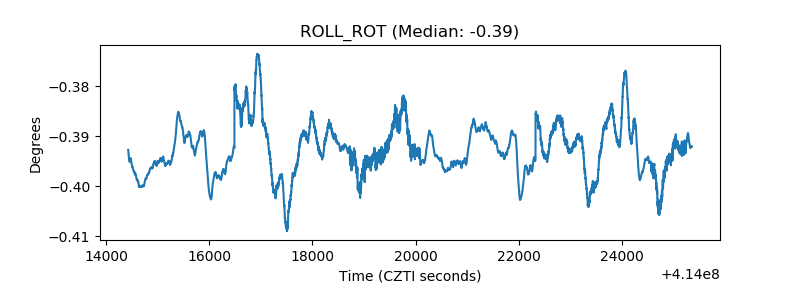 |
| _Roll_DEC | 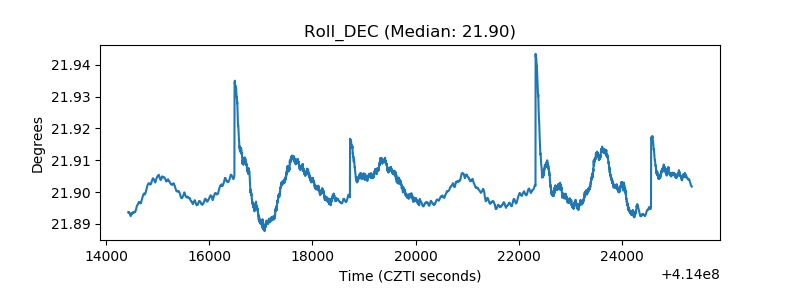 |
| _Roll_RA | 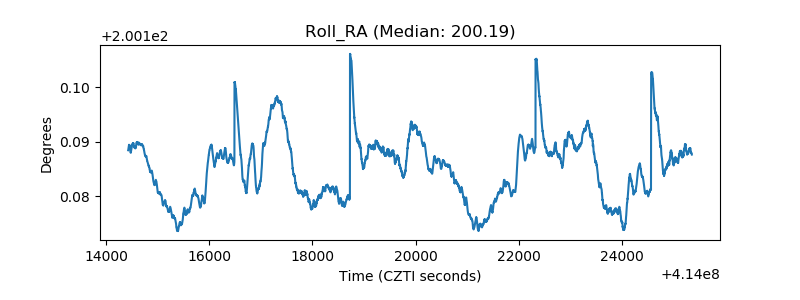 |
| Veto Counter | 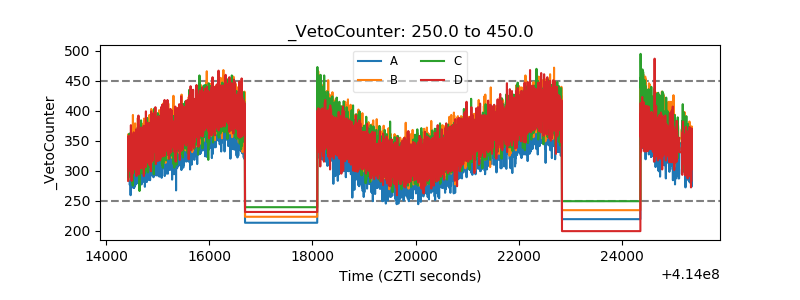 |