| Param | Original file | Final file |
|---|---|---|
| Filename | modeM0/AS1A12_068T03_9000005508_39907cztM0_level2.fits | modeM0/AS1A12_068T03_9000005508_39907cztM0_level2_quad_clean.evt |
| Size (bytes) | 516,571,200 | 127,189,440 |
| Size | 492.6 MB | 121.3 MB |
| Events in quadrant A | 6,381,151 | 763,202 |
| Events in quadrant B | 3,840,913 | 904,778 |
| Events in quadrant C | 3,735,855 | 865,827 |
| Events in quadrant D | 4,549,912 | 767,707 |
| Mode M9 | |||
|---|---|---|---|
| Quadrant | BADHDUFLAG | Total packets | Discarded packets |
| A | 0 | 33 | 2 |
| B | 0 | 33 | 2 |
| C | 0 | 34 | 3 |
| D | 0 | 33 | 1 |
| Mode M0 | |||
|---|---|---|---|
| Quadrant | BADHDUFLAG | Total packets | Discarded packets |
| A | 0 | 26802 | 2799 |
| B | 0 | 18348 | 1528 |
| C | 0 | 17473 | 1440 |
| D | 0 | 21462 | 2086 |
| Mode SS | |||
|---|---|---|---|
| Quadrant | BADHDUFLAG | Total packets | Discarded packets |
| A | 0 | 175 | 10 |
| B | 0 | 180 | 14 |
| C | 0 | 178 | 10 |
| D | 0 | 177 | 10 |
| Quadrant | Total seconds | Saturated seconds | Saturation percentage |
|---|---|---|---|
| A | 7802 | 931 | 11.932838% |
| B | 7939 | 25 | 0.314901% |
| C | 7918 | 7 | 0.088406% |
| D | 7883 | 239 | 3.031841% |
Noise dominated data is calculated using 1-second bins in cleaned event files. If a bin has >2000 counts, and if more than 50% of those come from <1% of pixels, then it is considered to be noise-dominated and hence unusable.
| Quadrant | # 1 sec bins | Bins with >0 counts | Bins with >2000 counts | High rate bins dominated by noise | Noise dominated (total time) | Noise dominated (detector-on time) | Marked lightcurve |
|---|---|---|---|---|---|---|---|
| A | 12192 | 8192 | 845 | 845 | 6.93% | 10.31% | 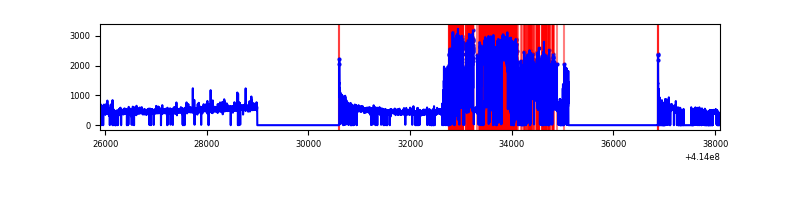 |
| B | 12195 | 8245 | 11 | 11 | 0.09% | 0.13% | 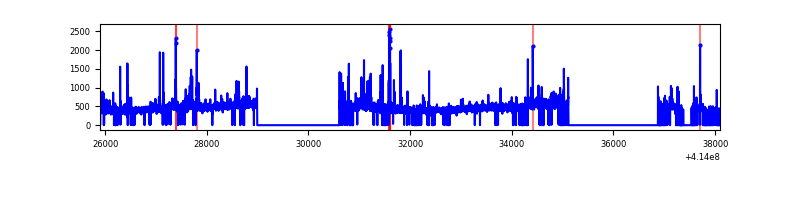 |
| C | 12195 | 8225 | 4 | 4 | 0.03% | 0.05% | 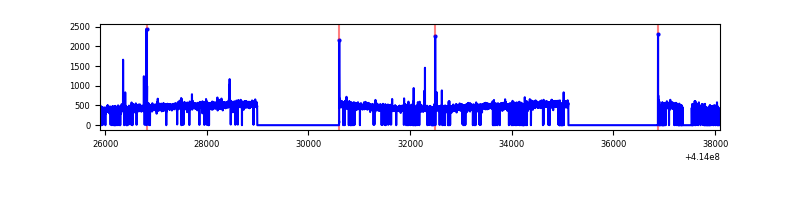 |
| D | 12157 | 8222 | 200 | 200 | 1.65% | 2.43% | 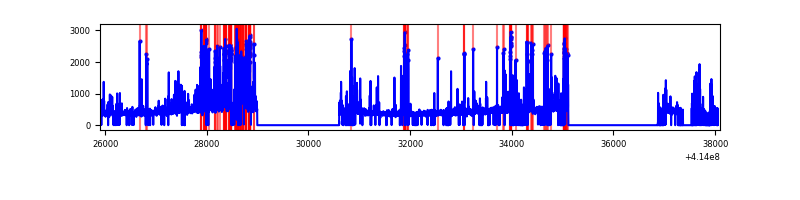 |
Top three noisy pixels from each quadrant. If the there are fewer than three noisy pixels in the level2.evt file, extra rows are filled as -1
| Pixel properties | Quadrant properties | ||||||
|---|---|---|---|---|---|---|---|
| Quadrant | DetID | PixID | Counts | Sigma | Mean | Median | Sigma |
| A | 6 | 10 | 2675838 | 16153.37 | 811 | 794 | 165.6 |
| A | 10 | 83 | 499642 | 3012.32 | 811 | 794 | 165.6 |
| A | 13 | 248 | 29180 | 171.41 | 811 | 794 | 165.6 |
| B | 5 | 255 | 97305 | 570.74 | 875 | 850 | 169.0 |
| B | 0 | 229 | 91596 | 536.96 | 875 | 850 | 169.0 |
| B | 0 | 230 | 52409 | 305.08 | 875 | 850 | 169.0 |
| C | 15 | 214 | 345304 | 1711.9 | 858 | 865 | 201.2 |
| C | 14 | 254 | 25977 | 124.81 | 858 | 865 | 201.2 |
| C | 0 | 10 | 10375 | 47.27 | 858 | 865 | 201.2 |
| D | 12 | 227 | 613734 | 3012.57 | 840 | 817 | 203.5 |
| D | 2 | 250 | 148051 | 723.68 | 840 | 817 | 203.5 |
| D | 12 | 233 | 143390 | 700.77 | 840 | 817 | 203.5 |
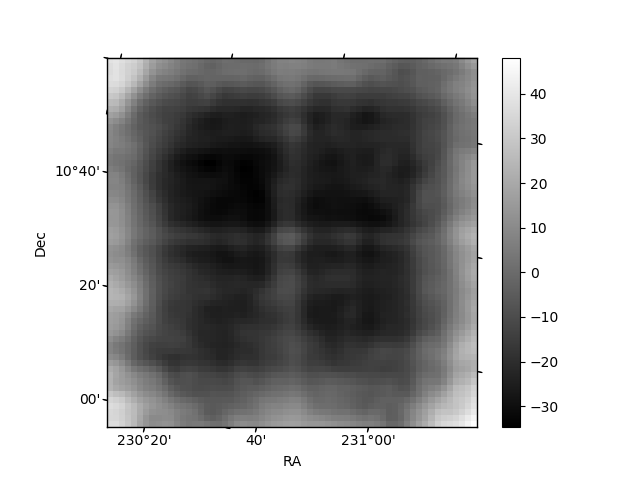
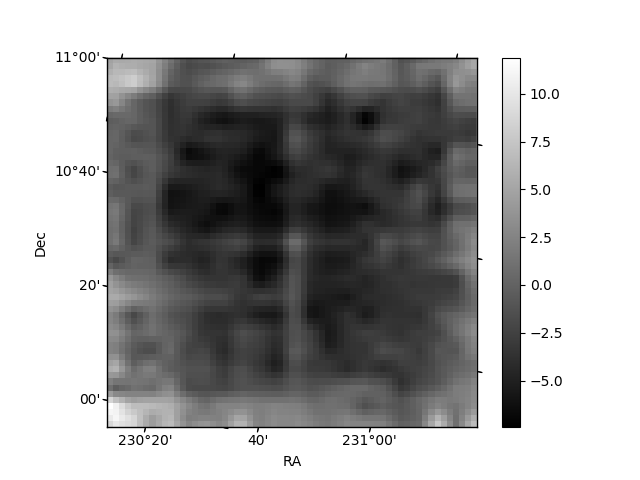
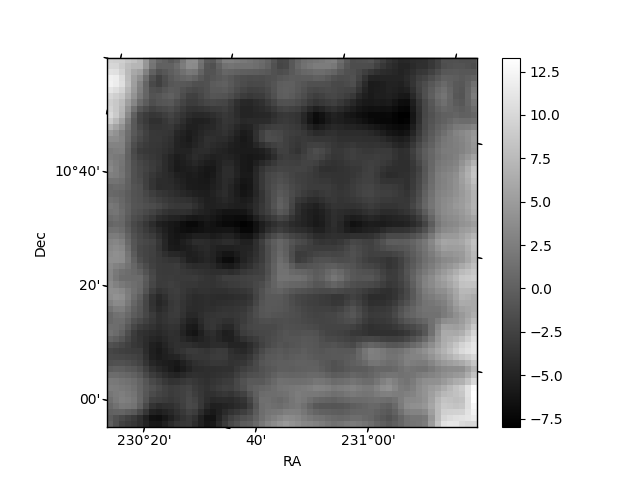
Histogram calculated using DETX and DETY for each event in the final _common_clean file
| Quadrant A | 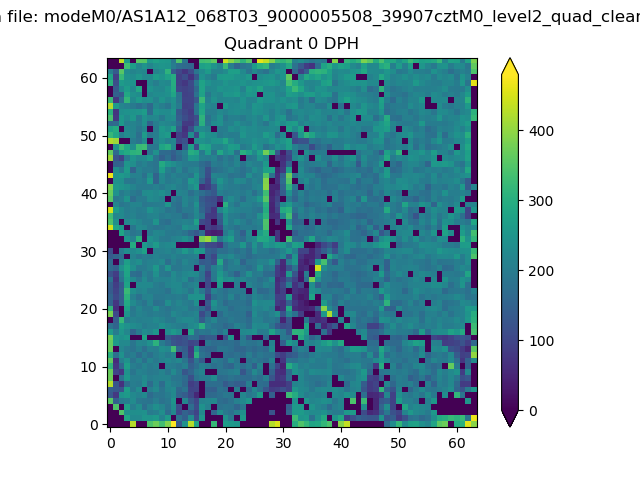 |
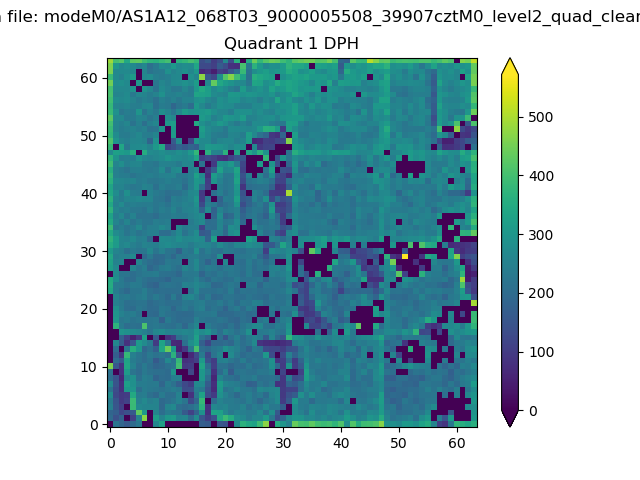 |
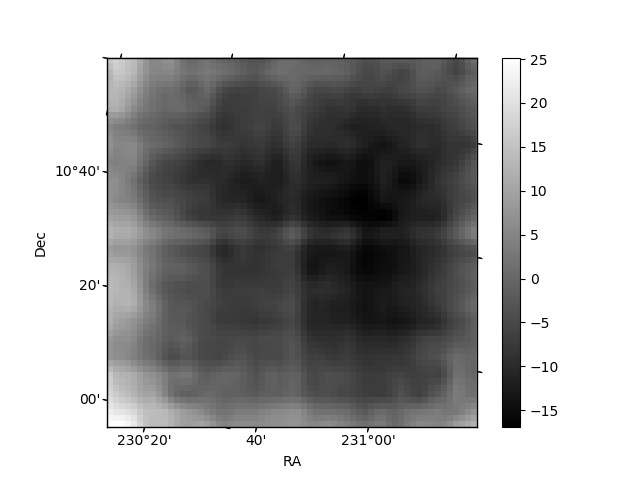
Quadrant B |
|---|---|---|---|
| Quadrant D | 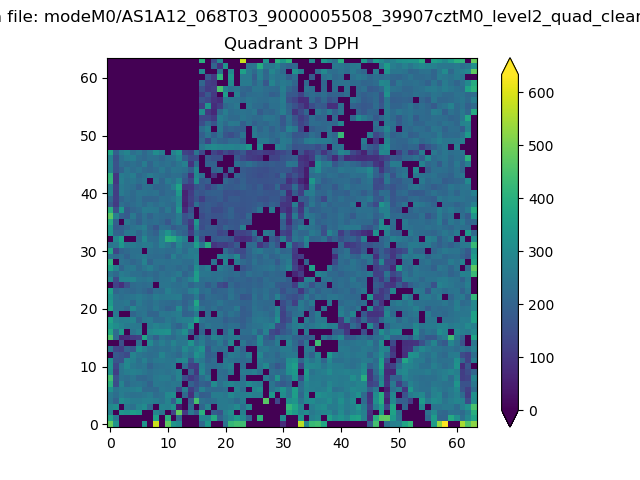 |
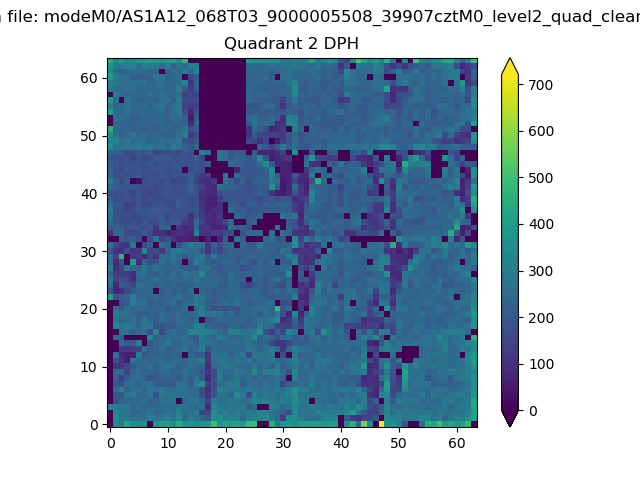 |
Quadrant C |
| Plot type | Count rate plots | Images |
|---|---|---|
| Comparison with Poisson distribution Blue bars denote a histogram of data divided into 1 sec bins. Red curve is a Poisson curve with rate = median count rate of data. |
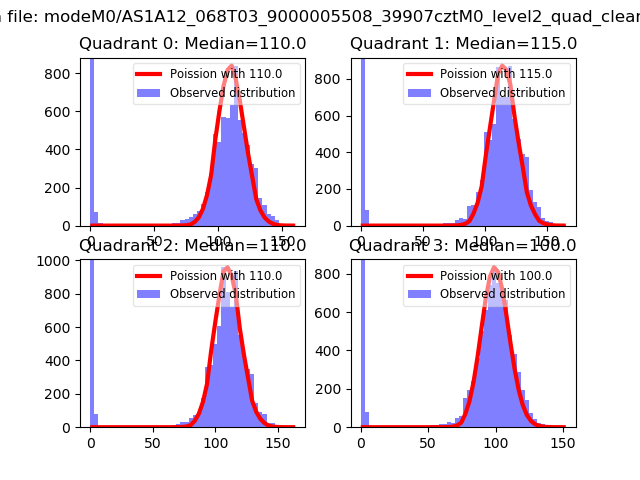 |
 |
| Quadrant-wise count rates Data is divided into 100 sec bins |
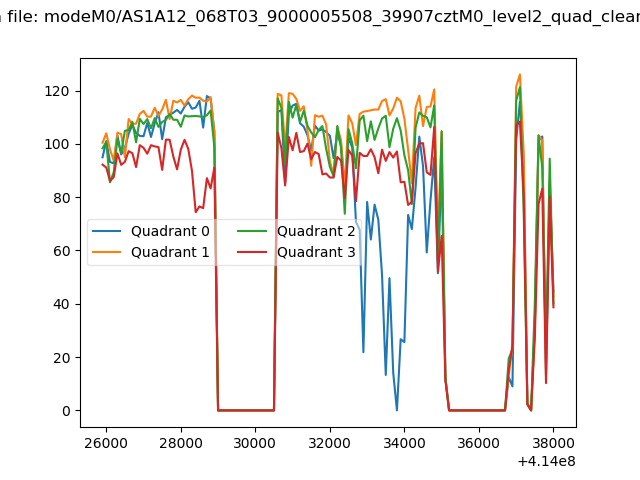 |
|
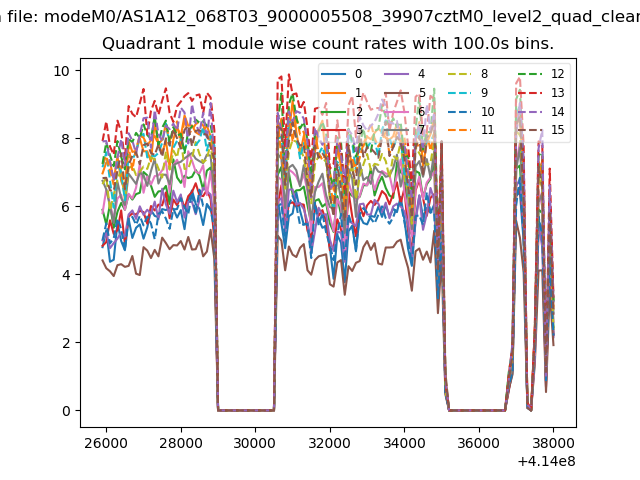
| Module-wise count rates for Quadrant A Data is divided into 100 sec bins |
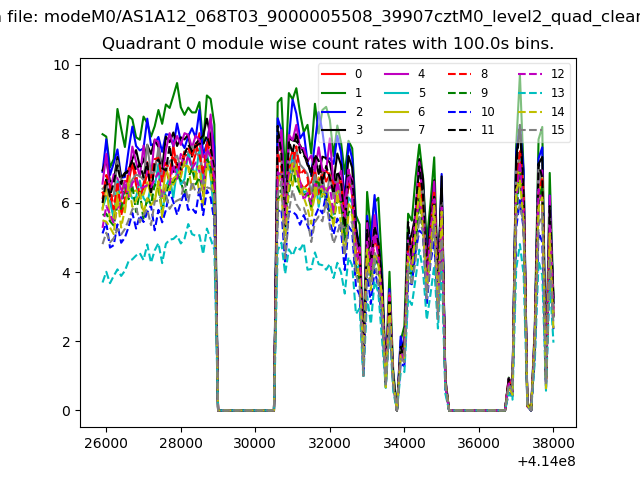 |
 |
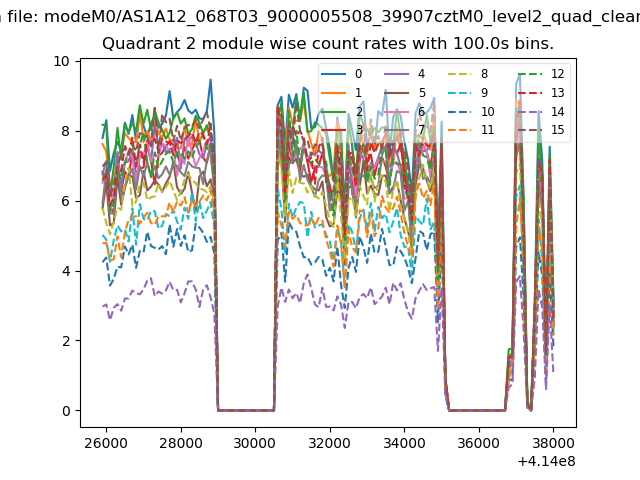
| Module-wise count rates for Quadrant B Data is divided into 100 sec bins |
 |
 |
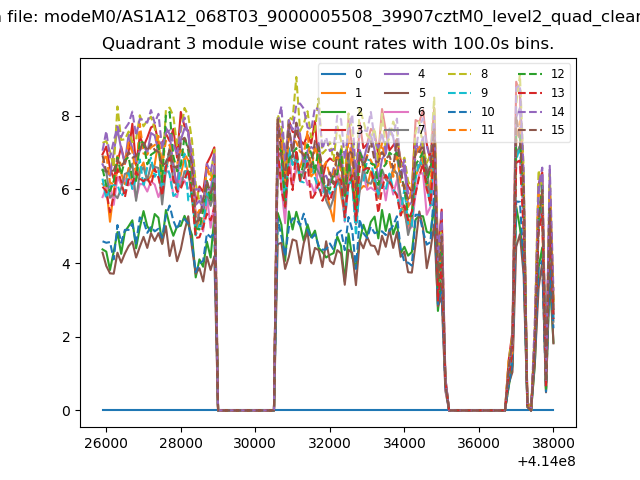
| Module-wise count rates for Quadrant C Data is divided into 100 sec bins |
 |
 |
| Module-wise count rates for Quadrant D Data is divided into 100 sec bins |
 |
 |
| Parameter | Plot |
|---|---|
| CZT HV Monitor | 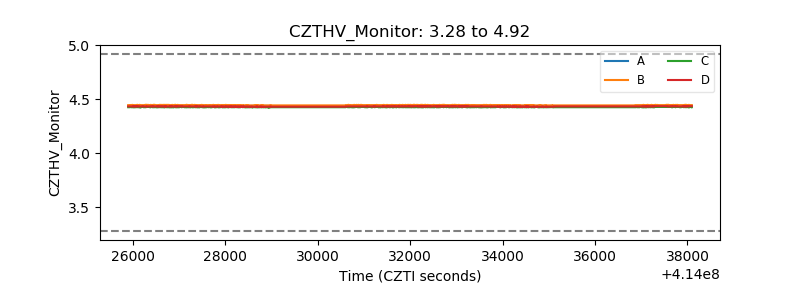 |
| D_VDD | 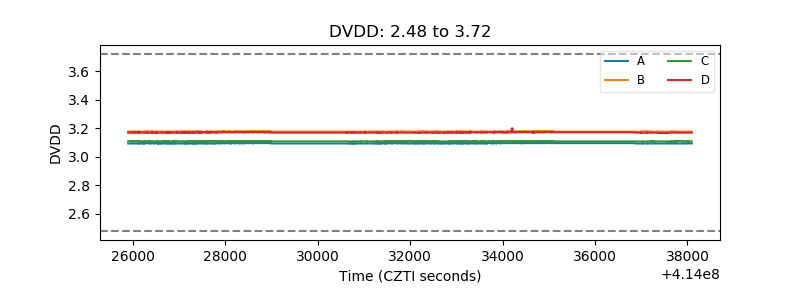 |
| Temperature 1 | 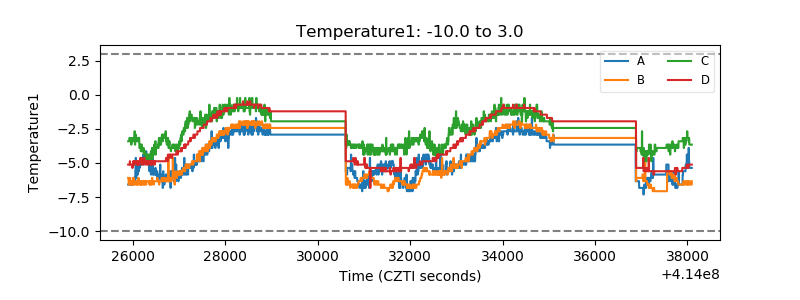 |
| Veto HV Monitor | 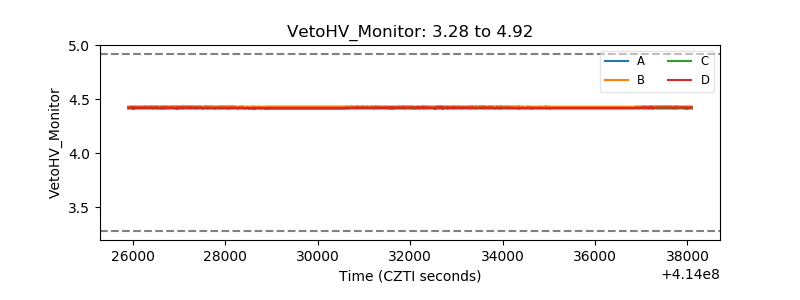 |
| Veto LLD | 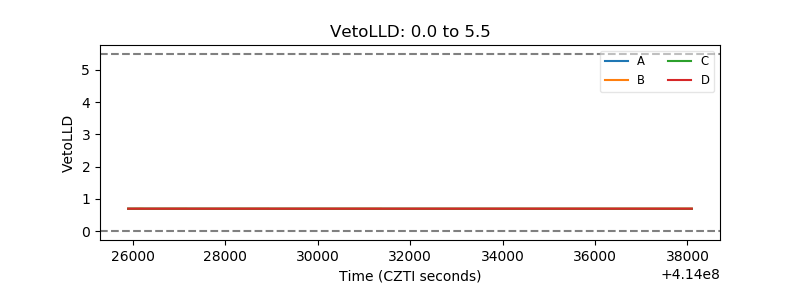 |
| Alpha Counter | 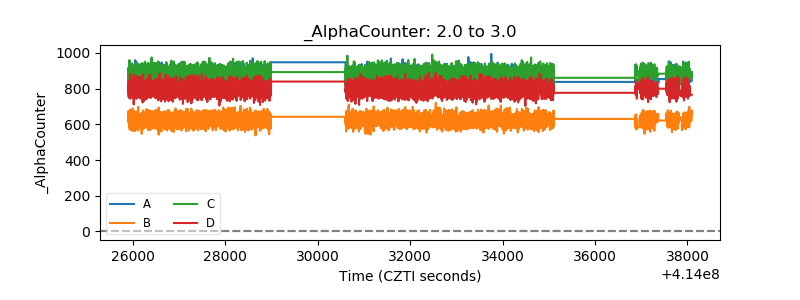 |
| _CPM_Rate | 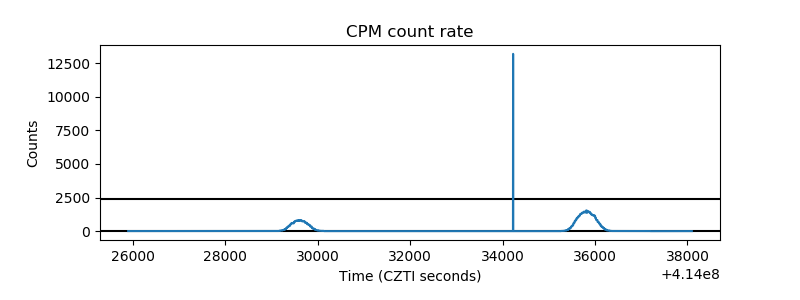 |
| CZT Counter | 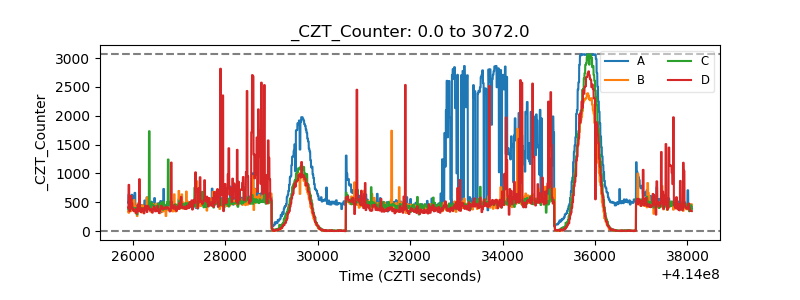 |
| +2.5 Volts monitor | 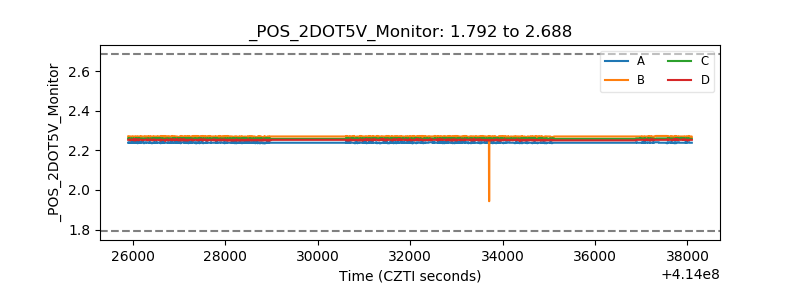 |
| +5 Volts monitor | 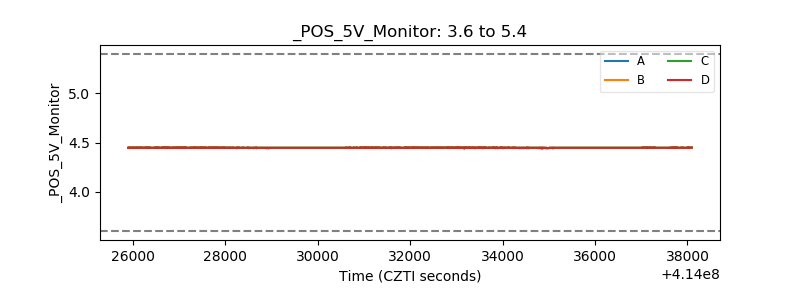 |
| _ROLL_ROT | 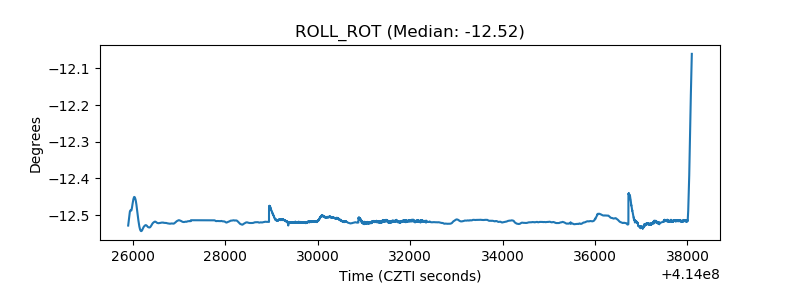 |
| _Roll_DEC | 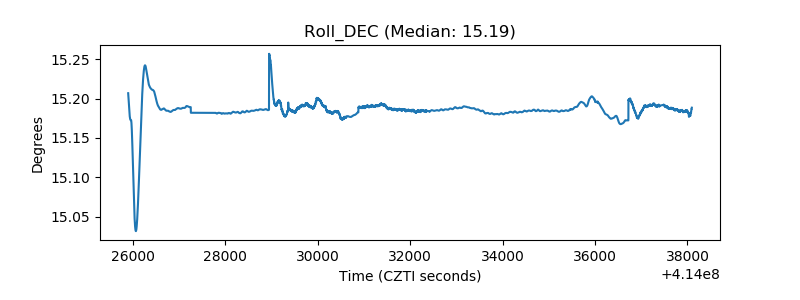 |
| _Roll_RA | 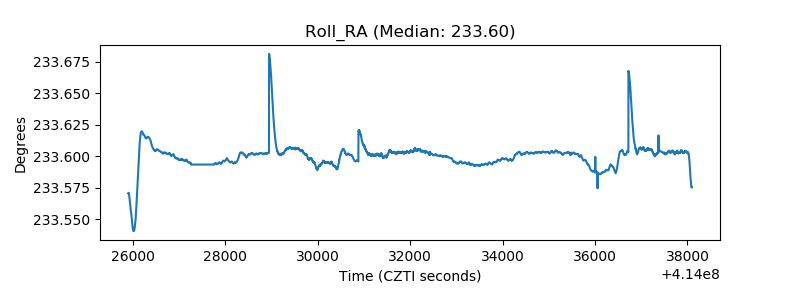 |
| Veto Counter | 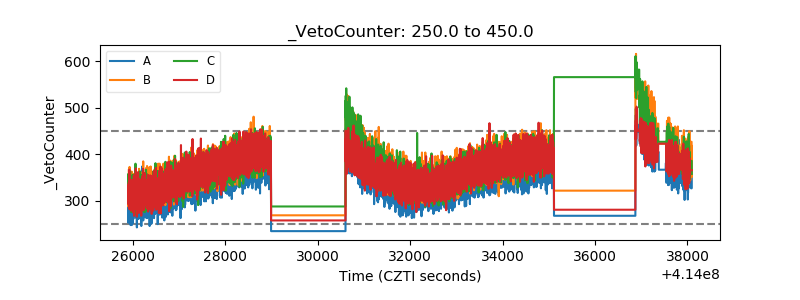 |