| Param | Original file | Final file |
|---|---|---|
| Filename | modeM0/AS1A12_068T03_9000005508_39908cztM0_level2.fits | modeM0/AS1A12_068T03_9000005508_39908cztM0_level2_quad_clean.evt |
| Size (bytes) | 94,363,200 | 28,552,320 |
| Size | 90.0 MB | 27.2 MB |
| Events in quadrant A | 918,283 | 190,228 |
| Events in quadrant B | 774,460 | 200,911 |
| Events in quadrant C | 792,643 | 186,367 |
| Events in quadrant D | 882,626 | 171,713 |
| Mode M9 | |||
|---|---|---|---|
| Quadrant | BADHDUFLAG | Total packets | Discarded packets |
| A | 0 | 18 | 3 |
| B | 0 | 19 | 3 |
| C | 0 | 19 | 3 |
| D | 0 | 17 | 0 |
| Mode M0 | |||
|---|---|---|---|
| Quadrant | BADHDUFLAG | Total packets | Discarded packets |
| A | 0 | 5080 | 1423 |
| B | 0 | 4731 | 1472 |
| C | 0 | 4384 | 1163 |
| D | 0 | 5047 | 1371 |
| Mode SS | |||
|---|---|---|---|
| Quadrant | BADHDUFLAG | Total packets | Discarded packets |
| A | 0 | 42 | 8 |
| B | 0 | 42 | 7 |
| C | 0 | 41 | 11 |
| D | 0 | 43 | 9 |
| Quadrant | Total seconds | Saturated seconds | Saturation percentage |
|---|---|---|---|
| A | 1555 | 9 | 0.578778% |
| B | 1584 | 4 | 0.252525% |
| C | 1561 | 4 | 0.256246% |
| D | 1576 | 20 | 1.269036% |
Noise dominated data is calculated using 1-second bins in cleaned event files. If a bin has >2000 counts, and if more than 50% of those come from <1% of pixels, then it is considered to be noise-dominated and hence unusable.
| Quadrant | # 1 sec bins | Bins with >0 counts | Bins with >2000 counts | High rate bins dominated by noise | Noise dominated (total time) | Noise dominated (detector-on time) | Marked lightcurve |
|---|---|---|---|---|---|---|---|
| A | 4169 | 1654 | 4 | 4 | 0.10% | 0.24% | 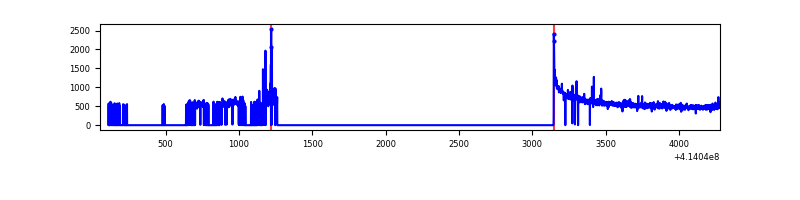 |
| B | 4227 | 1688 | 0 | 0 | 0.00% | 0.00% | 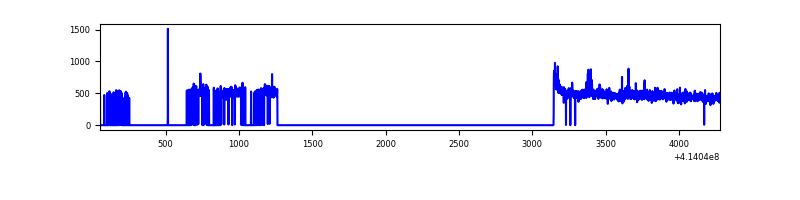 |
| C | 4219 | 1661 | 2 | 2 | 0.05% | 0.12% | 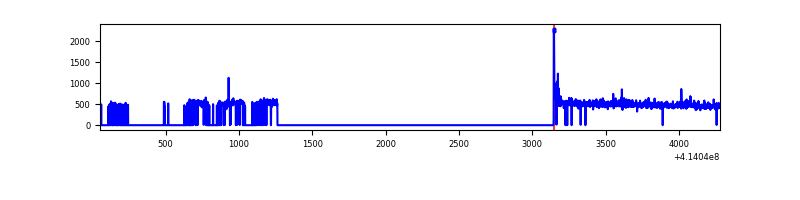 |
| D | 4176 | 1686 | 19 | 19 | 0.45% | 1.13% | 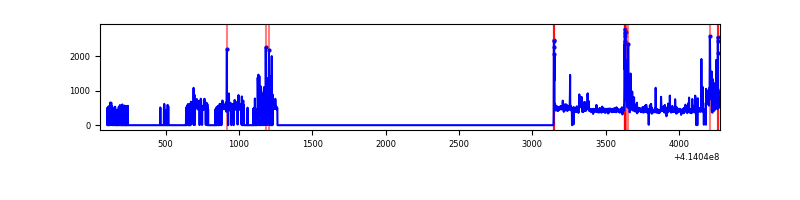 |
Top three noisy pixels from each quadrant. If the there are fewer than three noisy pixels in the level2.evt file, extra rows are filled as -1
| Pixel properties | Quadrant properties | ||||||
|---|---|---|---|---|---|---|---|
| Quadrant | DetID | PixID | Counts | Sigma | Mean | Median | Sigma |
| A | 10 | 83 | 173225 | 4564.57 | 182 | 179 | 37.9 |
| A | 6 | 10 | 32032 | 840.21 | 182 | 179 | 37.9 |
| A | 13 | 254 | 2395 | 58.45 | 182 | 179 | 37.9 |
| B | 0 | 230 | 14005 | 373.45 | 186 | 182 | 37.0 |
| B | 4 | 171 | 6749 | 177.42 | 186 | 182 | 37.0 |
| B | 4 | 200 | 6302 | 165.34 | 186 | 182 | 37.0 |
| C | 15 | 214 | 72833 | 1691.3 | 178 | 180 | 43.0 |
| C | 9 | 187 | 14459 | 332.4 | 178 | 180 | 43.0 |
| C | 0 | 10 | 7518 | 170.82 | 178 | 180 | 43.0 |
| D | 12 | 227 | 60478 | 1348.22 | 178 | 172 | 44.7 |
| D | 1 | 47 | 51577 | 1149.23 | 178 | 172 | 44.7 |
| D | 2 | 250 | 30867 | 686.23 | 178 | 172 | 44.7 |
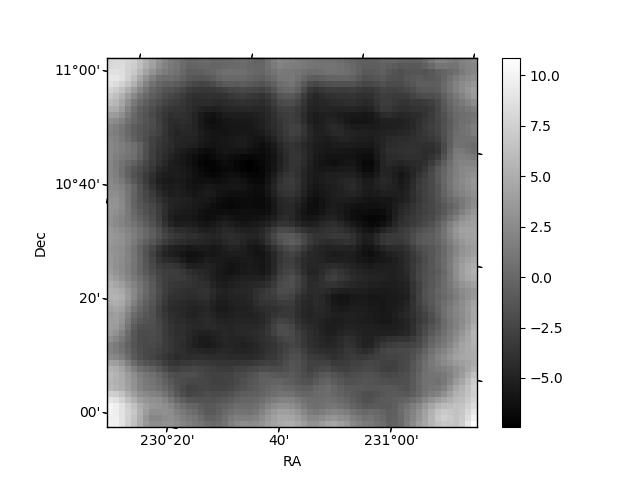
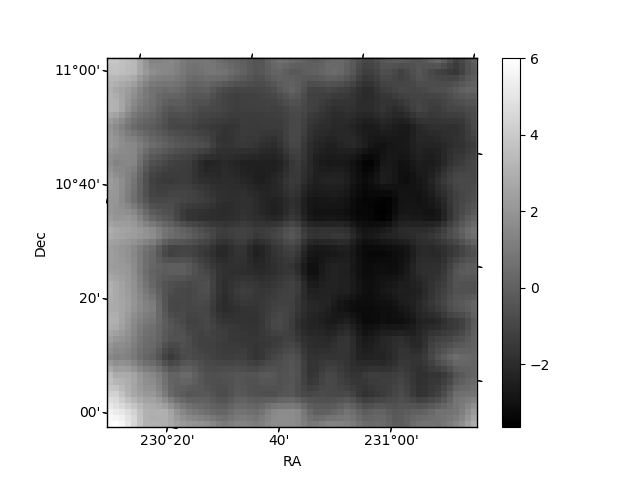
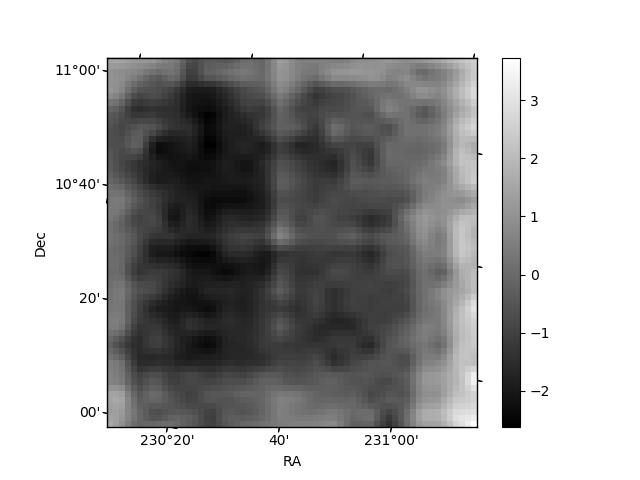
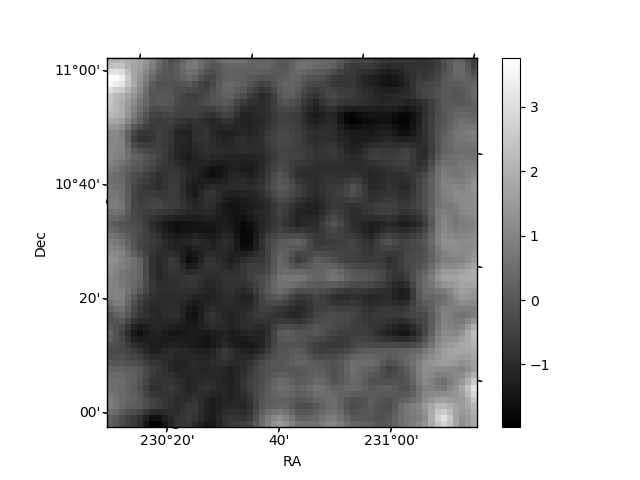
Histogram calculated using DETX and DETY for each event in the final _common_clean file
| Quadrant A | 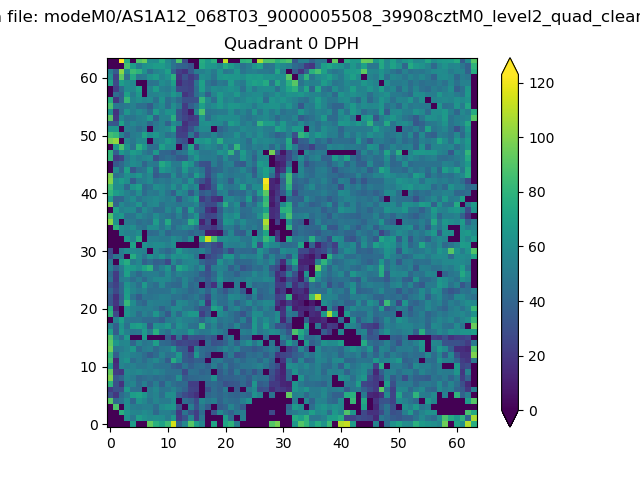 |
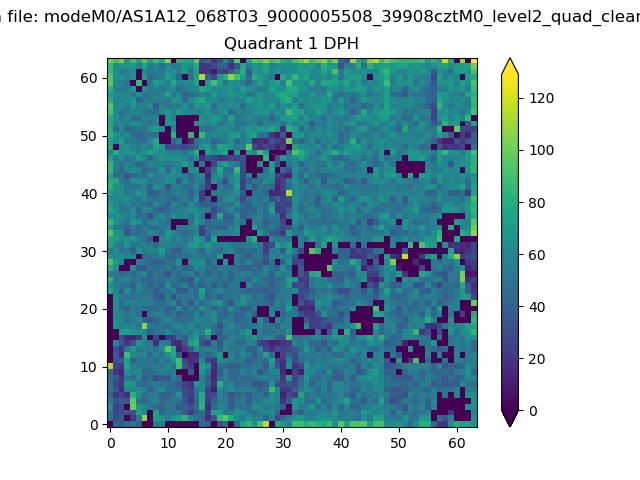 |
Quadrant B |
|---|---|---|---|
| Quadrant D | 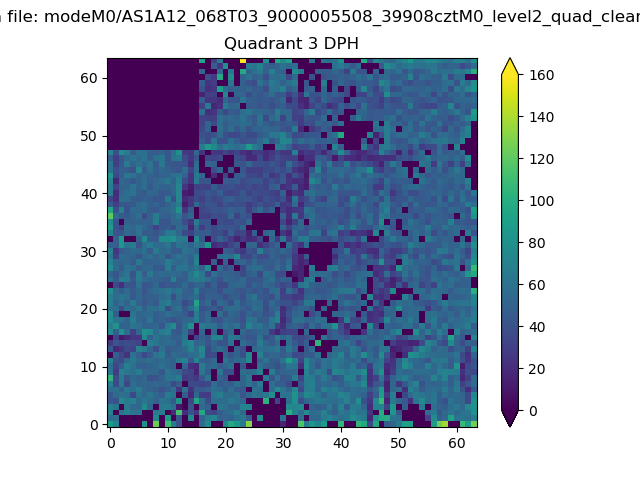 |
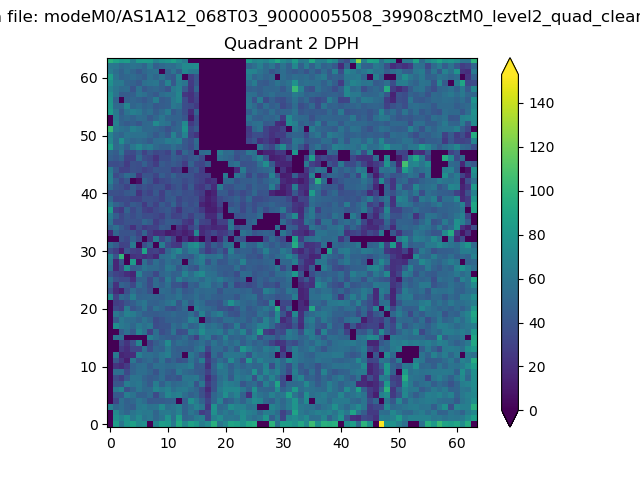 |
Quadrant C |
| Plot type | Count rate plots | Images |
|---|---|---|
| Comparison with Poisson distribution Blue bars denote a histogram of data divided into 1 sec bins. Red curve is a Poisson curve with rate = median count rate of data. |
 |
 |
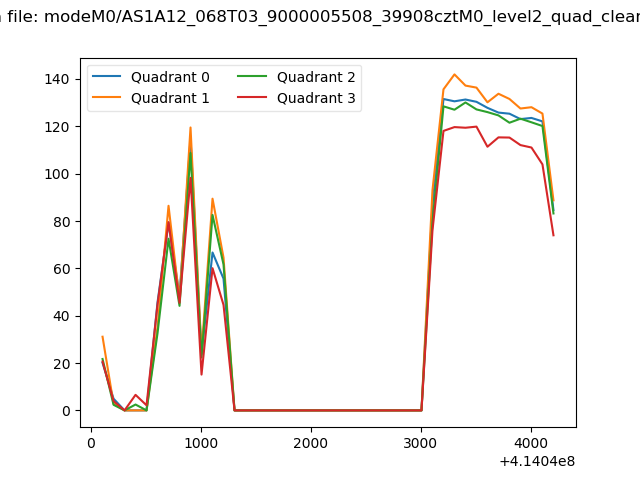
| Quadrant-wise count rates Data is divided into 100 sec bins |
 |
|
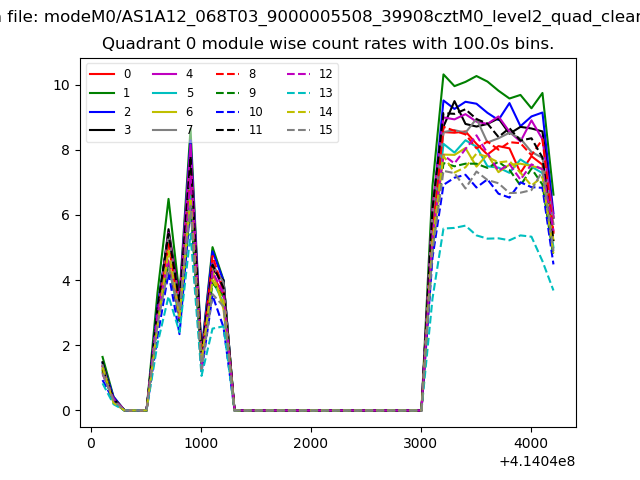
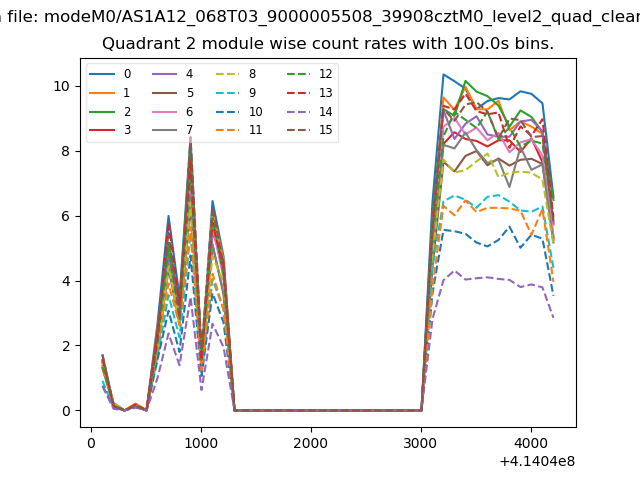
| Module-wise count rates for Quadrant A Data is divided into 100 sec bins |
 |
 |
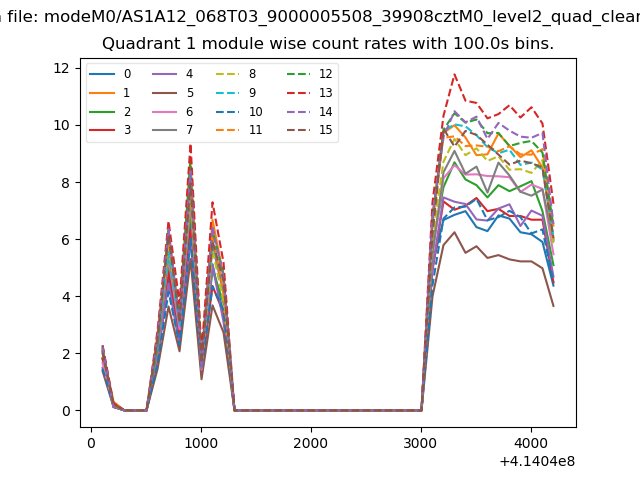
| Module-wise count rates for Quadrant B Data is divided into 100 sec bins |
 |
 |
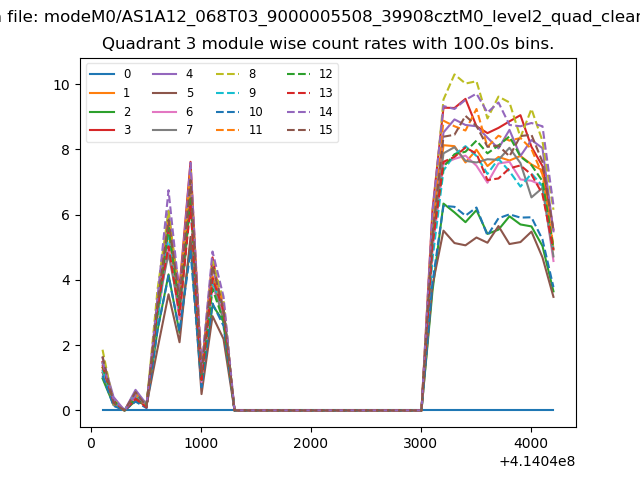
| Module-wise count rates for Quadrant C Data is divided into 100 sec bins |
 |
 |
| Module-wise count rates for Quadrant D Data is divided into 100 sec bins |
 |
 |
| Parameter | Plot |
|---|---|
| CZT HV Monitor | 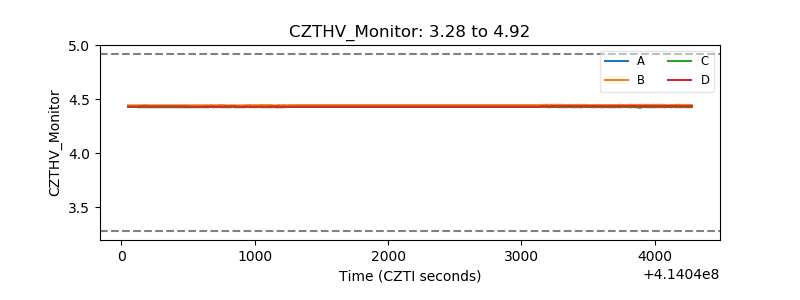 |
| D_VDD | 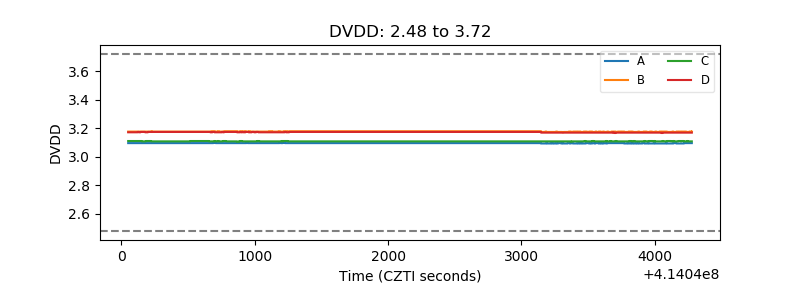 |
| Temperature 1 | 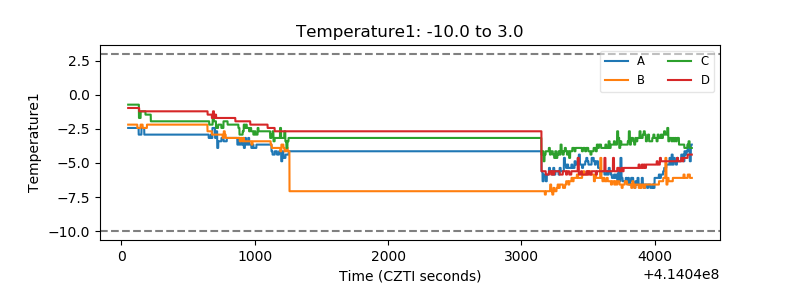 |
| Veto HV Monitor | 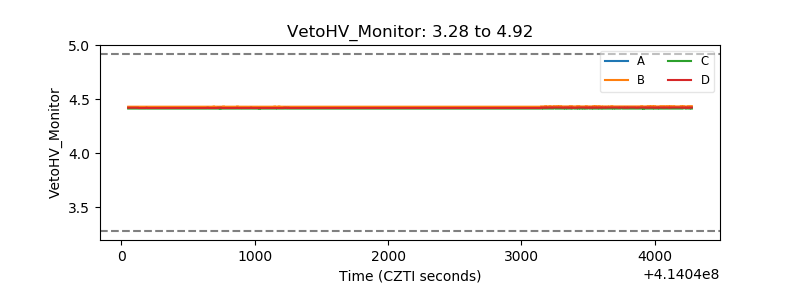 |
| Veto LLD | 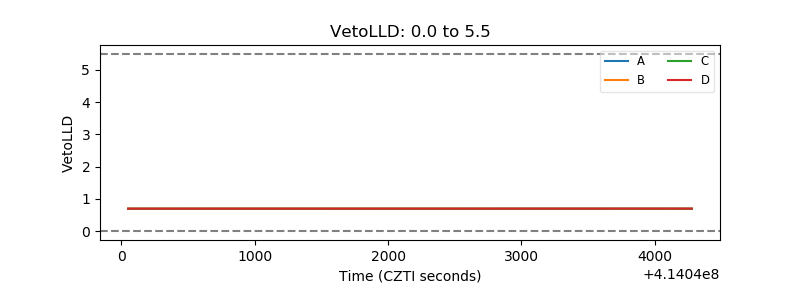 |
| Alpha Counter | 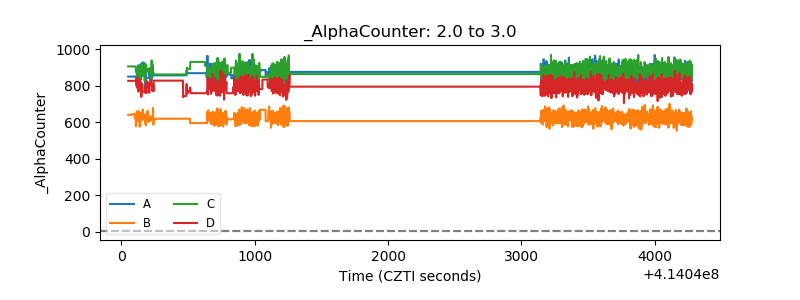 |
| _CPM_Rate | 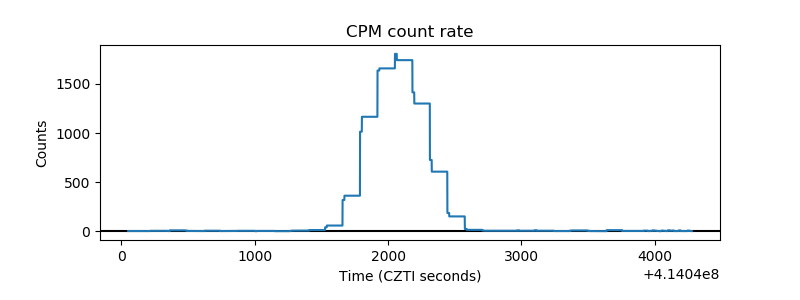 |
| CZT Counter | 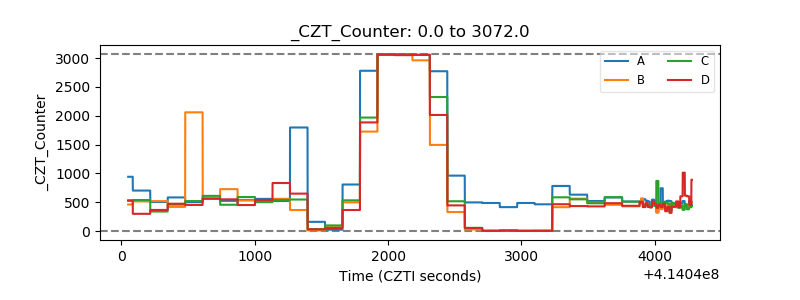 |
| +2.5 Volts monitor | 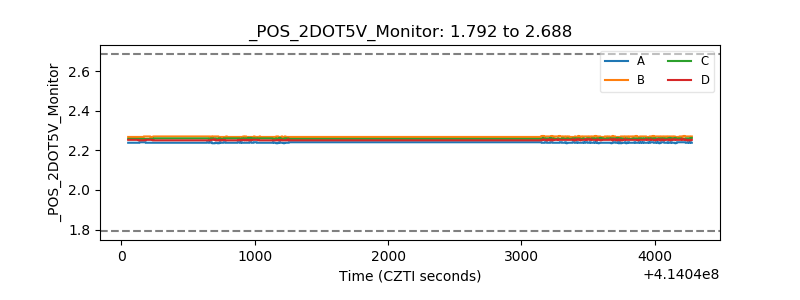 |
| +5 Volts monitor | 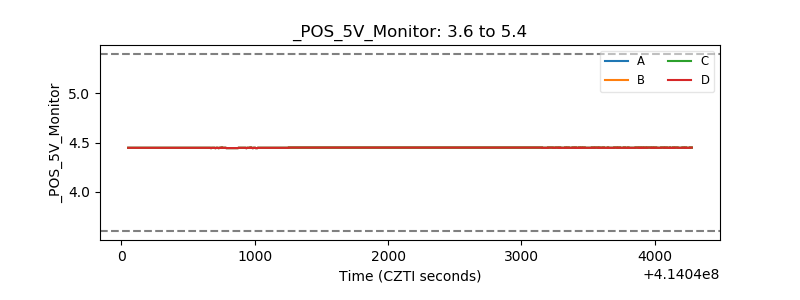 |
| _ROLL_ROT |  |
| _Roll_DEC | 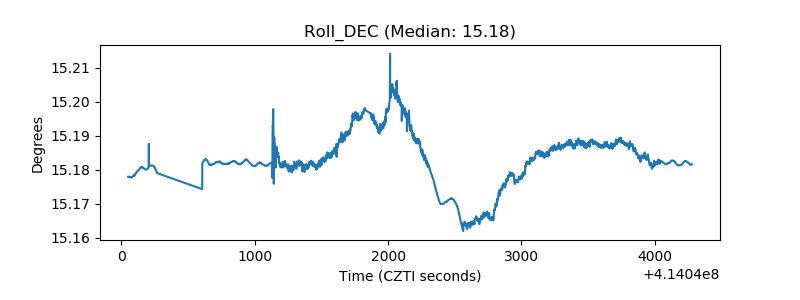 |
| _Roll_RA | 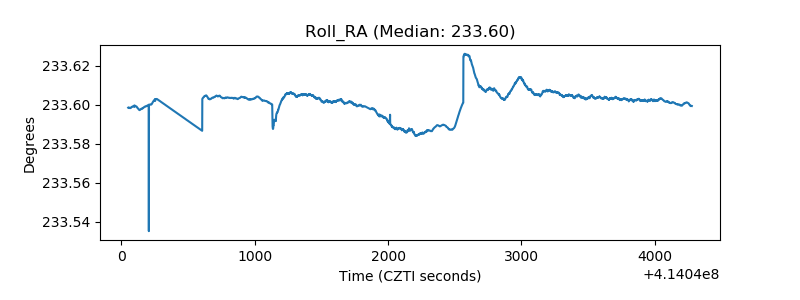 |
| Veto Counter | 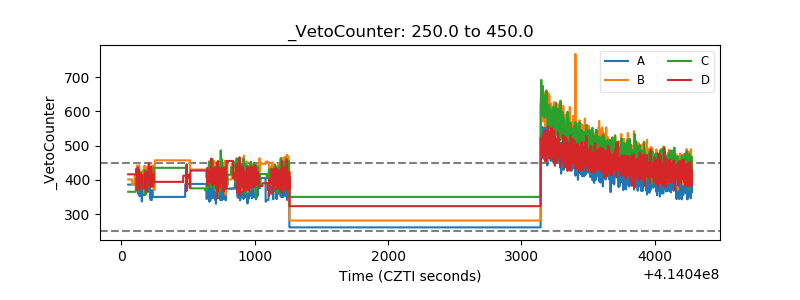 |