| Param | Original file | Final file |
|---|---|---|
| Filename | modeM0/AS1A12_068T03_9000005508_39909cztM0_level2.fits | modeM0/AS1A12_068T03_9000005508_39909cztM0_level2_quad_clean.evt |
| Size (bytes) | 175,939,200 | 47,237,760 |
| Size | 167.8 MB | 45.0 MB |
| Events in quadrant A | 1,560,138 | 322,955 |
| Events in quadrant B | 1,397,304 | 333,624 |
| Events in quadrant C | 1,337,481 | 316,332 |
| Events in quadrant D | 2,014,838 | 272,512 |
| Mode M9 | |||
|---|---|---|---|
| Quadrant | BADHDUFLAG | Total packets | Discarded packets |
| A | 0 | 20 | 0 |
| B | 0 | 20 | 0 |
| C | 0 | 20 | 0 |
| D | 0 | 20 | 0 |
| Mode M0 | |||
|---|---|---|---|
| Quadrant | BADHDUFLAG | Total packets | Discarded packets |
| A | 0 | 6117 | 2 |
| B | 0 | 5659 | 3 |
| C | 0 | 5292 | 1 |
| D | 0 | 7746 | 29 |
| Mode SS | |||
|---|---|---|---|
| Quadrant | BADHDUFLAG | Total packets | Discarded packets |
| A | 0 | 54 | 0 |
| B | 0 | 54 | 0 |
| C | 0 | 54 | 0 |
| D | 0 | 54 | 0 |
| Quadrant | Total seconds | Saturated seconds | Saturation percentage |
|---|---|---|---|
| A | 2583 | 30 | 1.161440% |
| B | 2581 | 19 | 0.736149% |
| C | 2582 | 3 | 0.116189% |
| D | 2578 | 215 | 8.339798% |
Noise dominated data is calculated using 1-second bins in cleaned event files. If a bin has >2000 counts, and if more than 50% of those come from <1% of pixels, then it is considered to be noise-dominated and hence unusable.
| Quadrant | # 1 sec bins | Bins with >0 counts | Bins with >2000 counts | High rate bins dominated by noise | Noise dominated (total time) | Noise dominated (detector-on time) | Marked lightcurve |
|---|---|---|---|---|---|---|---|
| A | 4585 | 2583 | 15 | 15 | 0.33% | 0.58% | 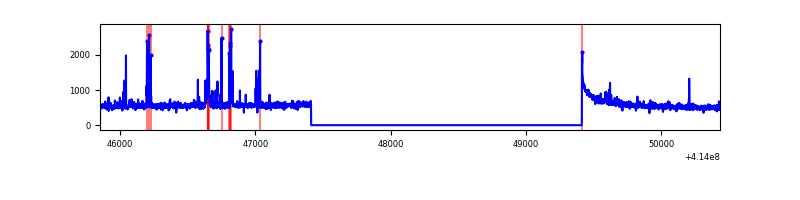 |
| B | 4583 | 2581 | 9 | 9 | 0.20% | 0.35% | 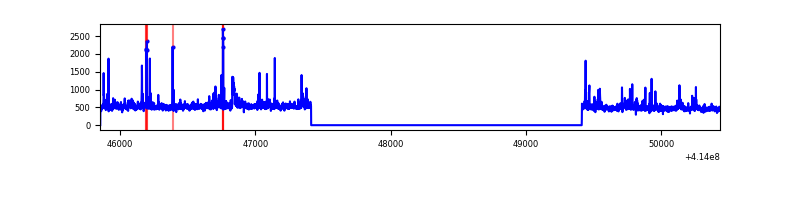 |
| C | 4586 | 2583 | 2 | 2 | 0.04% | 0.08% | 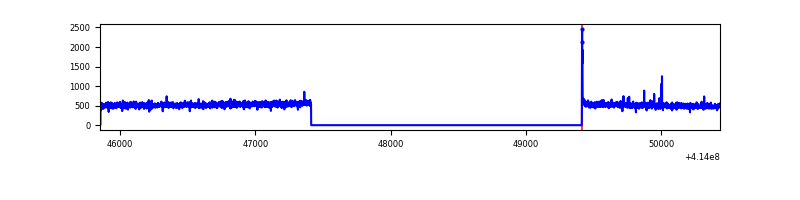 |
| D | 4582 | 2580 | 191 | 191 | 4.17% | 7.40% | 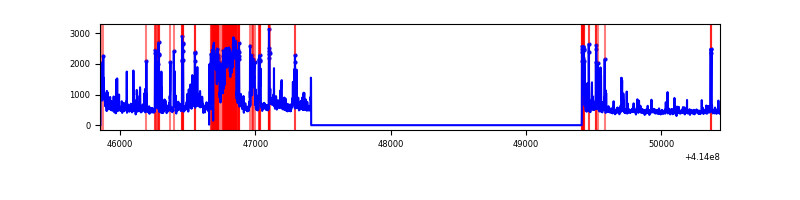 |
Top three noisy pixels from each quadrant. If the there are fewer than three noisy pixels in the level2.evt file, extra rows are filled as -1
| Pixel properties | Quadrant properties | ||||||
|---|---|---|---|---|---|---|---|
| Quadrant | DetID | PixID | Counts | Sigma | Mean | Median | Sigma |
| A | 10 | 83 | 233444 | 3562.98 | 316 | 310 | 65.4 |
| A | 6 | 10 | 57087 | 867.72 | 316 | 310 | 65.4 |
| A | 13 | 248 | 32205 | 487.45 | 316 | 310 | 65.4 |
| B | 4 | 171 | 65979 | 1071.37 | 313 | 306 | 61.3 |
| B | 5 | 255 | 36955 | 597.88 | 313 | 306 | 61.3 |
| B | 0 | 230 | 28300 | 456.68 | 313 | 306 | 61.3 |
| C | 15 | 214 | 116585 | 1594.32 | 309 | 311 | 72.9 |
| C | 0 | 10 | 8546 | 112.92 | 309 | 311 | 72.9 |
| C | 14 | 254 | 2655 | 32.14 | 309 | 311 | 72.9 |
| D | 13 | 249 | 497542 | 6781.68 | 297 | 289 | 73.3 |
| D | 2 | 250 | 93025 | 1264.76 | 297 | 289 | 73.3 |
| D | 12 | 227 | 86892 | 1181.12 | 297 | 289 | 73.3 |
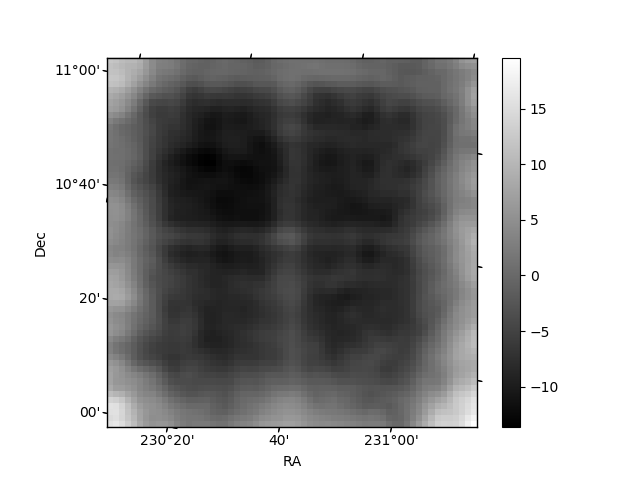
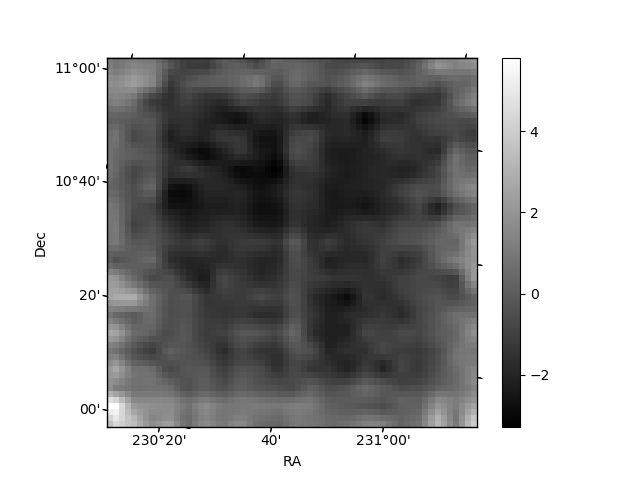
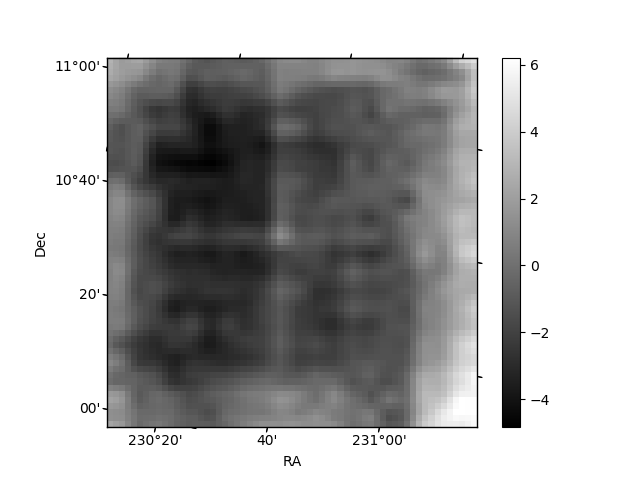
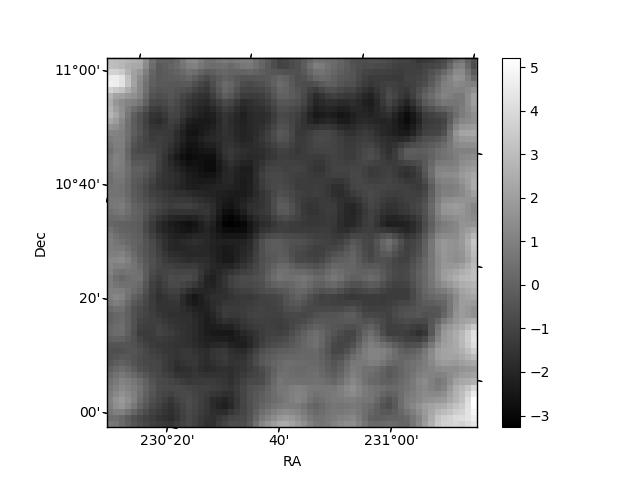
Histogram calculated using DETX and DETY for each event in the final _common_clean file
| Quadrant A | 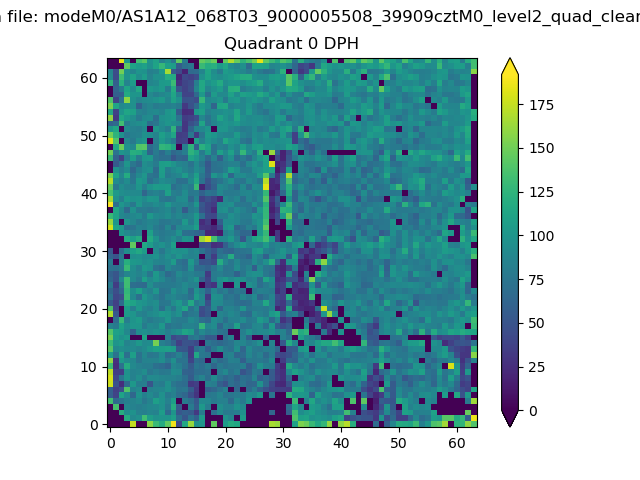 |
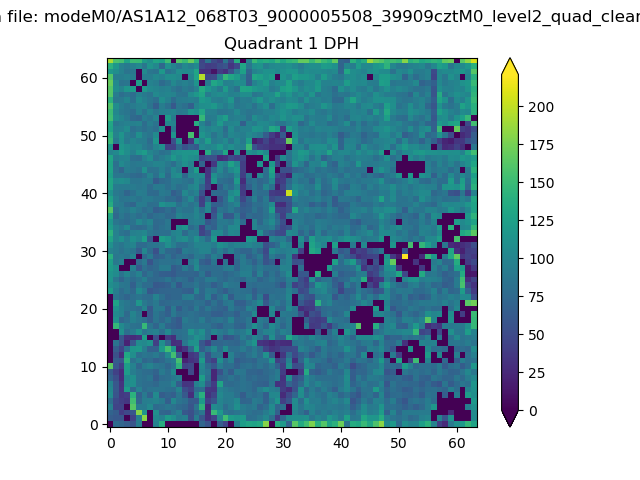 |
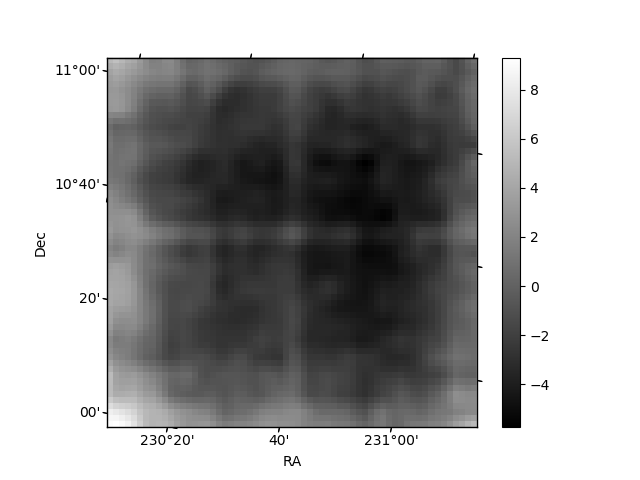
Quadrant B |
|---|---|---|---|
| Quadrant D | 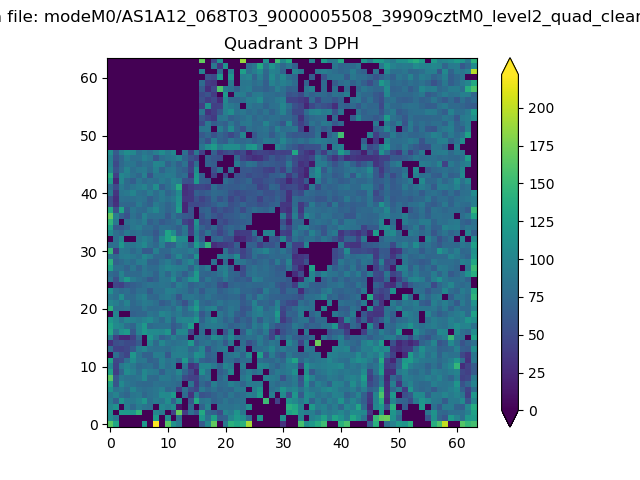 |
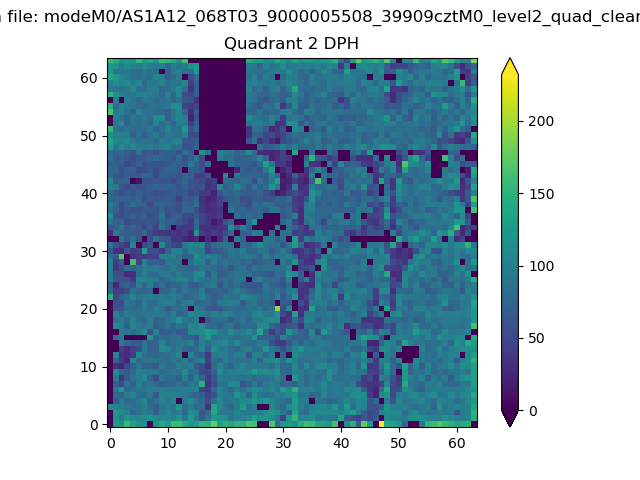 |
Quadrant C |
| Plot type | Count rate plots | Images |
|---|---|---|
| Comparison with Poisson distribution Blue bars denote a histogram of data divided into 1 sec bins. Red curve is a Poisson curve with rate = median count rate of data. |
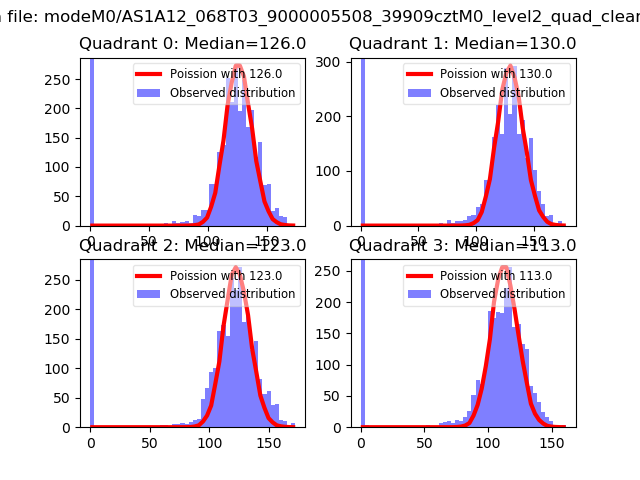 |
 |
| Quadrant-wise count rates Data is divided into 100 sec bins |
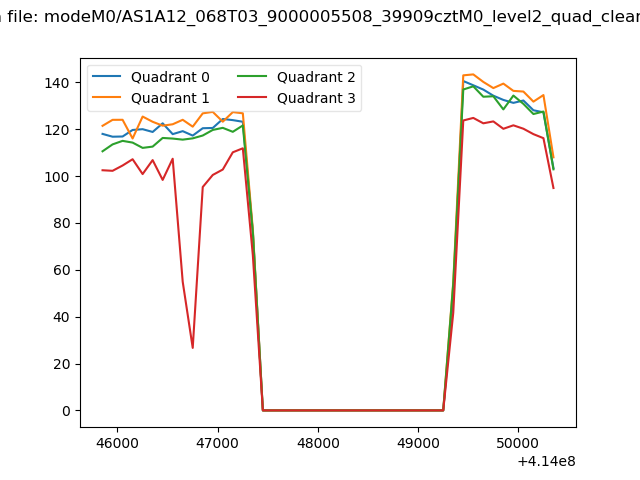 |
|
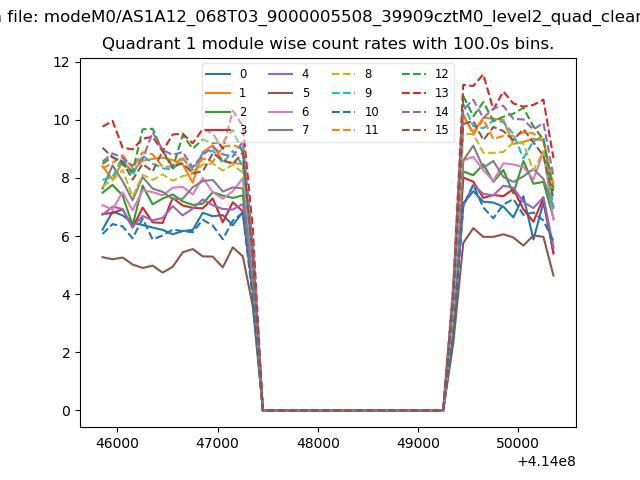
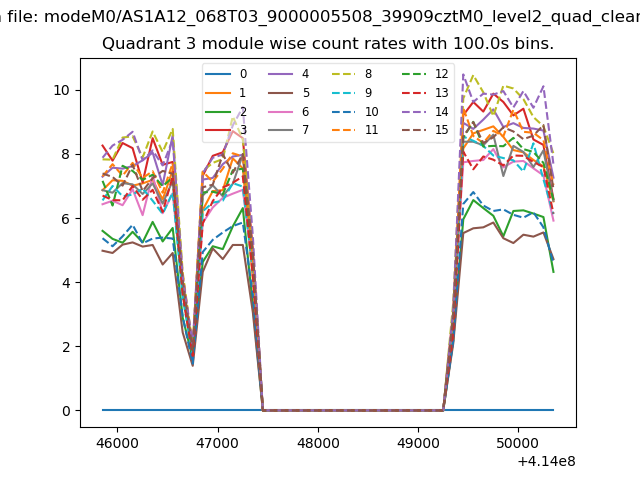
| Module-wise count rates for Quadrant A Data is divided into 100 sec bins |
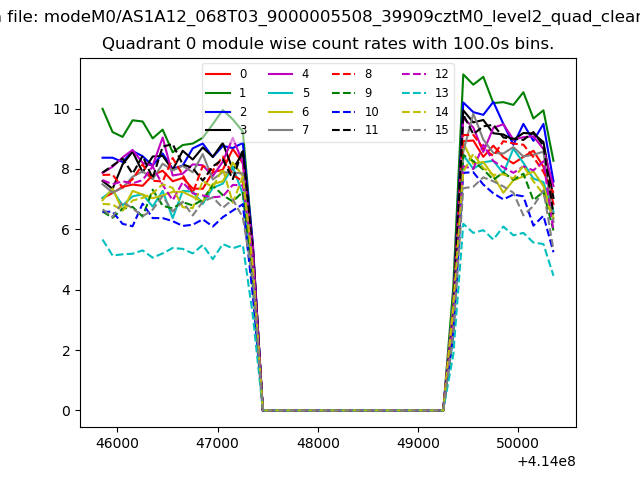 |
 |
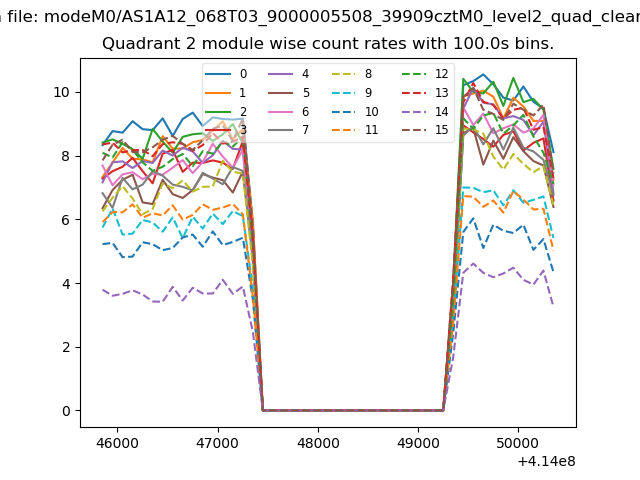
| Module-wise count rates for Quadrant B Data is divided into 100 sec bins |
 |
 |
| Module-wise count rates for Quadrant C Data is divided into 100 sec bins |
 |
 |
| Module-wise count rates for Quadrant D Data is divided into 100 sec bins |
 |
 |
| Parameter | Plot |
|---|---|
| CZT HV Monitor | 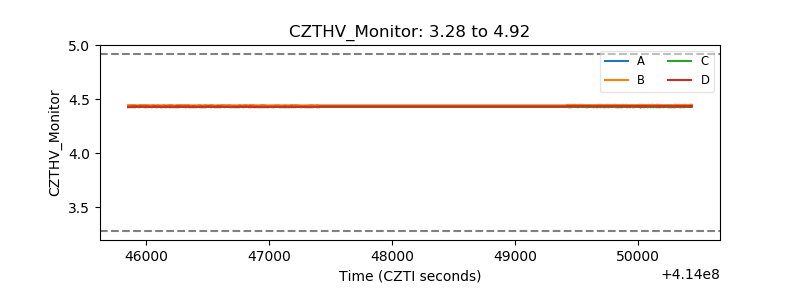 |
| D_VDD |  |
| Temperature 1 | 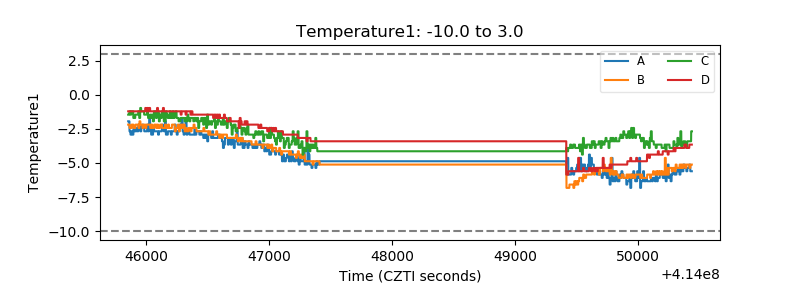 |
| Veto HV Monitor | 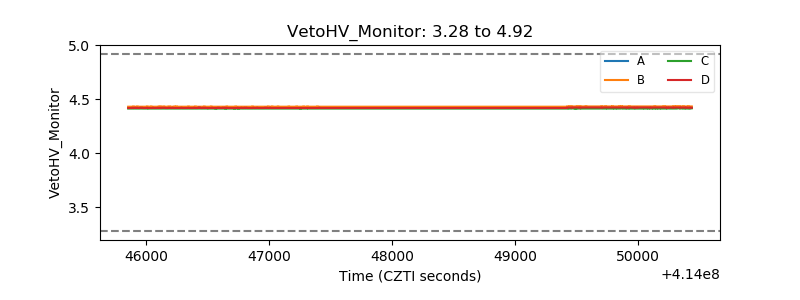 |
| Veto LLD | 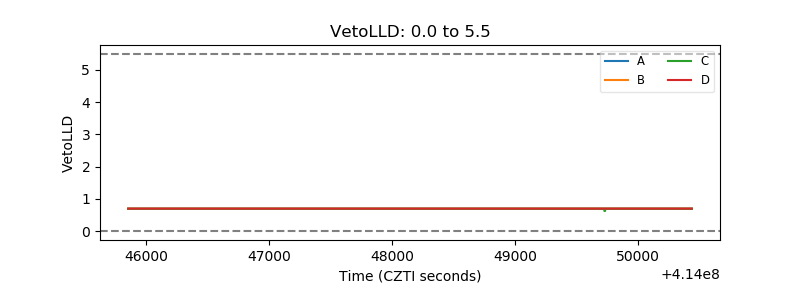 |
| Alpha Counter | 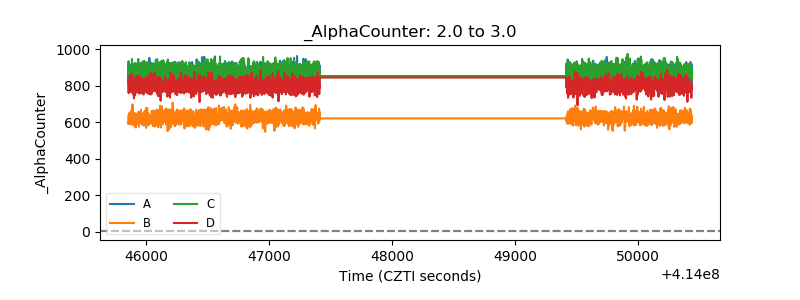 |
| _CPM_Rate | 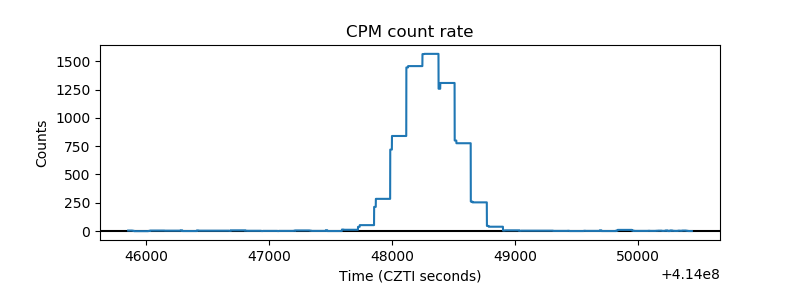 |
| CZT Counter | 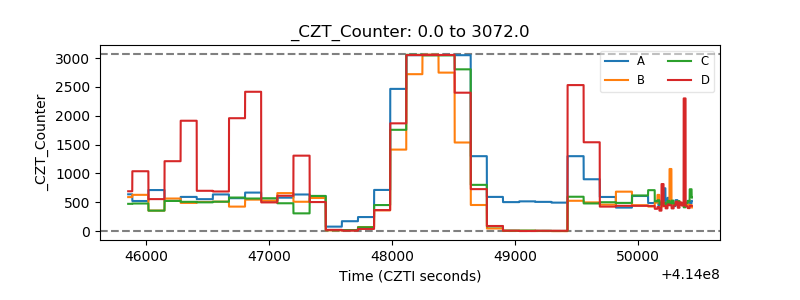 |
| +2.5 Volts monitor | 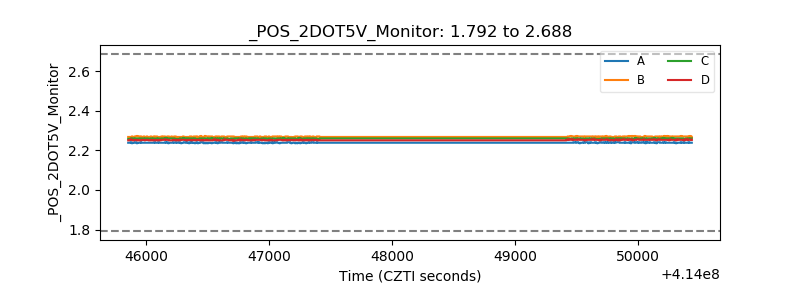 |
| +5 Volts monitor | 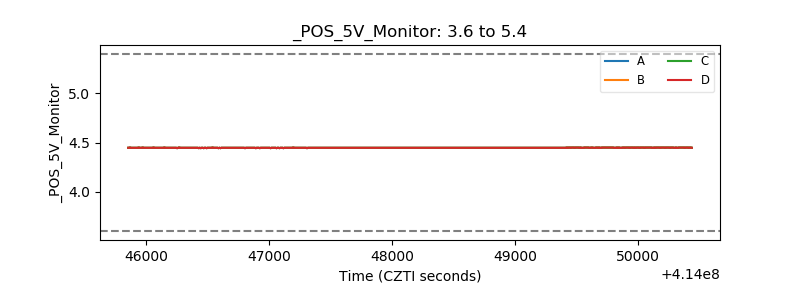 |
| _ROLL_ROT | 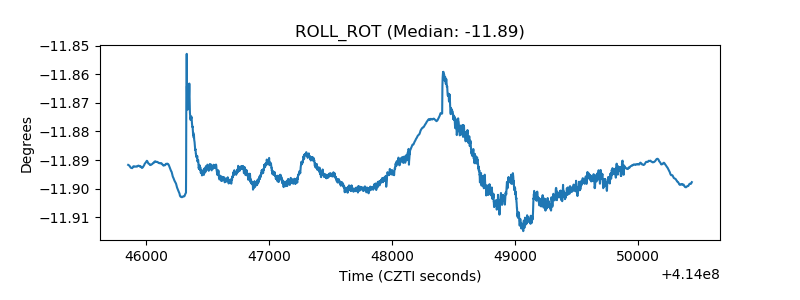 |
| _Roll_DEC | 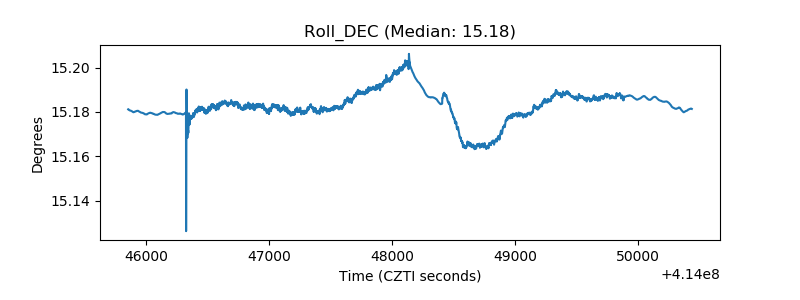 |
| _Roll_RA | 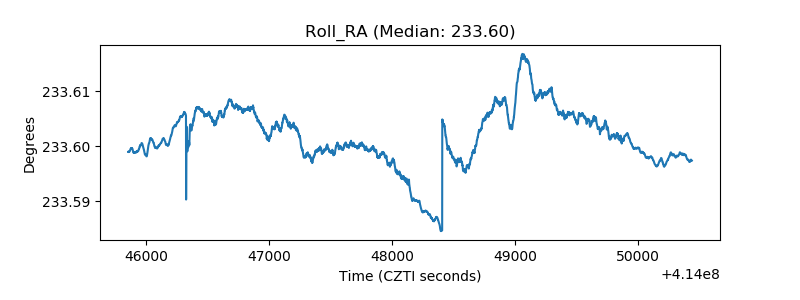 |
| Veto Counter | 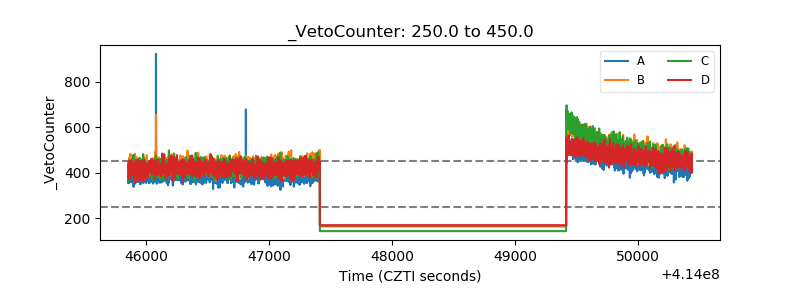 |