| Param | Original file | Final file |
|---|---|---|
| Filename | modeM0/AS1A12_068T03_9000005508_39912cztM0_level2.fits | modeM0/AS1A12_068T03_9000005508_39912cztM0_level2_quad_clean.evt |
| Size (bytes) | 375,998,400 | 82,739,520 |
| Size | 358.6 MB | 78.9 MB |
| Events in quadrant A | 2,695,938 | 575,929 |
| Events in quadrant B | 2,524,490 | 586,699 |
| Events in quadrant C | 3,070,258 | 550,529 |
| Events in quadrant D | 5,244,359 | 446,975 |
| Mode M9 | |||
|---|---|---|---|
| Quadrant | BADHDUFLAG | Total packets | Discarded packets |
| A | 0 | 28 | 0 |
| B | 0 | 28 | 0 |
| C | 0 | 28 | 0 |
| D | 0 | 29 | 0 |
| Mode M0 | |||
|---|---|---|---|
| Quadrant | BADHDUFLAG | Total packets | Discarded packets |
| A | 0 | 10734 | 3 |
| B | 0 | 10608 | 2 |
| C | 0 | 12005 | 2 |
| D | 0 | 18920 | 8 |
| Mode SS | |||
|---|---|---|---|
| Quadrant | BADHDUFLAG | Total packets | Discarded packets |
| A | 0 | 100 | 0 |
| B | 0 | 100 | 0 |
| C | 0 | 100 | 0 |
| D | 0 | 100 | 0 |
| Quadrant | Total seconds | Saturated seconds | Saturation percentage |
|---|---|---|---|
| A | 4922 | 6 | 0.121902% |
| B | 4922 | 28 | 0.568874% |
| C | 4922 | 135 | 2.742787% |
| D | 4921 | 823 | 16.724243% |
Noise dominated data is calculated using 1-second bins in cleaned event files. If a bin has >2000 counts, and if more than 50% of those come from <1% of pixels, then it is considered to be noise-dominated and hence unusable.
| Quadrant | # 1 sec bins | Bins with >0 counts | Bins with >2000 counts | High rate bins dominated by noise | Noise dominated (total time) | Noise dominated (detector-on time) | Marked lightcurve |
|---|---|---|---|---|---|---|---|
| A | 7015 | 4923 | 4 | 4 | 0.06% | 0.08% | 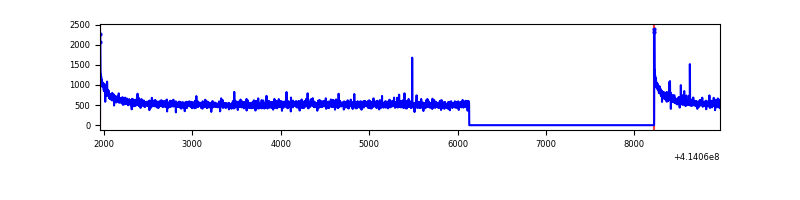 |
| B | 7014 | 4921 | 18 | 18 | 0.26% | 0.37% | 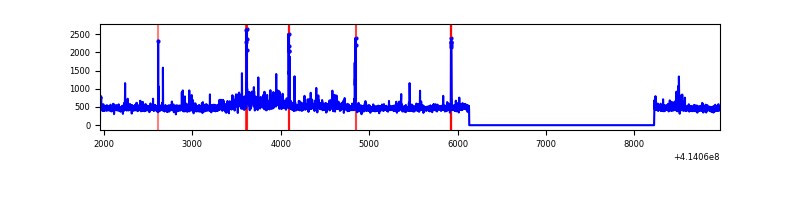 |
| C | 7014 | 4921 | 128 | 128 | 1.82% | 2.60% | 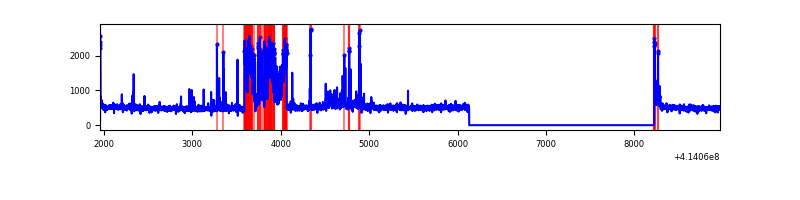 |
| D | 7014 | 4921 | 863 | 863 | 12.30% | 17.54% | 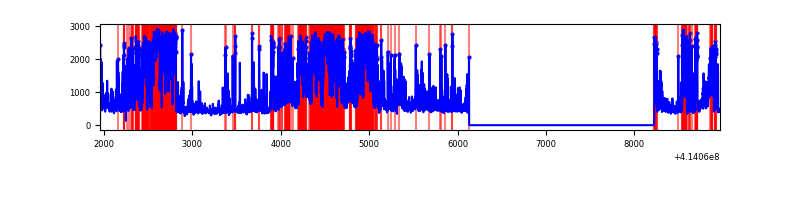 |
Top three noisy pixels from each quadrant. If the there are fewer than three noisy pixels in the level2.evt file, extra rows are filled as -1
| Pixel properties | Quadrant properties | ||||||
|---|---|---|---|---|---|---|---|
| Quadrant | DetID | PixID | Counts | Sigma | Mean | Median | Sigma |
| A | 10 | 83 | 450100 | 3883.59 | 571 | 563 | 115.8 |
| A | 13 | 248 | 14893 | 123.8 | 571 | 563 | 115.8 |
| A | 13 | 254 | 7823 | 62.72 | 571 | 563 | 115.8 |
| B | 0 | 230 | 73149 | 657.97 | 563 | 549 | 110.3 |
| B | 0 | 229 | 69144 | 621.67 | 563 | 549 | 110.3 |
| B | 5 | 32 | 63251 | 568.26 | 563 | 549 | 110.3 |
| C | 9 | 54 | 596990 | 4630.44 | 551 | 556 | 128.8 |
| C | 15 | 214 | 224112 | 1735.59 | 551 | 556 | 128.8 |
| C | 14 | 254 | 65641 | 505.29 | 551 | 556 | 128.8 |
| D | 12 | 233 | 1046541 | 8054.12 | 525 | 511 | 129.9 |
| D | 1 | 47 | 988191 | 7604.84 | 525 | 511 | 129.9 |
| D | 2 | 249 | 435162 | 3346.68 | 525 | 511 | 129.9 |
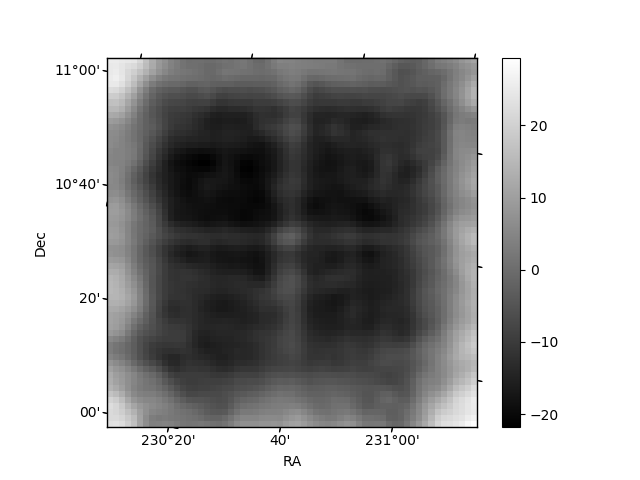
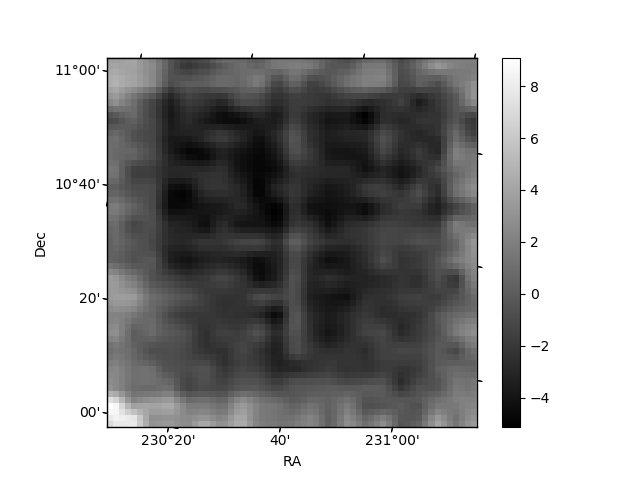
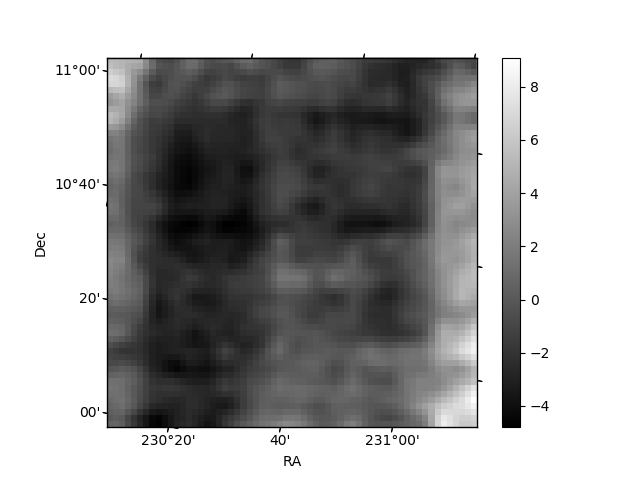
Histogram calculated using DETX and DETY for each event in the final _common_clean file
| Quadrant A | 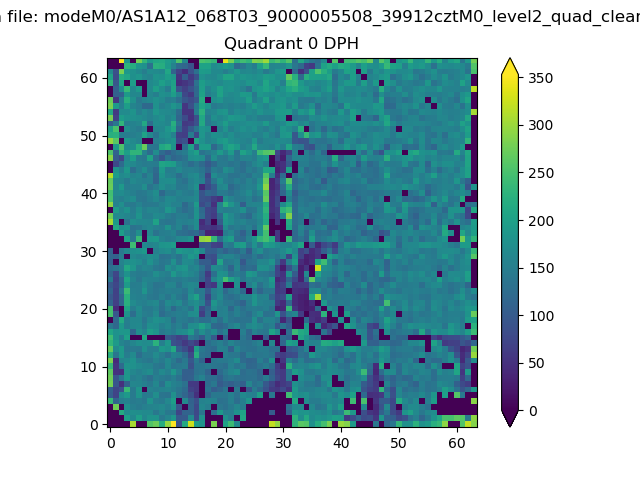 |
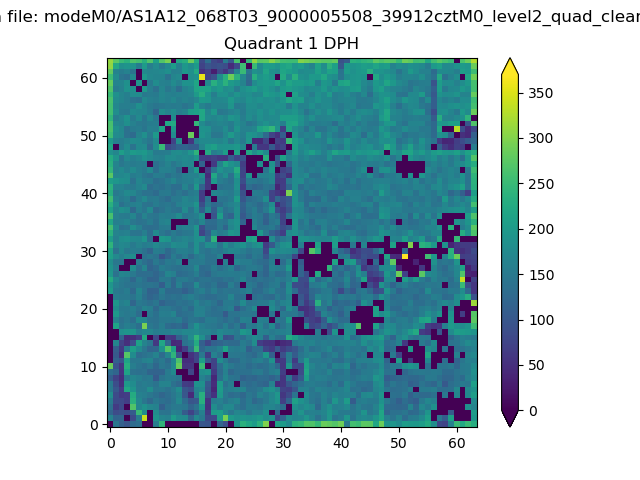 |
Quadrant B |
|---|---|---|---|
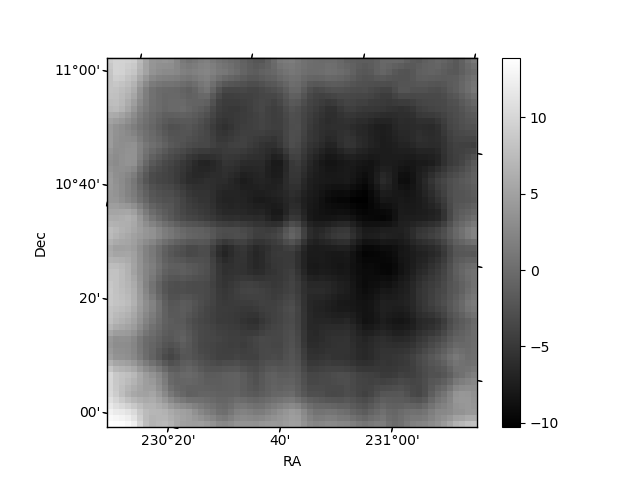
| Quadrant D | 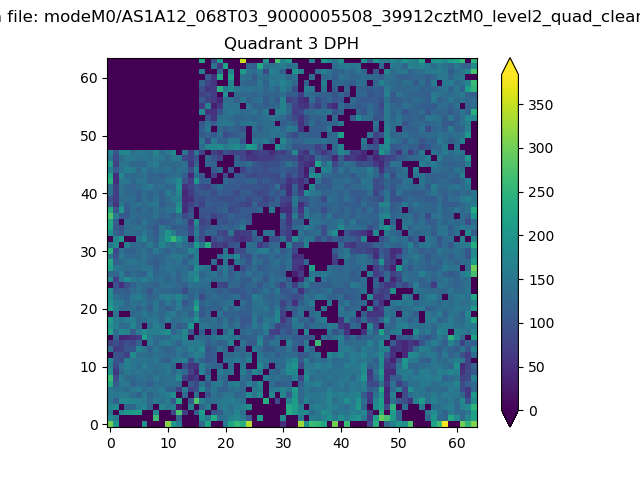 |
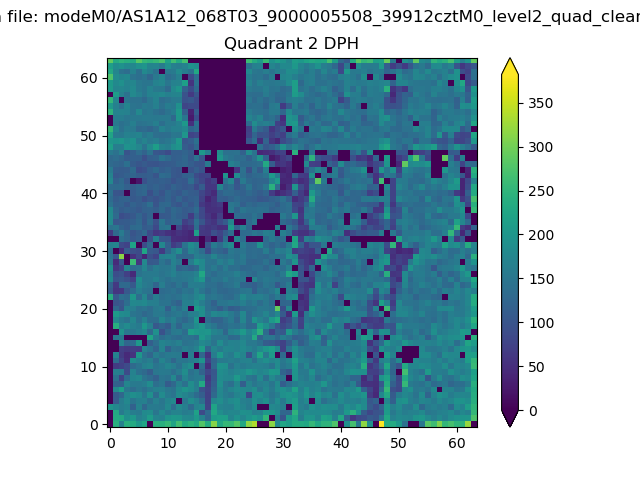 |
Quadrant C |
| Plot type | Count rate plots | Images |
|---|---|---|
| Comparison with Poisson distribution Blue bars denote a histogram of data divided into 1 sec bins. Red curve is a Poisson curve with rate = median count rate of data. |
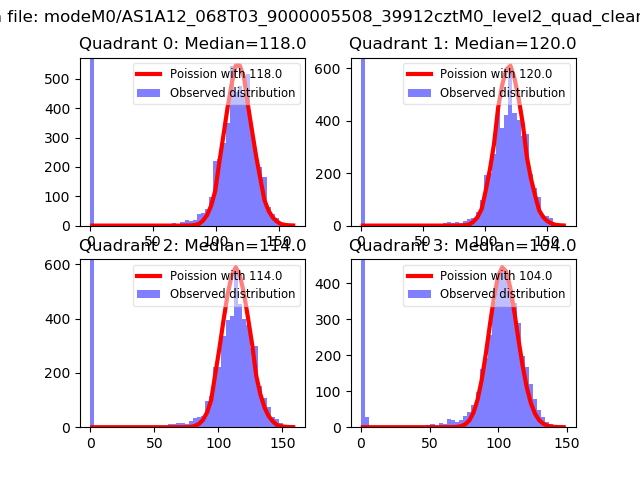 |
 |
| Quadrant-wise count rates Data is divided into 100 sec bins |
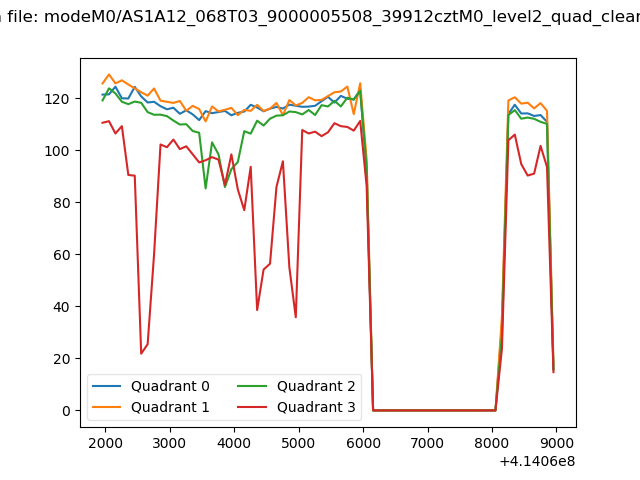 |
|
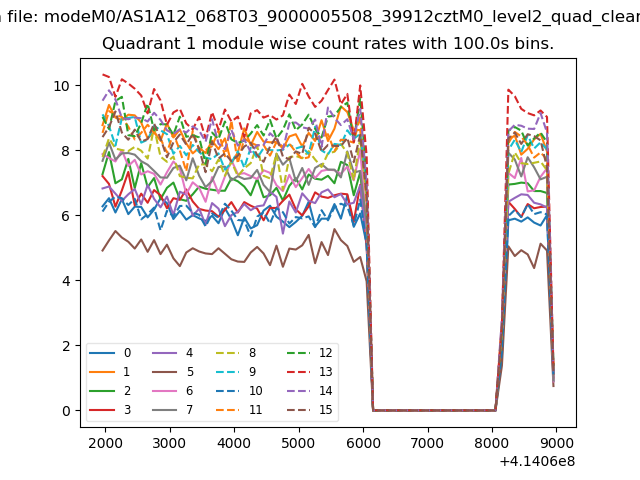
| Module-wise count rates for Quadrant A Data is divided into 100 sec bins |
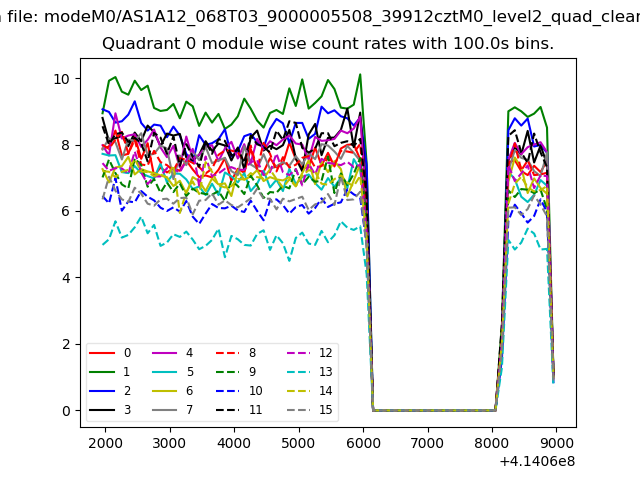 |
 |
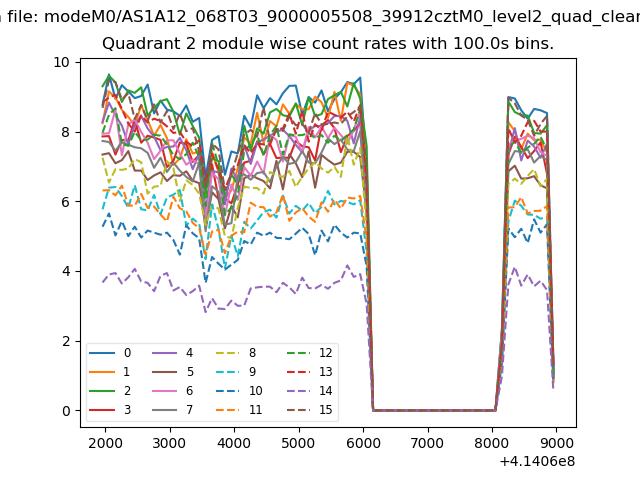
| Module-wise count rates for Quadrant B Data is divided into 100 sec bins |
 |
 |
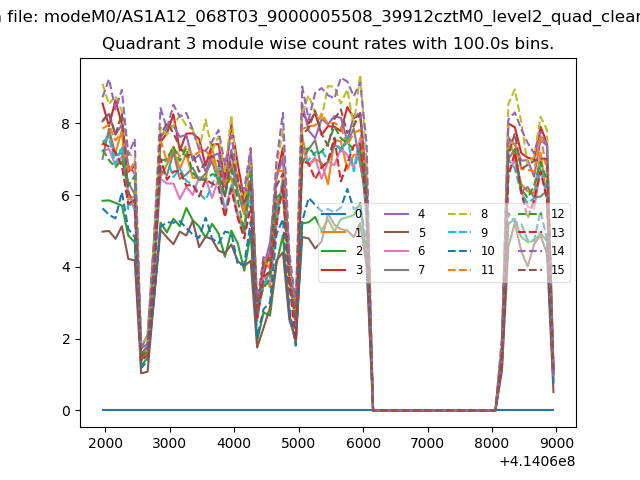
| Module-wise count rates for Quadrant C Data is divided into 100 sec bins |
 |
 |
| Module-wise count rates for Quadrant D Data is divided into 100 sec bins |
 |
 |
| Parameter | Plot |
|---|---|
| CZT HV Monitor | 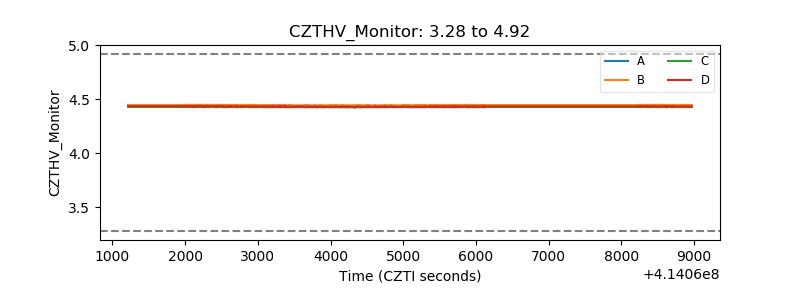 |
| D_VDD | 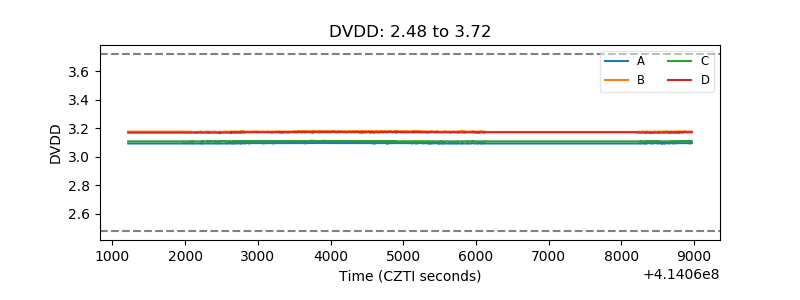 |
| Temperature 1 | 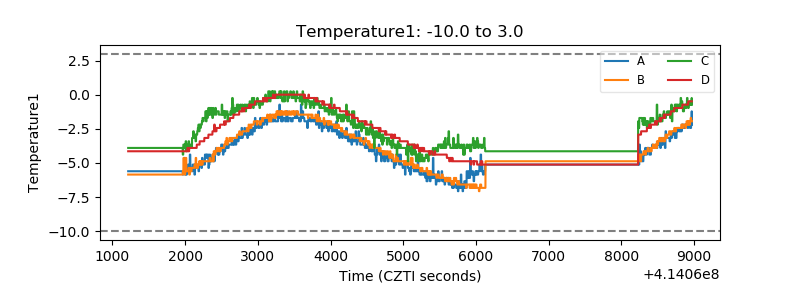 |
| Veto HV Monitor | 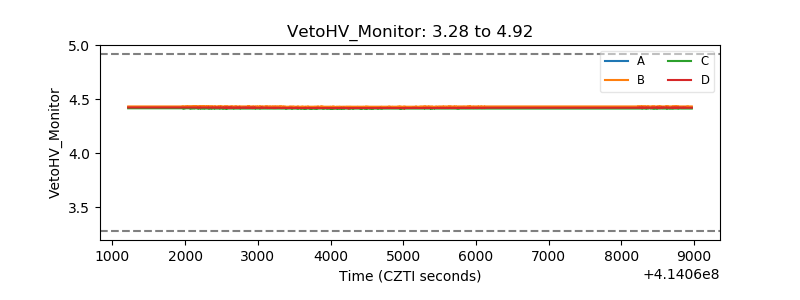 |
| Veto LLD | 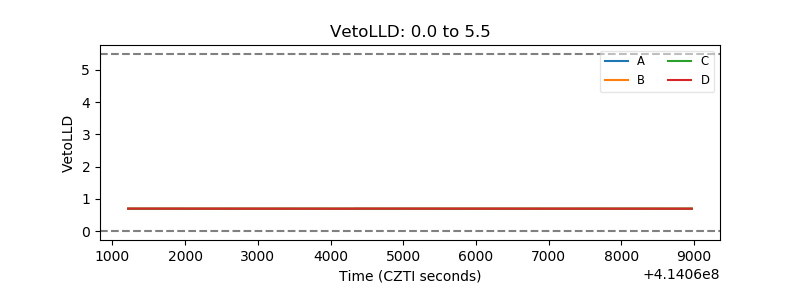 |
| Alpha Counter | 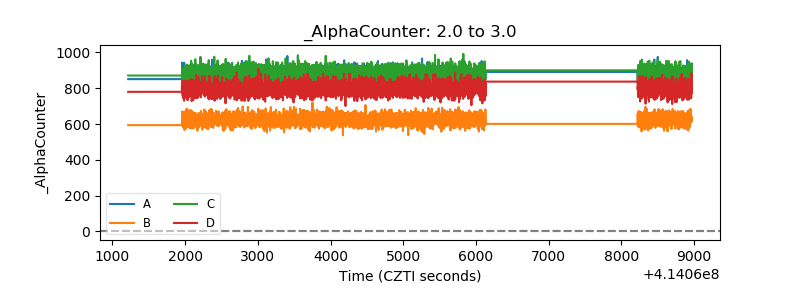 |
| _CPM_Rate | 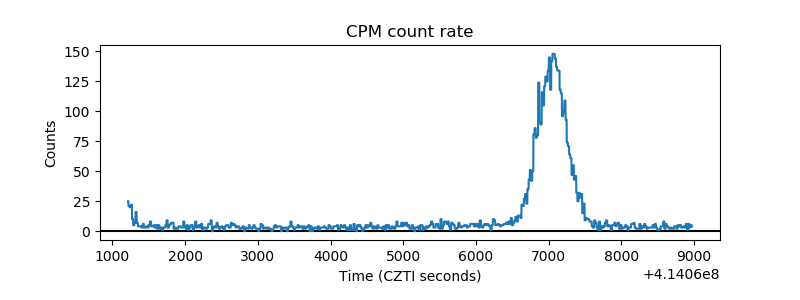 |
| CZT Counter | 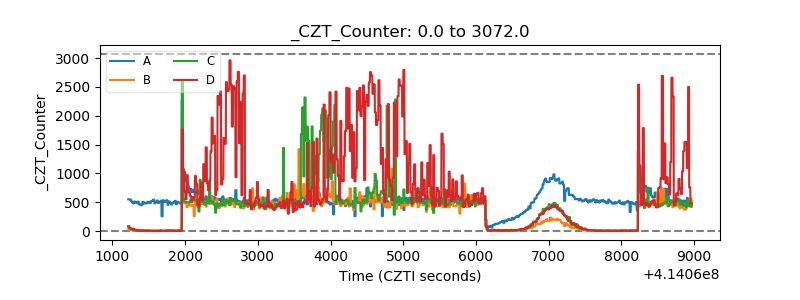 |
| +2.5 Volts monitor | 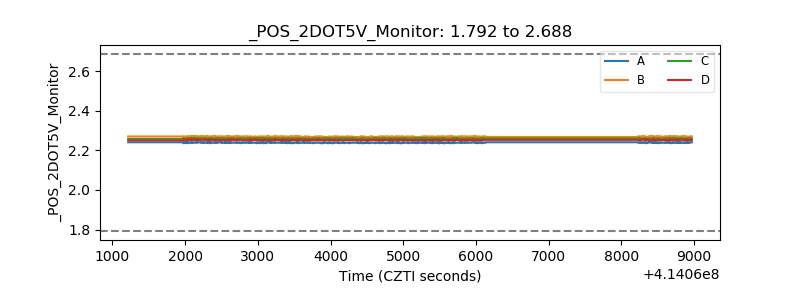 |
| +5 Volts monitor | 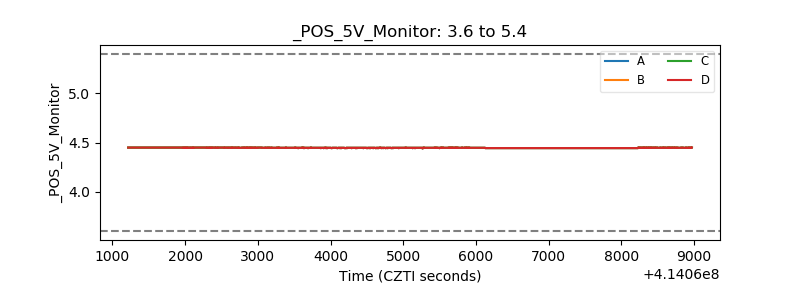 |
| _ROLL_ROT | 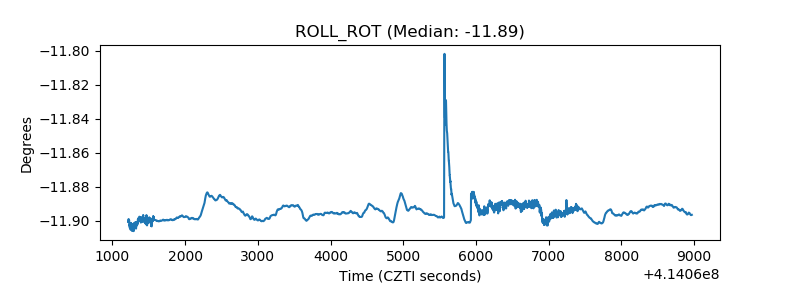 |
| _Roll_DEC | 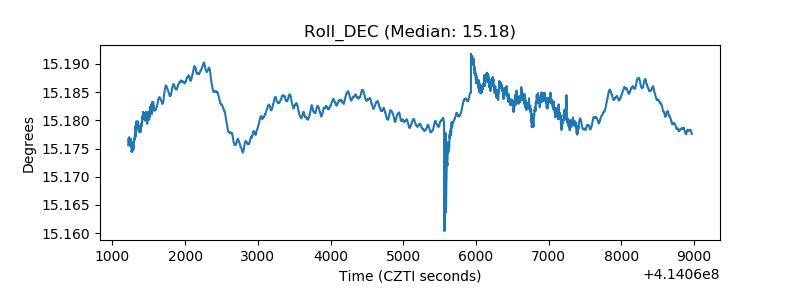 |
| _Roll_RA | 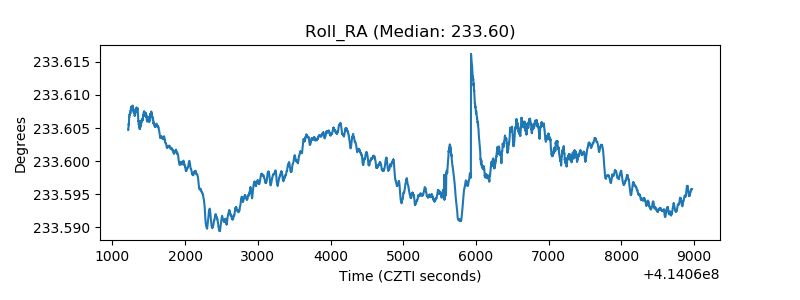 |
| Veto Counter | 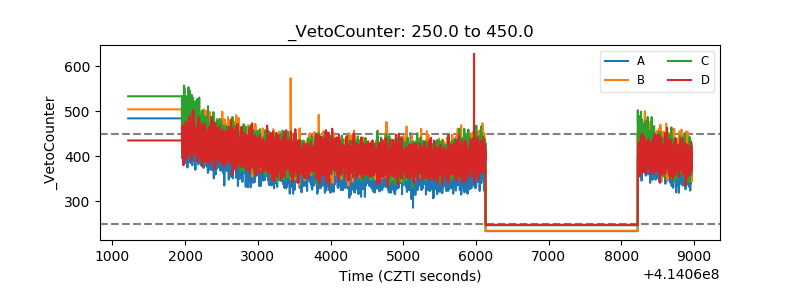 |