| Param | Original file | Final file |
|---|---|---|
| Filename | modeM0/AS1A12_068T03_9000005508_39914cztM0_level2.fits | modeM0/AS1A12_068T03_9000005508_39914cztM0_level2_quad_clean.evt |
| Size (bytes) | 340,865,280 | 91,883,520 |
| Size | 325.1 MB | 87.6 MB |
| Events in quadrant A | 3,005,353 | 615,935 |
| Events in quadrant B | 2,918,292 | 625,517 |
| Events in quadrant C | 3,153,568 | 597,563 |
| Events in quadrant D | 3,106,415 | 553,339 |
| Mode M9 | |||
|---|---|---|---|
| Quadrant | BADHDUFLAG | Total packets | Discarded packets |
| A | 0 | 25 | 0 |
| B | 0 | 25 | 0 |
| C | 0 | 25 | 0 |
| D | 0 | 26 | 0 |
| Mode M0 | |||
|---|---|---|---|
| Quadrant | BADHDUFLAG | Total packets | Discarded packets |
| A | 0 | 12253 | 3 |
| B | 0 | 12392 | 2 |
| C | 0 | 12860 | 2 |
| D | 0 | 12989 | 2 |
| Mode SS | |||
|---|---|---|---|
| Quadrant | BADHDUFLAG | Total packets | Discarded packets |
| A | 0 | 112 | 0 |
| B | 0 | 112 | 0 |
| C | 0 | 112 | 0 |
| D | 0 | 112 | 0 |
| Quadrant | Total seconds | Saturated seconds | Saturation percentage |
|---|---|---|---|
| A | 5575 | 30 | 0.538117% |
| B | 5575 | 44 | 0.789238% |
| C | 5575 | 80 | 1.434978% |
| D | 5575 | 83 | 1.488789% |
Noise dominated data is calculated using 1-second bins in cleaned event files. If a bin has >2000 counts, and if more than 50% of those come from <1% of pixels, then it is considered to be noise-dominated and hence unusable.
| Quadrant | # 1 sec bins | Bins with >0 counts | Bins with >2000 counts | High rate bins dominated by noise | Noise dominated (total time) | Noise dominated (detector-on time) | Marked lightcurve |
|---|---|---|---|---|---|---|---|
| A | 7097 | 5576 | 22 | 22 | 0.31% | 0.39% | 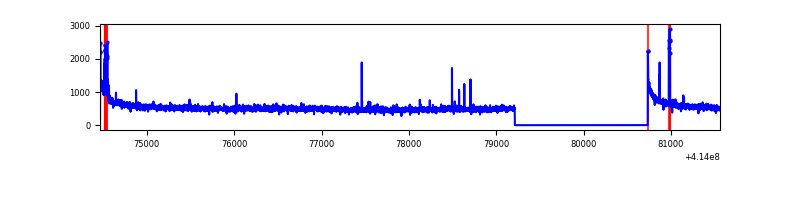 |
| B | 7096 | 5574 | 21 | 21 | 0.30% | 0.38% | 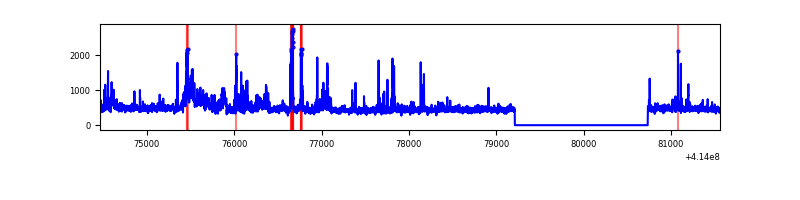 |
| C | 7096 | 5574 | 73 | 73 | 1.03% | 1.31% | 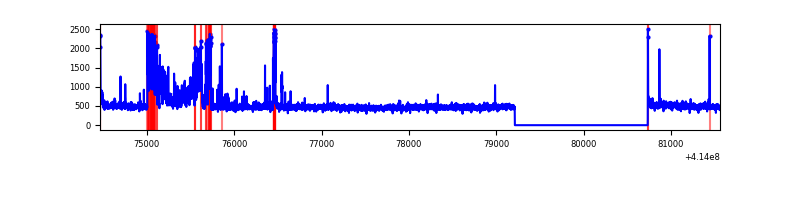 |
| D | 7096 | 5574 | 83 | 83 | 1.17% | 1.49% | 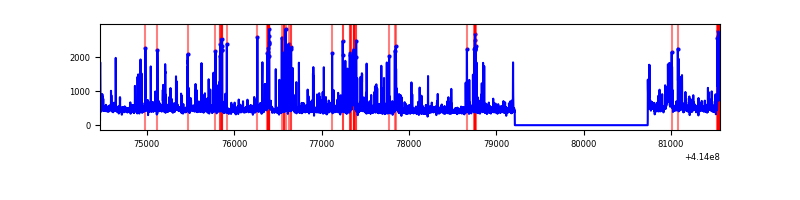 |
Top three noisy pixels from each quadrant. If the there are fewer than three noisy pixels in the level2.evt file, extra rows are filled as -1
| Pixel properties | Quadrant properties | ||||||
|---|---|---|---|---|---|---|---|
| Quadrant | DetID | PixID | Counts | Sigma | Mean | Median | Sigma |
| A | 10 | 83 | 498894 | 3898.84 | 622 | 611 | 127.8 |
| A | 13 | 248 | 61766 | 478.51 | 622 | 611 | 127.8 |
| A | 10 | 248 | 17546 | 132.51 | 622 | 611 | 127.8 |
| B | 4 | 170 | 203756 | 1692.71 | 616 | 600 | 120.0 |
| B | 5 | 32 | 92954 | 769.5 | 616 | 600 | 120.0 |
| B | 0 | 230 | 51812 | 426.7 | 616 | 600 | 120.0 |
| C | 9 | 54 | 516279 | 3635.65 | 605 | 610 | 141.8 |
| C | 15 | 214 | 234242 | 1647.19 | 605 | 610 | 141.8 |
| C | 0 | 10 | 15894 | 107.76 | 605 | 610 | 141.8 |
| D | 2 | 250 | 237778 | 1554.47 | 608 | 590 | 152.6 |
| D | 2 | 249 | 138742 | 905.41 | 608 | 590 | 152.6 |
| D | 13 | 249 | 122632 | 799.83 | 608 | 590 | 152.6 |
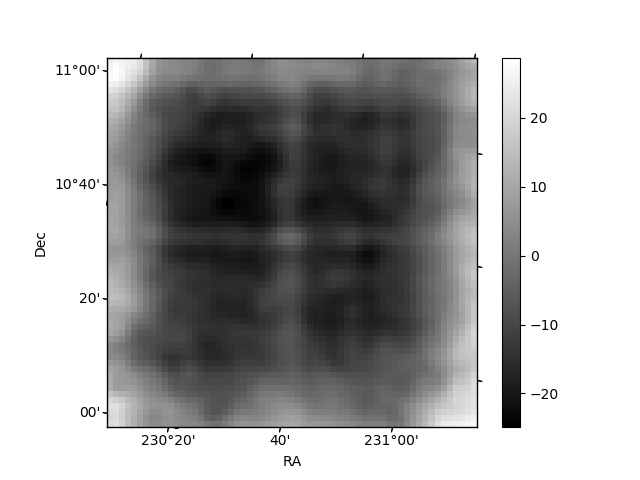
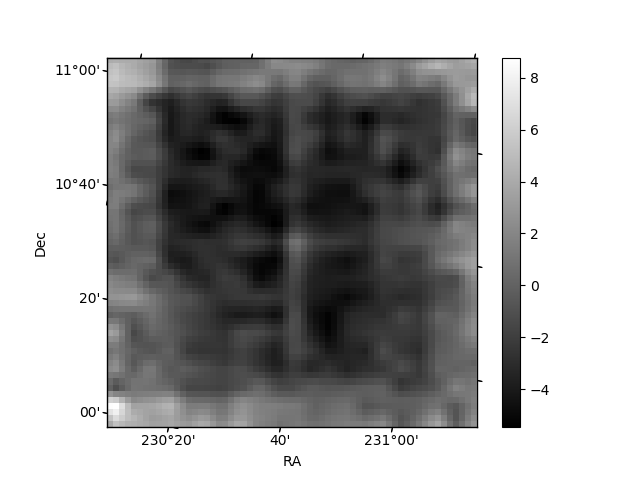
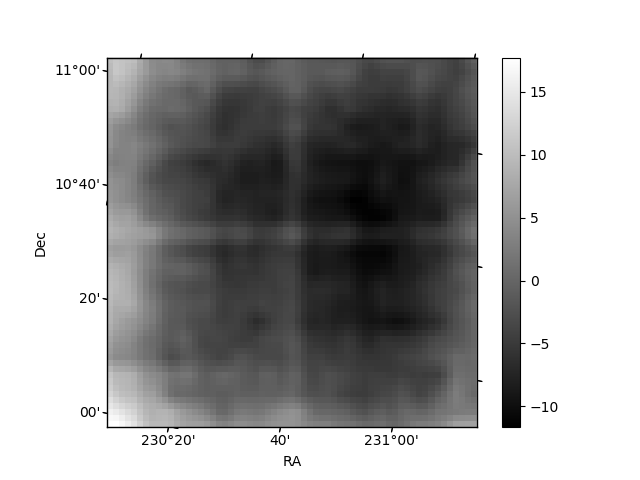
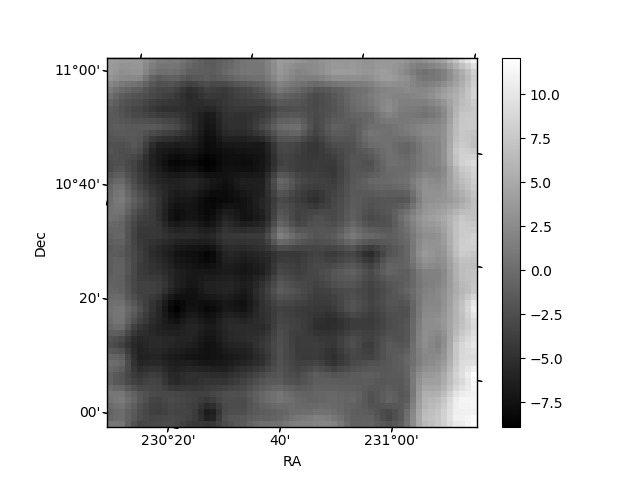
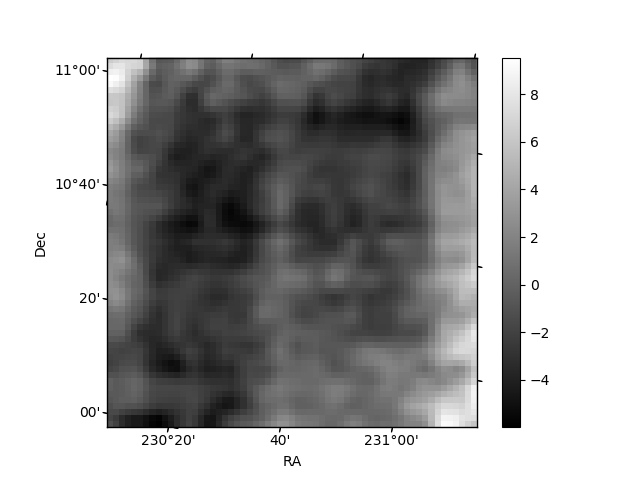
Histogram calculated using DETX and DETY for each event in the final _common_clean file
| Quadrant A | 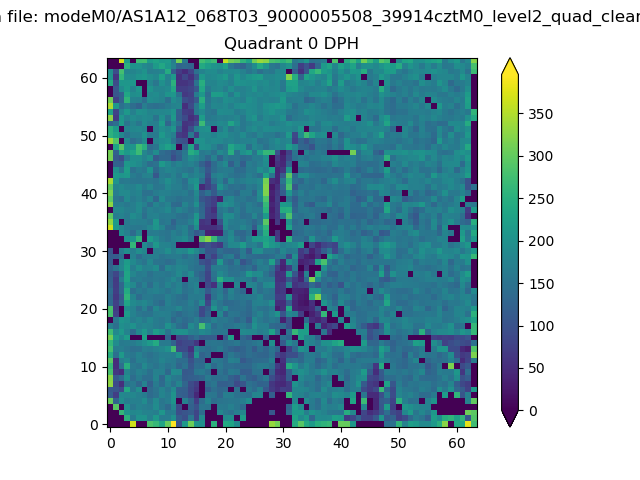 |
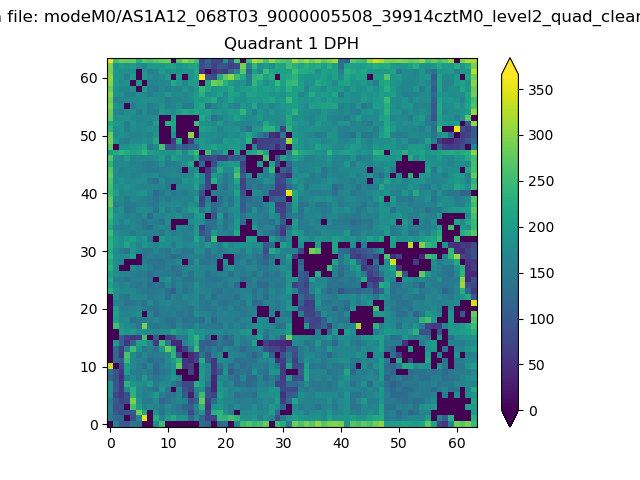 |
Quadrant B |
|---|---|---|---|
| Quadrant D | 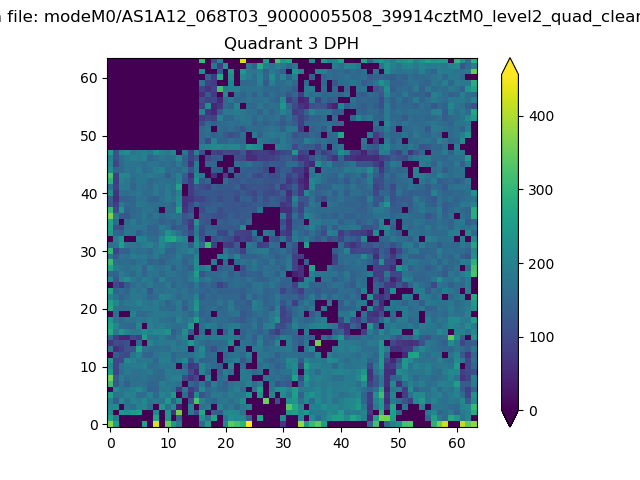 |
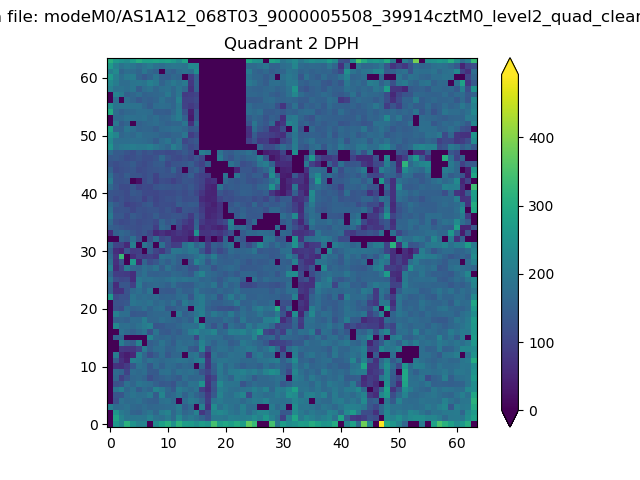 |
Quadrant C |
| Plot type | Count rate plots | Images |
|---|---|---|
| Comparison with Poisson distribution Blue bars denote a histogram of data divided into 1 sec bins. Red curve is a Poisson curve with rate = median count rate of data. |
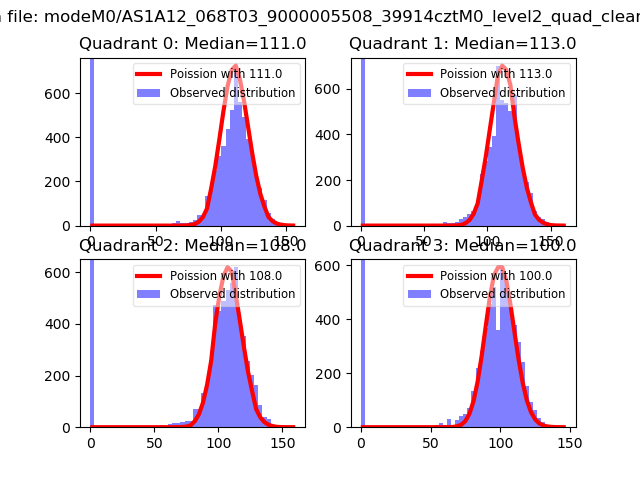 |
 |
| Quadrant-wise count rates Data is divided into 100 sec bins |
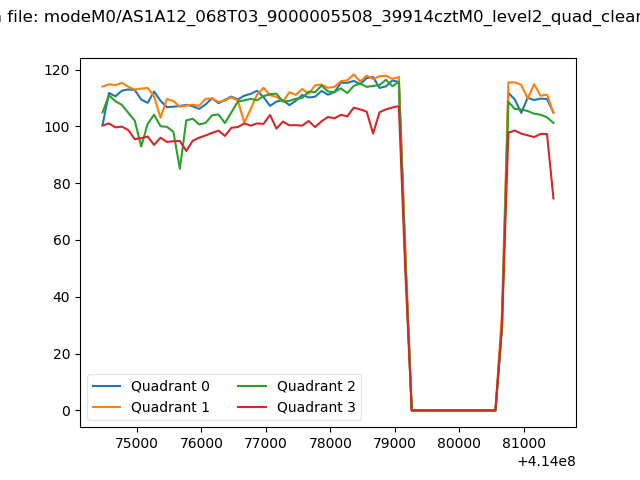 |
|
| Module-wise count rates for Quadrant A Data is divided into 100 sec bins |
 |
 |
| Module-wise count rates for Quadrant B Data is divided into 100 sec bins |
 |
 |
| Module-wise count rates for Quadrant C Data is divided into 100 sec bins |
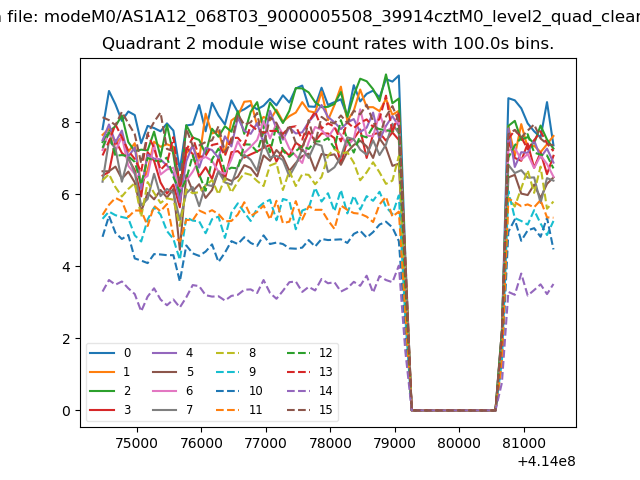 |
 |
| Module-wise count rates for Quadrant D Data is divided into 100 sec bins |
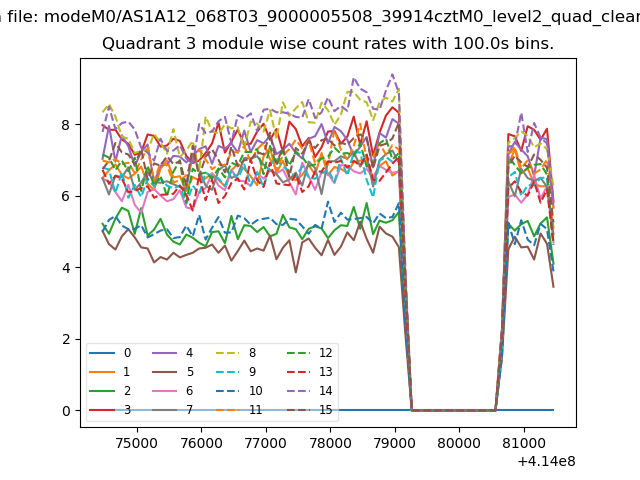 |
 |
| Parameter | Plot |
|---|---|
| CZT HV Monitor | 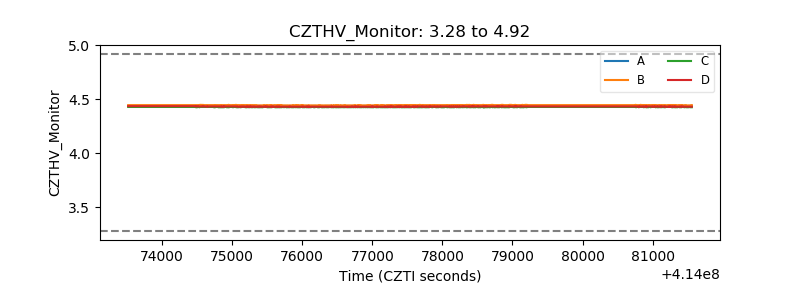 |
| D_VDD |  |
| Temperature 1 |  |
| Veto HV Monitor | 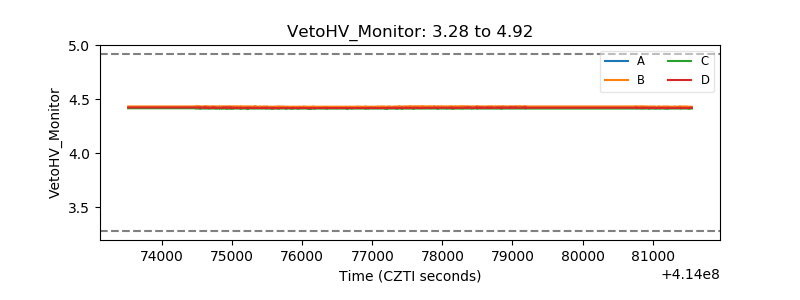 |
| Veto LLD | 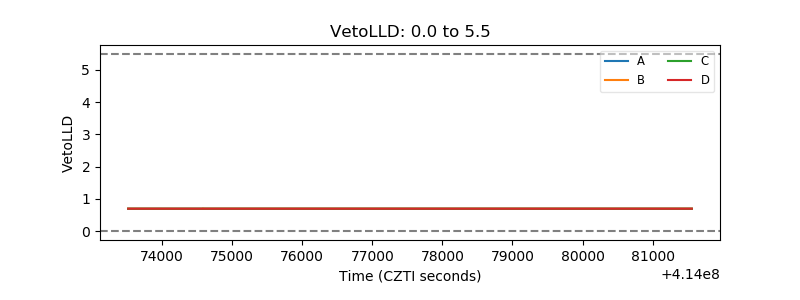 |
| Alpha Counter | 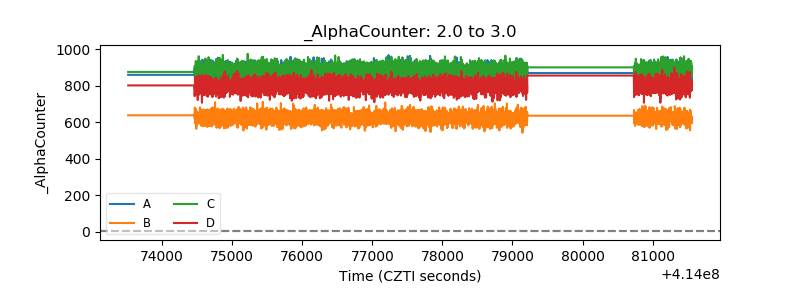 |
| _CPM_Rate | 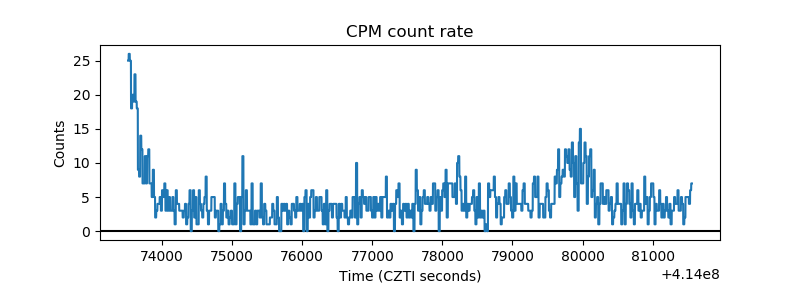 |
| CZT Counter | 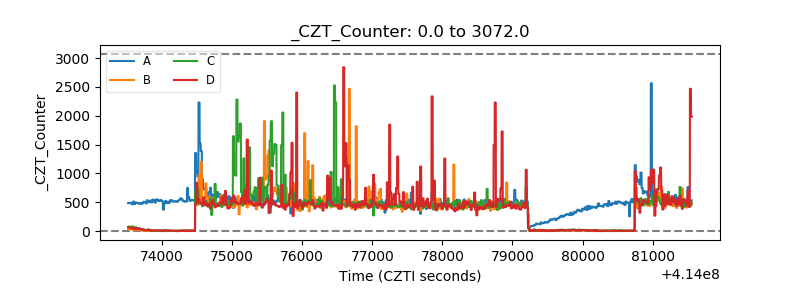 |
| +2.5 Volts monitor | 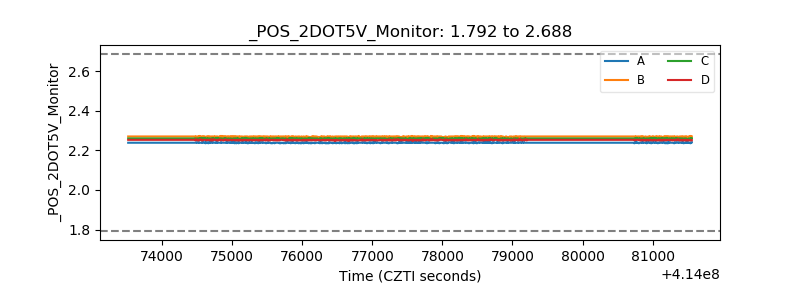 |
| +5 Volts monitor | 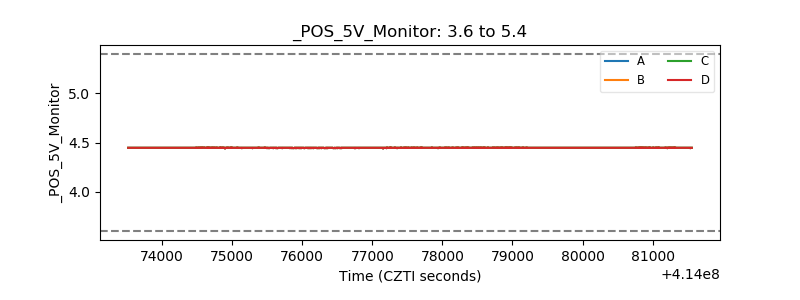 |
| _ROLL_ROT | 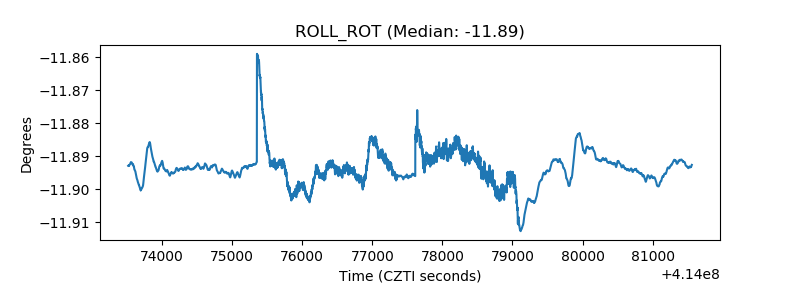 |
| _Roll_DEC | 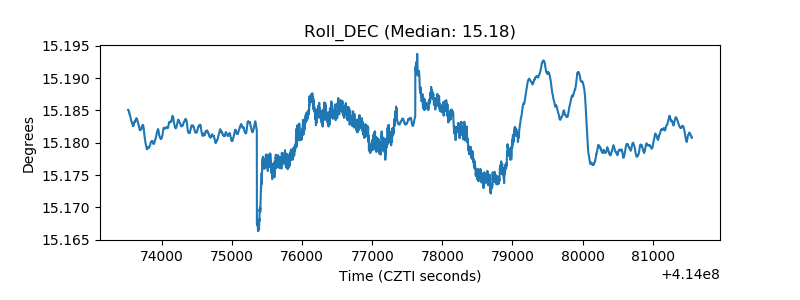 |
| _Roll_RA | 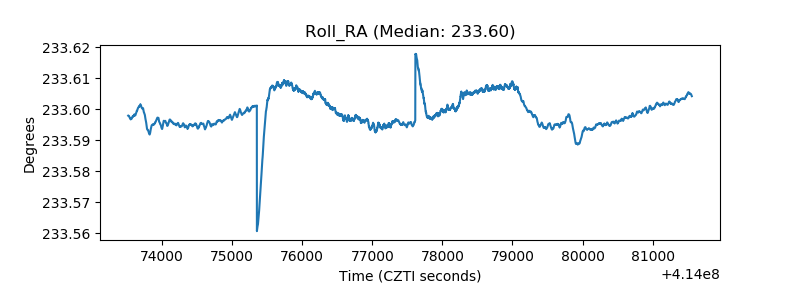 |
| Veto Counter | 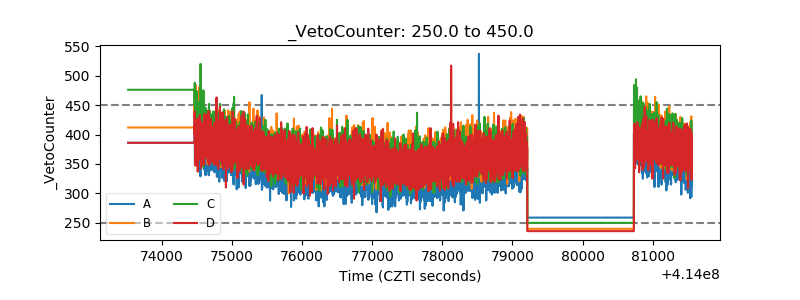 |