| Param | Original file | Final file |
|---|---|---|
| Filename | modeM0/AS1A12_068T03_9000005508_39915cztM0_level2.fits | modeM0/AS1A12_068T03_9000005508_39915cztM0_level2_quad_clean.evt |
| Size (bytes) | 368,899,200 | 97,410,240 |
| Size | 351.8 MB | 92.9 MB |
| Events in quadrant A | 3,199,625 | 652,430 |
| Events in quadrant B | 2,975,617 | 662,971 |
| Events in quadrant C | 3,182,598 | 631,908 |
| Events in quadrant D | 3,831,505 | 583,785 |
| Mode M9 | |||
|---|---|---|---|
| Quadrant | BADHDUFLAG | Total packets | Discarded packets |
| A | 0 | 24 | 0 |
| B | 0 | 24 | 0 |
| C | 0 | 24 | 0 |
| D | 0 | 25 | 0 |
| Mode M0 | |||
|---|---|---|---|
| Quadrant | BADHDUFLAG | Total packets | Discarded packets |
| A | 0 | 13163 | 3 |
| B | 0 | 12947 | 2 |
| C | 0 | 13246 | 2 |
| D | 0 | 15567 | 2 |
| Mode SS | |||
|---|---|---|---|
| Quadrant | BADHDUFLAG | Total packets | Discarded packets |
| A | 0 | 122 | 0 |
| B | 0 | 122 | 0 |
| C | 0 | 122 | 0 |
| D | 0 | 122 | 0 |
| Quadrant | Total seconds | Saturated seconds | Saturation percentage |
|---|---|---|---|
| A | 5988 | 29 | 0.484302% |
| B | 5988 | 73 | 1.219105% |
| C | 5988 | 118 | 1.970608% |
| D | 5988 | 174 | 2.905812% |
Noise dominated data is calculated using 1-second bins in cleaned event files. If a bin has >2000 counts, and if more than 50% of those come from <1% of pixels, then it is considered to be noise-dominated and hence unusable.
| Quadrant | # 1 sec bins | Bins with >0 counts | Bins with >2000 counts | High rate bins dominated by noise | Noise dominated (total time) | Noise dominated (detector-on time) | Marked lightcurve |
|---|---|---|---|---|---|---|---|
| A | 7330 | 5989 | 16 | 16 | 0.22% | 0.27% | 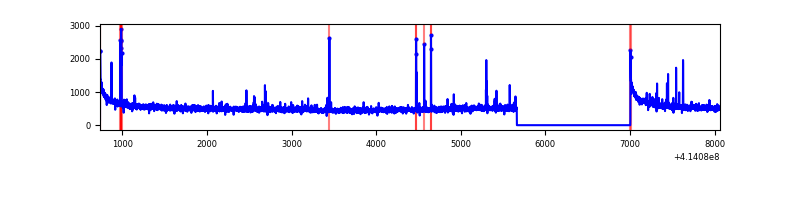 |
| B | 7329 | 5987 | 32 | 32 | 0.44% | 0.53% | 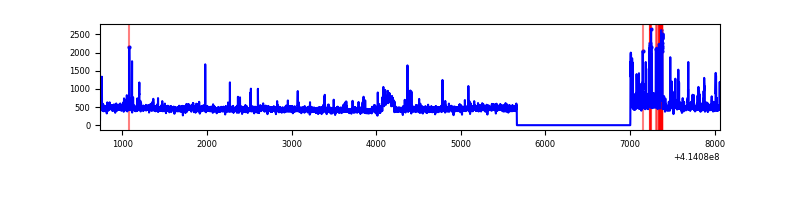 |
| C | 7329 | 5987 | 118 | 118 | 1.61% | 1.97% | 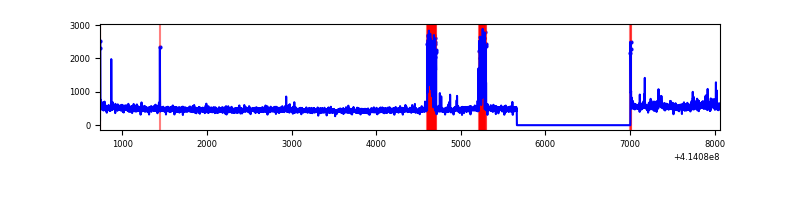 |
| D | 7329 | 5987 | 182 | 182 | 2.48% | 3.04% | 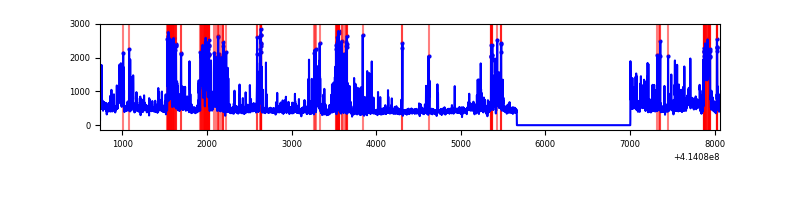 |
Top three noisy pixels from each quadrant. If the there are fewer than three noisy pixels in the level2.evt file, extra rows are filled as -1
| Pixel properties | Quadrant properties | ||||||
|---|---|---|---|---|---|---|---|
| Quadrant | DetID | PixID | Counts | Sigma | Mean | Median | Sigma |
| A | 10 | 83 | 515942 | 3772.53 | 666 | 652 | 136.6 |
| A | 2 | 79 | 41192 | 296.8 | 666 | 652 | 136.6 |
| A | 9 | 143 | 25786 | 184.01 | 666 | 652 | 136.6 |
| B | 4 | 171 | 196541 | 1512.21 | 658 | 639 | 129.5 |
| B | 4 | 170 | 58238 | 444.62 | 658 | 639 | 129.5 |
| B | 5 | 32 | 40734 | 309.5 | 658 | 639 | 129.5 |
| C | 14 | 254 | 308122 | 2025.67 | 645 | 650 | 151.8 |
| C | 15 | 214 | 244657 | 1607.56 | 645 | 650 | 151.8 |
| C | 9 | 54 | 81276 | 531.18 | 645 | 650 | 151.8 |
| D | 2 | 249 | 665818 | 4152.54 | 648 | 631 | 160.2 |
| D | 13 | 249 | 234848 | 1462.14 | 648 | 631 | 160.2 |
| D | 2 | 250 | 175445 | 1091.3 | 648 | 631 | 160.2 |
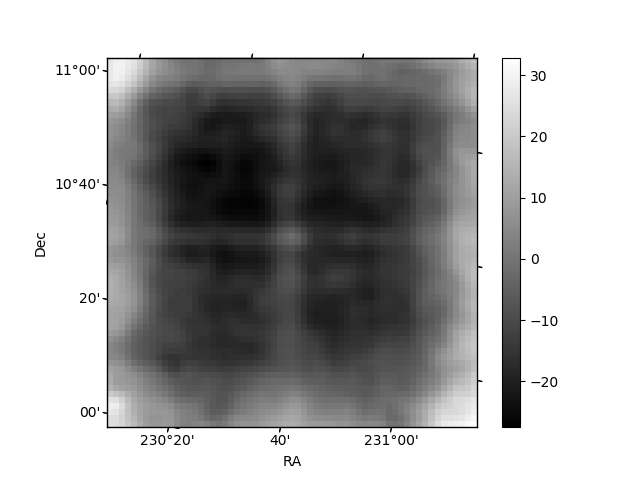
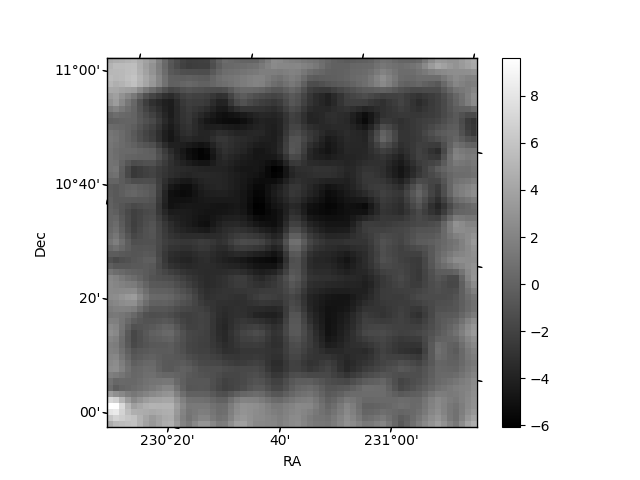
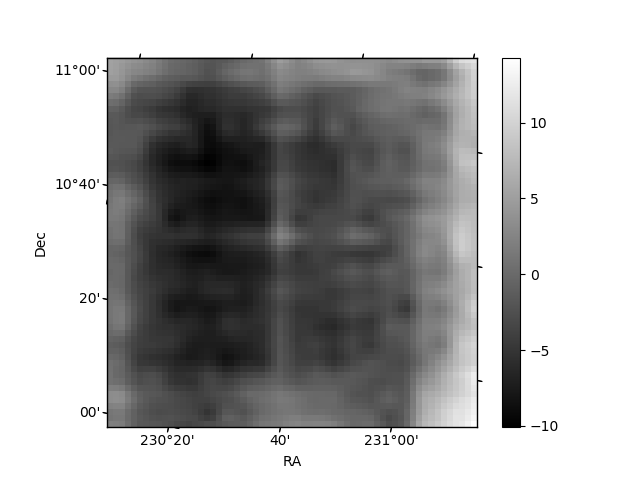
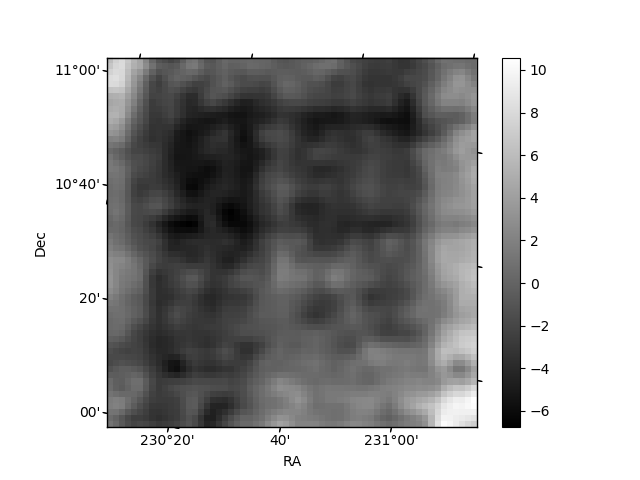
Histogram calculated using DETX and DETY for each event in the final _common_clean file
| Quadrant A | 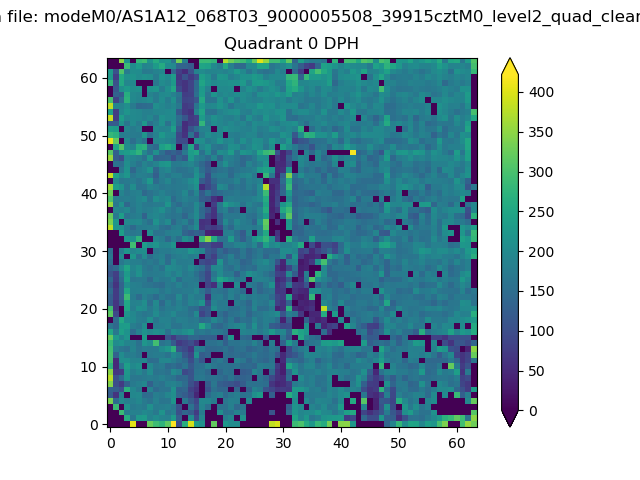 |
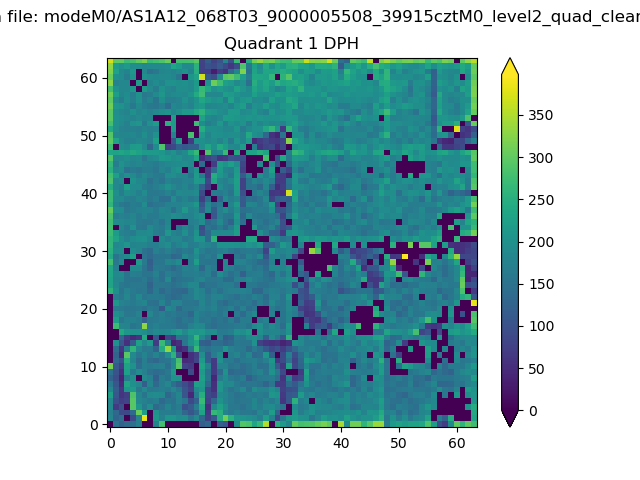 |
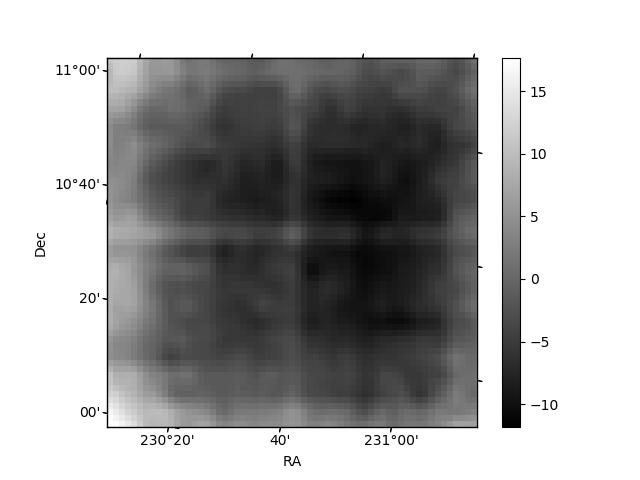
Quadrant B |
|---|---|---|---|
| Quadrant D | 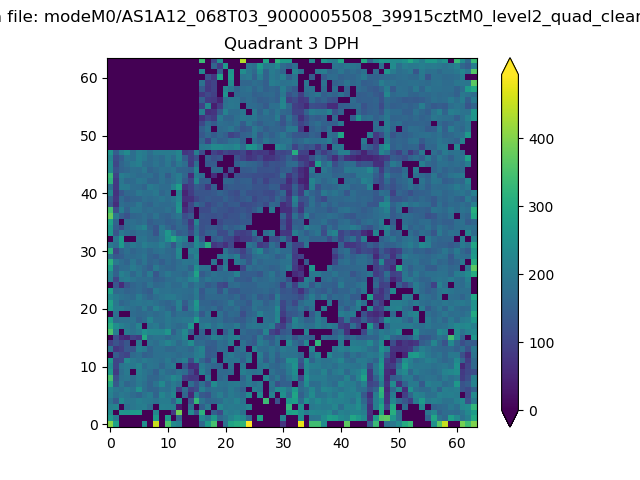 |
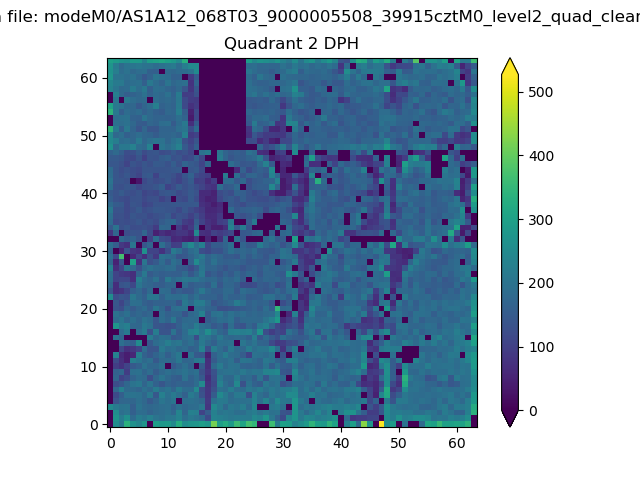 |
Quadrant C |
| Plot type | Count rate plots | Images |
|---|---|---|
| Comparison with Poisson distribution Blue bars denote a histogram of data divided into 1 sec bins. Red curve is a Poisson curve with rate = median count rate of data. |
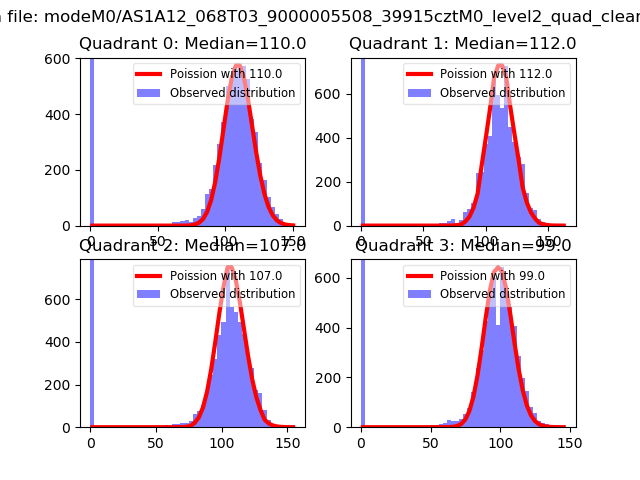 |
 |
| Quadrant-wise count rates Data is divided into 100 sec bins |
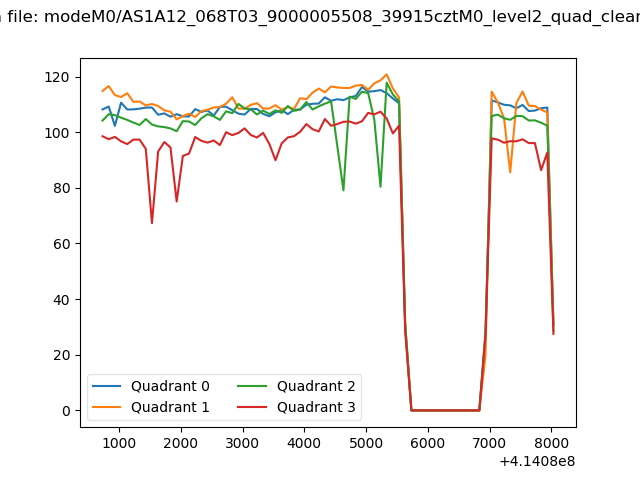 |
|
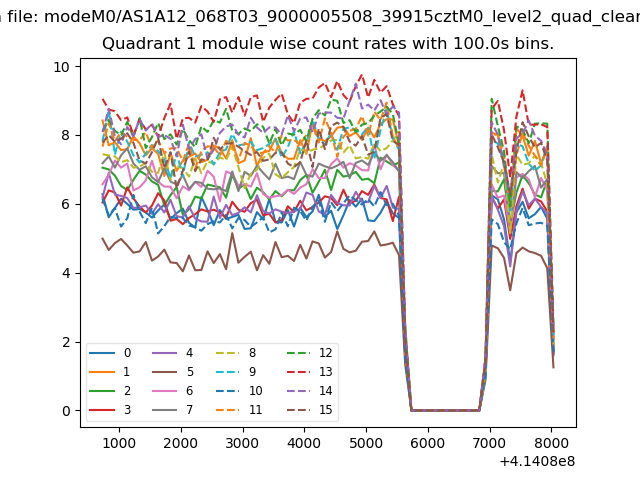
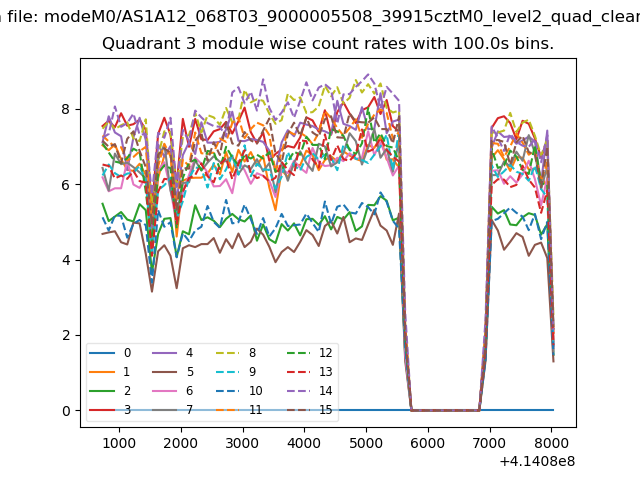
| Module-wise count rates for Quadrant A Data is divided into 100 sec bins |
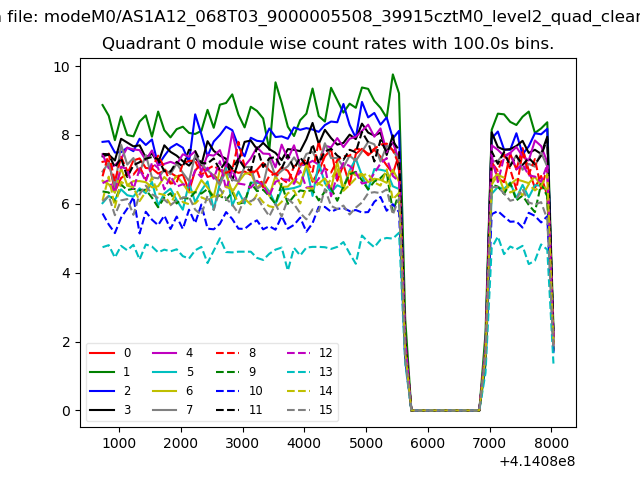 |
 |
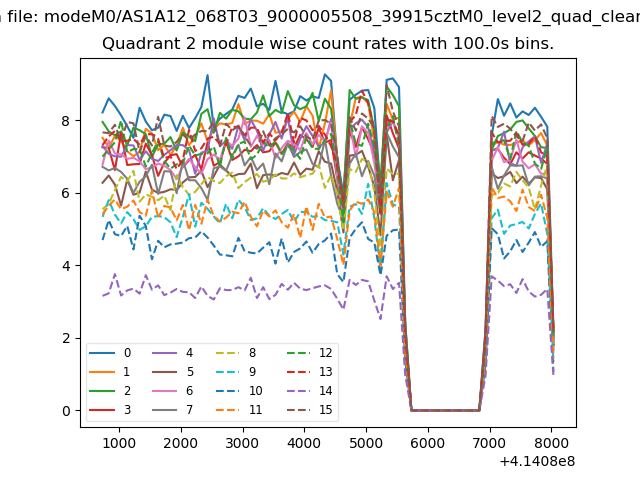
| Module-wise count rates for Quadrant B Data is divided into 100 sec bins |
 |
 |
| Module-wise count rates for Quadrant C Data is divided into 100 sec bins |
 |
 |
| Module-wise count rates for Quadrant D Data is divided into 100 sec bins |
 |
 |
| Parameter | Plot |
|---|---|
| CZT HV Monitor |  |
| D_VDD |  |
| Temperature 1 | 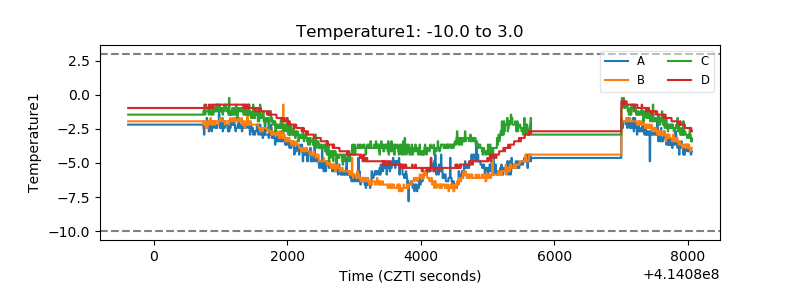 |
| Veto HV Monitor | 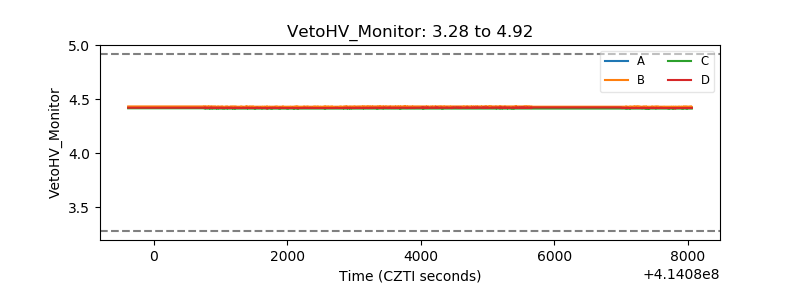 |
| Veto LLD |  |
| Alpha Counter | 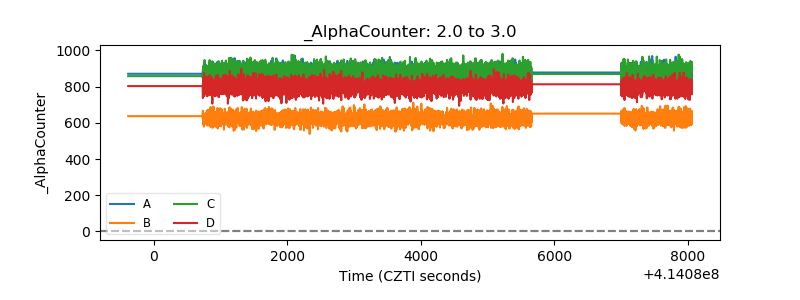 |
| _CPM_Rate | 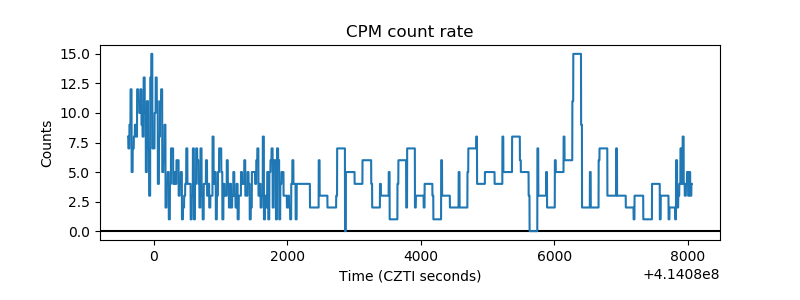 |
| CZT Counter | 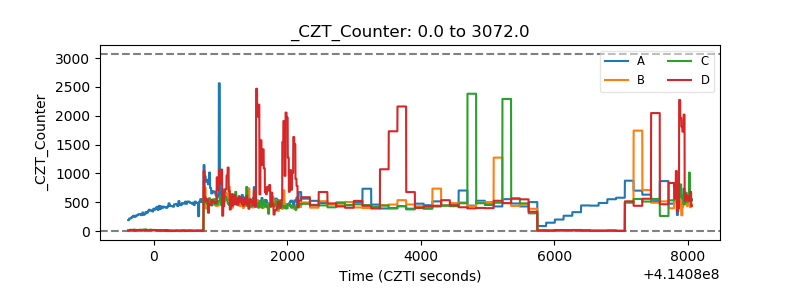 |
| +2.5 Volts monitor | 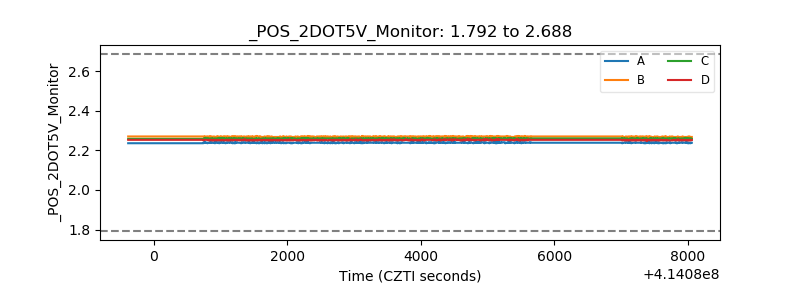 |
| +5 Volts monitor | 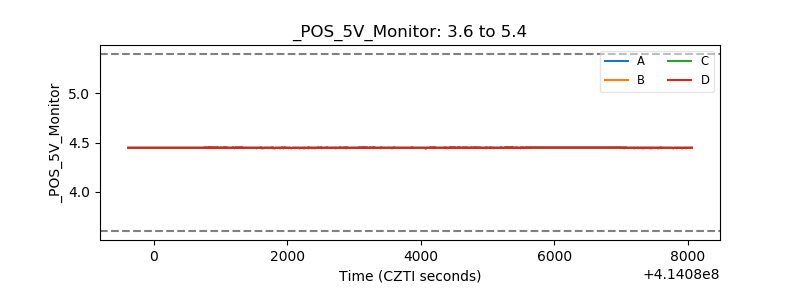 |
| _ROLL_ROT | 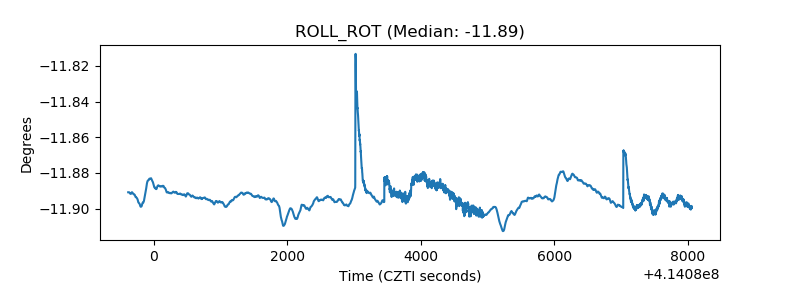 |
| _Roll_DEC | 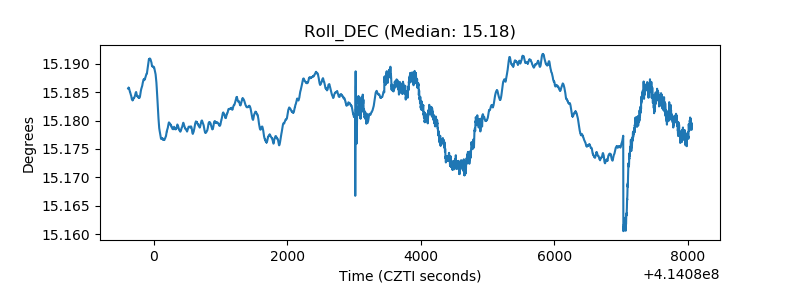 |
| _Roll_RA | 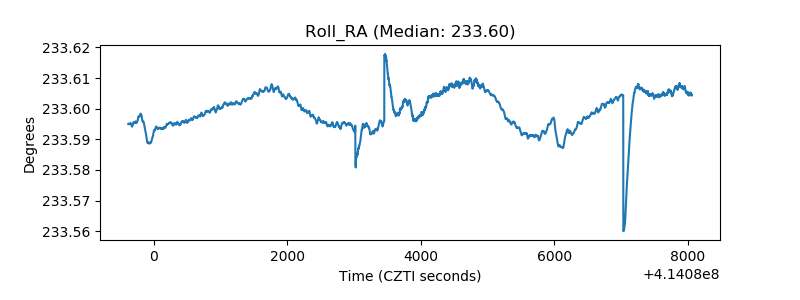 |
| Veto Counter | 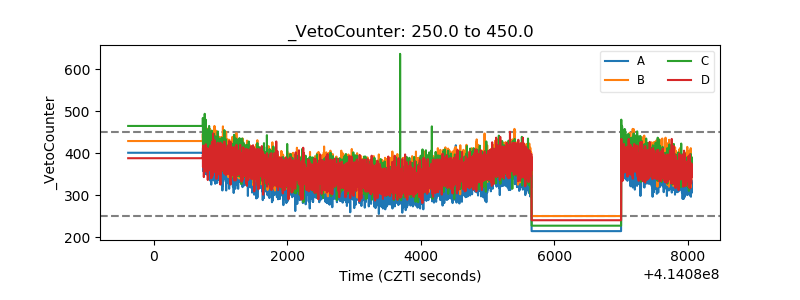 |