| Param | Original file | Final file |
|---|---|---|
| Filename | modeM0/AS1A12_068T03_9000005508_39920cztM0_level2.fits | modeM0/AS1A12_068T03_9000005508_39920cztM0_level2_quad_clean.evt |
| Size (bytes) | 367,937,280 | 88,251,840 |
| Size | 350.9 MB | 84.2 MB |
| Events in quadrant A | 2,773,977 | 603,220 |
| Events in quadrant B | 2,427,002 | 624,182 |
| Events in quadrant C | 2,641,706 | 595,688 |
| Events in quadrant D | 5,355,618 | 470,495 |
| Mode M9 | |||
|---|---|---|---|
| Quadrant | BADHDUFLAG | Total packets | Discarded packets |
| A | 0 | 31 | 0 |
| B | 0 | 31 | 0 |
| C | 0 | 31 | 0 |
| D | 0 | 32 | 0 |
| Mode M0 | |||
|---|---|---|---|
| Quadrant | BADHDUFLAG | Total packets | Discarded packets |
| A | 0 | 11666 | 3 |
| B | 0 | 11022 | 2 |
| C | 0 | 11298 | 2 |
| D | 0 | 19791 | 2 |
| Mode SS | |||
|---|---|---|---|
| Quadrant | BADHDUFLAG | Total packets | Discarded packets |
| A | 0 | 110 | 0 |
| B | 0 | 110 | 0 |
| C | 0 | 110 | 0 |
| D | 0 | 110 | 0 |
| Quadrant | Total seconds | Saturated seconds | Saturation percentage |
|---|---|---|---|
| A | 5410 | 10 | 0.184843% |
| B | 5410 | 7 | 0.129390% |
| C | 5410 | 8 | 0.147874% |
| D | 5410 | 903 | 16.691312% |
Noise dominated data is calculated using 1-second bins in cleaned event files. If a bin has >2000 counts, and if more than 50% of those come from <1% of pixels, then it is considered to be noise-dominated and hence unusable.
| Quadrant | # 1 sec bins | Bins with >0 counts | Bins with >2000 counts | High rate bins dominated by noise | Noise dominated (total time) | Noise dominated (detector-on time) | Marked lightcurve |
|---|---|---|---|---|---|---|---|
| A | 7112 | 5410 | 5 | 5 | 0.07% | 0.09% | 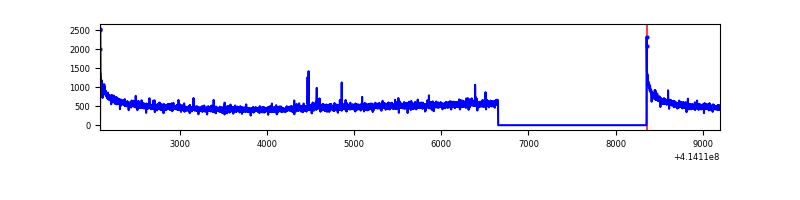 |
| B | 7113 | 5410 | 0 | 0 | 0.00% | 0.00% | 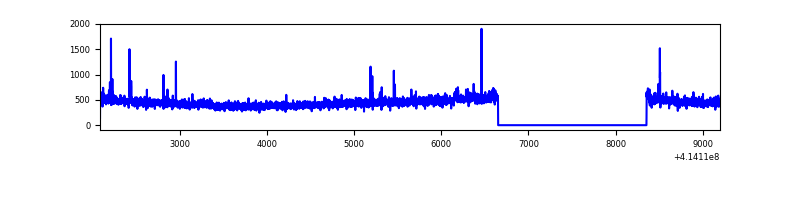 |
| C | 7113 | 5411 | 7 | 7 | 0.10% | 0.13% | 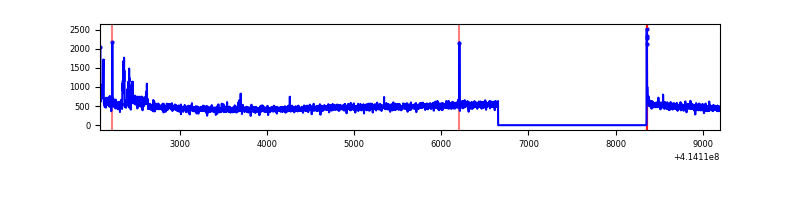 |
| D | 7113 | 5411 | 892 | 892 | 12.54% | 16.48% | 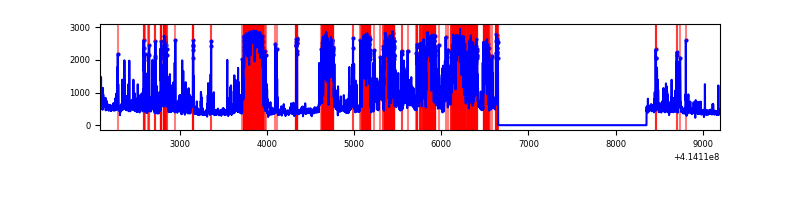 |
Top three noisy pixels from each quadrant. If the there are fewer than three noisy pixels in the level2.evt file, extra rows are filled as -1
| Pixel properties | Quadrant properties | ||||||
|---|---|---|---|---|---|---|---|
| Quadrant | DetID | PixID | Counts | Sigma | Mean | Median | Sigma |
| A | 10 | 83 | 449034 | 3680.55 | 592 | 581 | 121.8 |
| A | 13 | 248 | 12507 | 97.88 | 592 | 581 | 121.8 |
| A | 6 | 10 | 10349 | 80.17 | 592 | 581 | 121.8 |
| B | 0 | 230 | 42574 | 360.3 | 594 | 579 | 116.6 |
| B | 5 | 172 | 14974 | 123.5 | 594 | 579 | 116.6 |
| B | 12 | 111 | 14384 | 118.44 | 594 | 579 | 116.6 |
| C | 15 | 214 | 224041 | 1635.98 | 582 | 586 | 136.6 |
| C | 9 | 54 | 114052 | 830.72 | 582 | 586 | 136.6 |
| C | 0 | 10 | 20891 | 148.66 | 582 | 586 | 136.6 |
| D | 2 | 250 | 1423086 | 10822.54 | 529 | 515 | 131.4 |
| D | 2 | 249 | 941170 | 7156.25 | 529 | 515 | 131.4 |
| D | 12 | 227 | 816206 | 6205.56 | 529 | 515 | 131.4 |
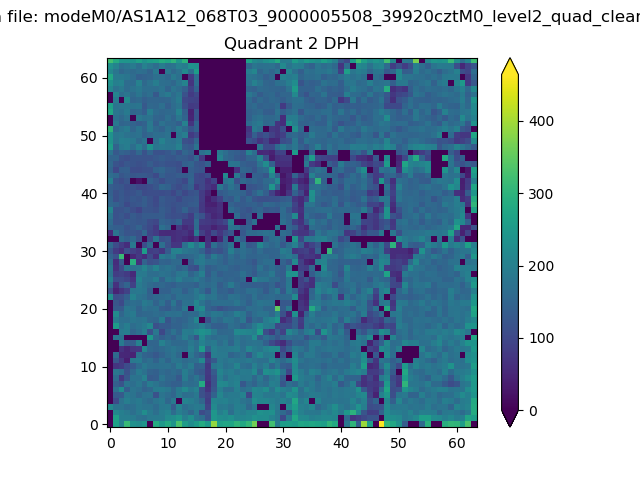
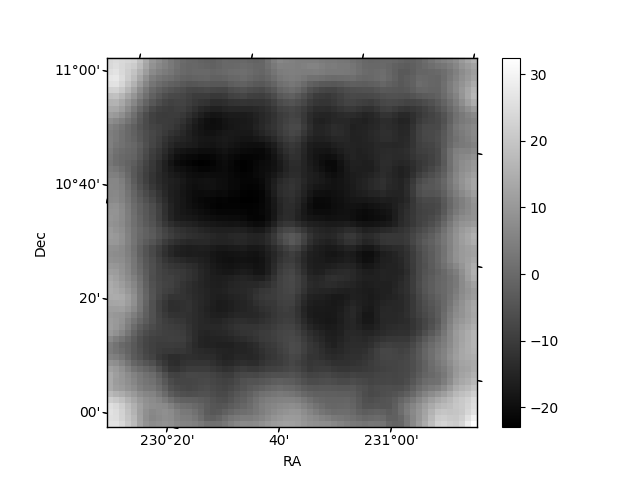
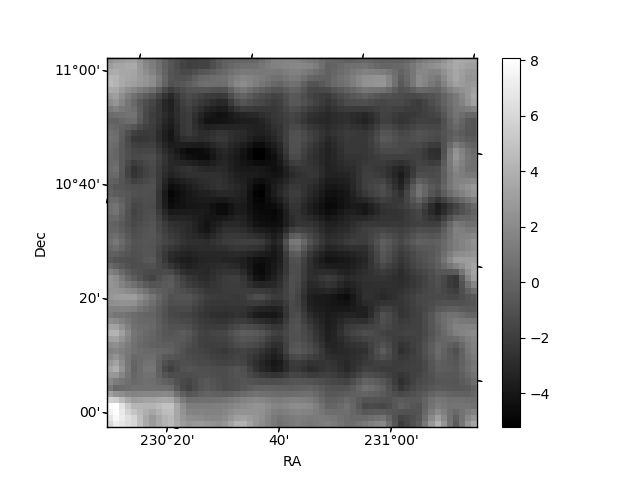
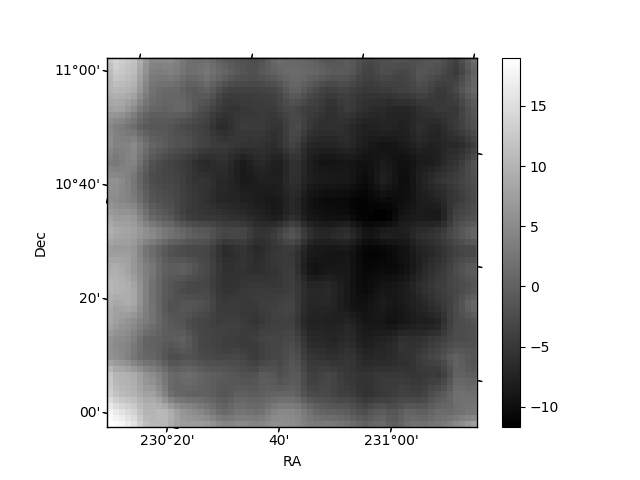
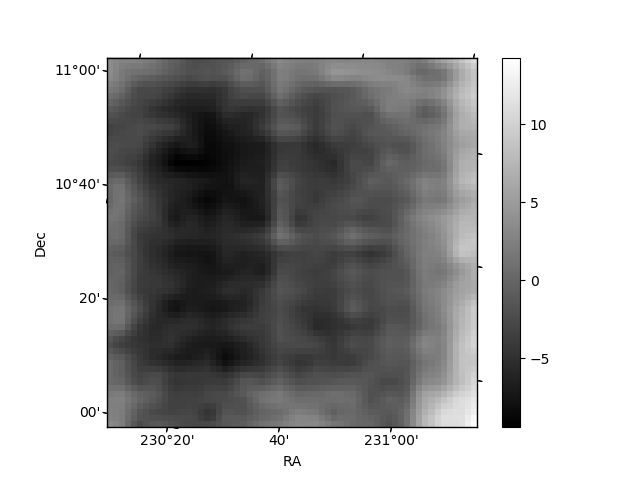
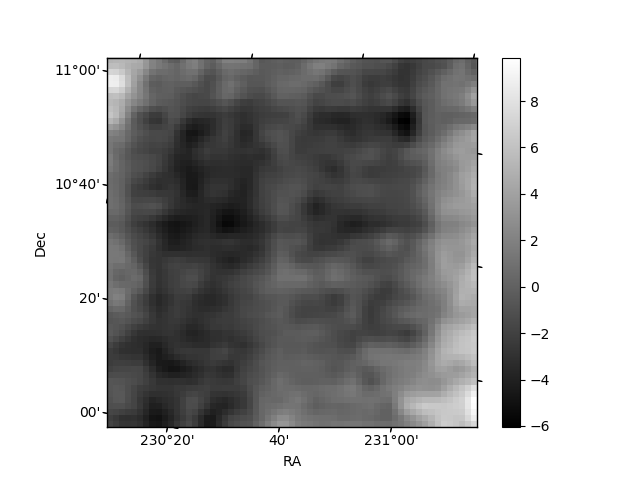
Histogram calculated using DETX and DETY for each event in the final _common_clean file
| Quadrant A | 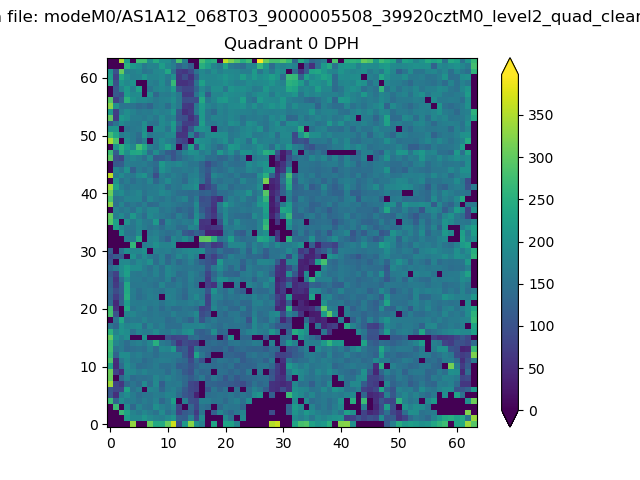 |
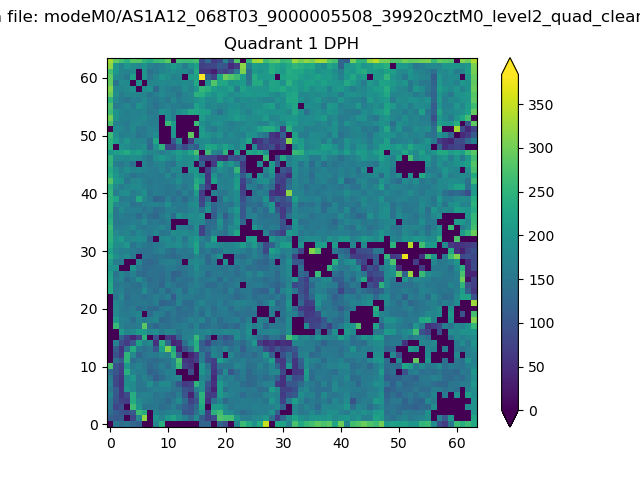 |
Quadrant B |
|---|---|---|---|
| Quadrant D | 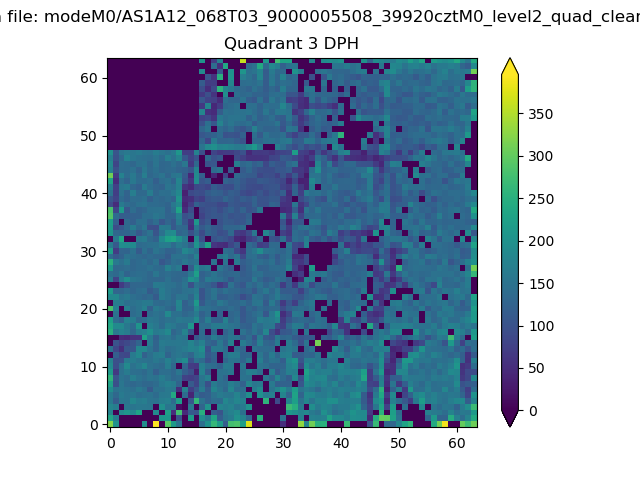 |
 |
Quadrant C |
| Plot type | Count rate plots | Images |
|---|---|---|
| Comparison with Poisson distribution Blue bars denote a histogram of data divided into 1 sec bins. Red curve is a Poisson curve with rate = median count rate of data. |
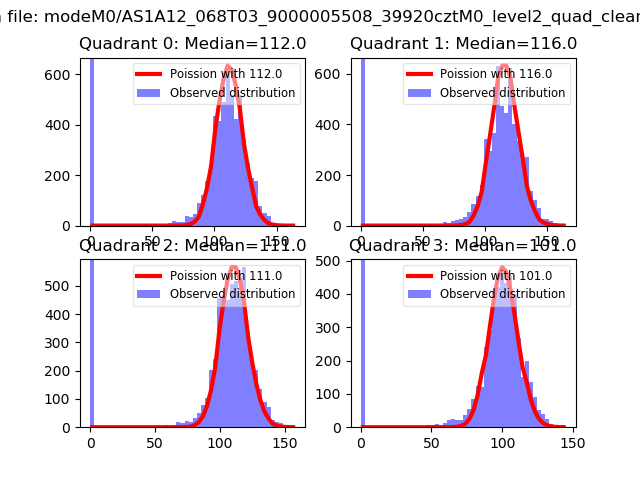 |
 |
| Quadrant-wise count rates Data is divided into 100 sec bins |
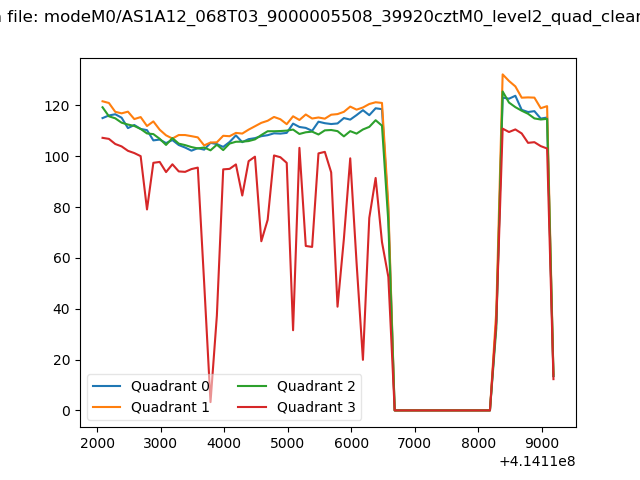 |
|
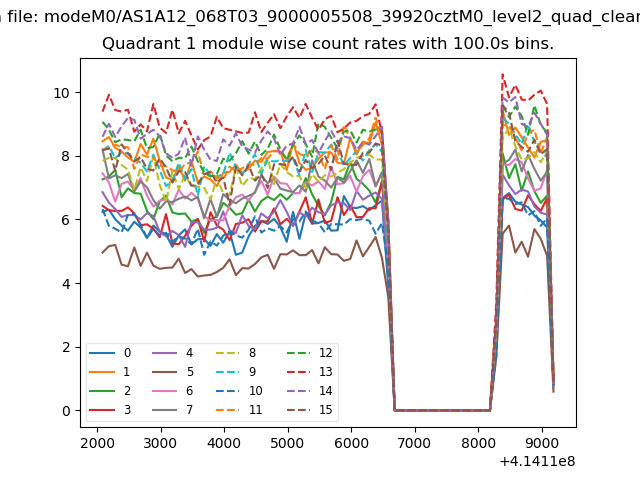
| Module-wise count rates for Quadrant A Data is divided into 100 sec bins |
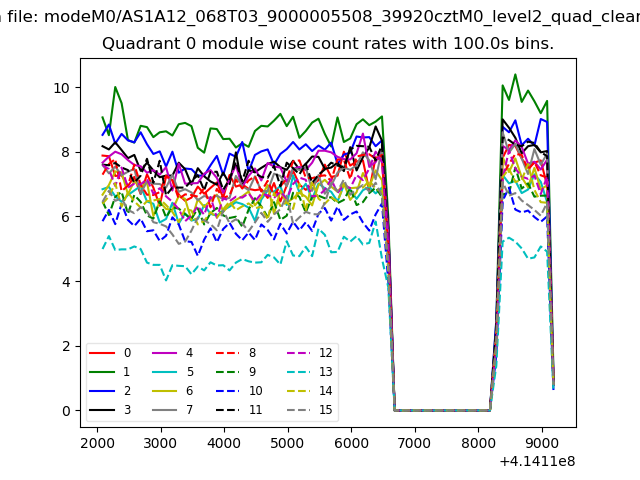 |
 |
| Module-wise count rates for Quadrant B Data is divided into 100 sec bins |
 |
 |
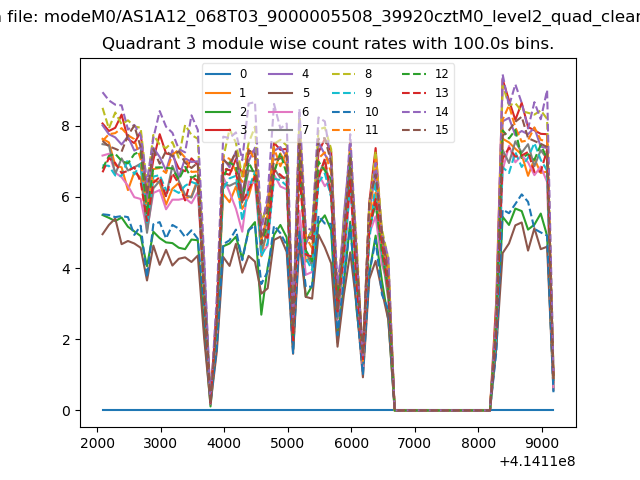
| Module-wise count rates for Quadrant C Data is divided into 100 sec bins |
 |
 |
| Module-wise count rates for Quadrant D Data is divided into 100 sec bins |
 |
 |
| Parameter | Plot |
|---|---|
| CZT HV Monitor | 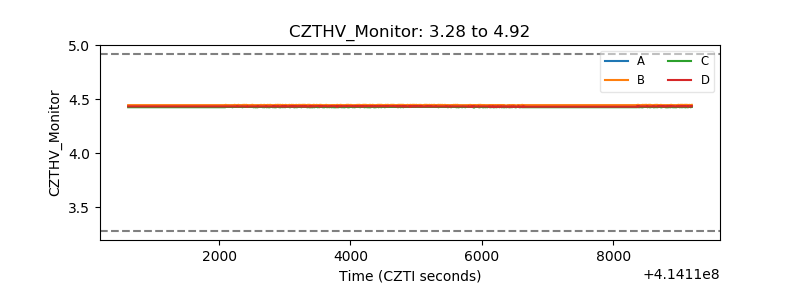 |
| D_VDD | 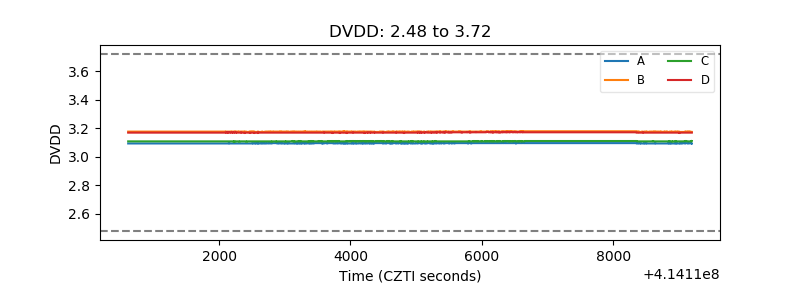 |
| Temperature 1 | 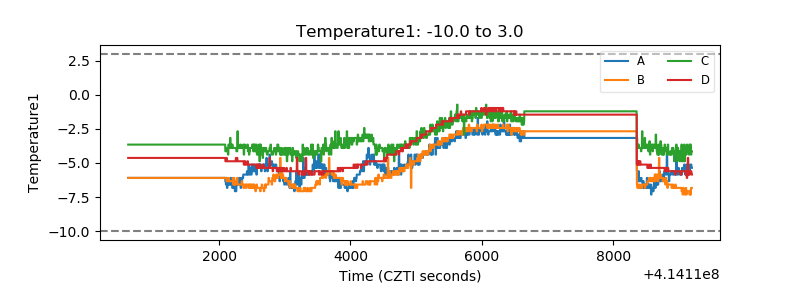 |
| Veto HV Monitor | 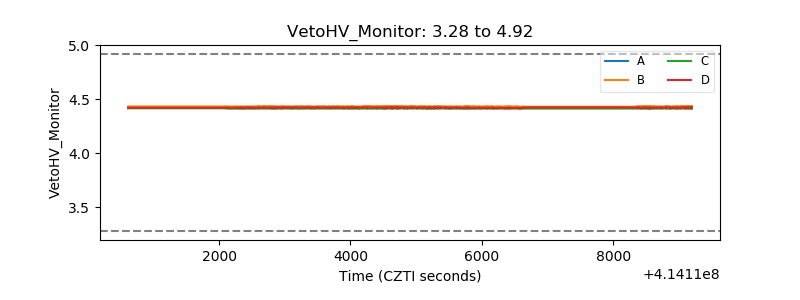 |
| Veto LLD |  |
| Alpha Counter | 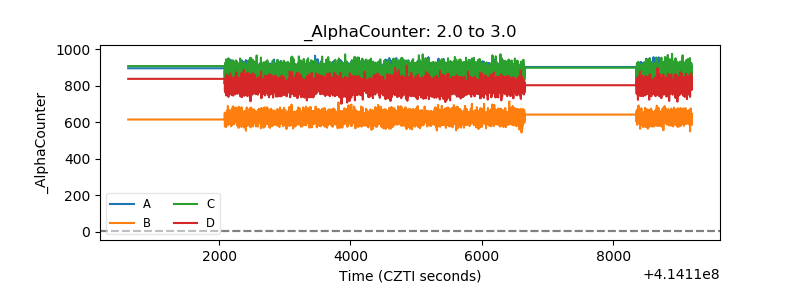 |
| _CPM_Rate | 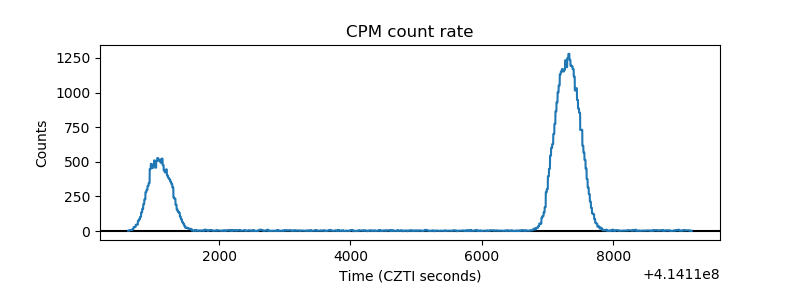 |
| CZT Counter | 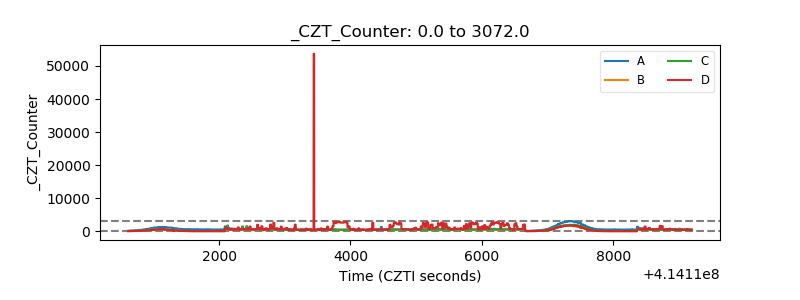 |
| +2.5 Volts monitor | 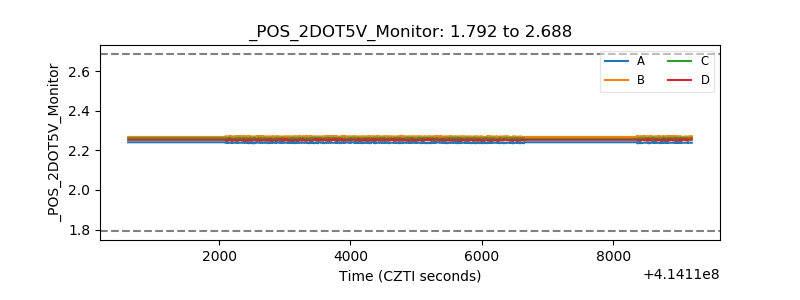 |
| +5 Volts monitor | 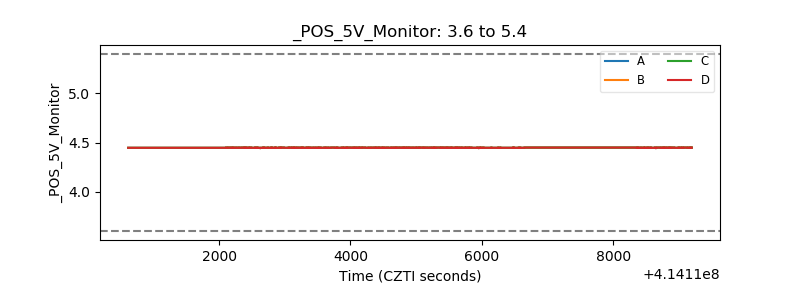 |
| _ROLL_ROT | 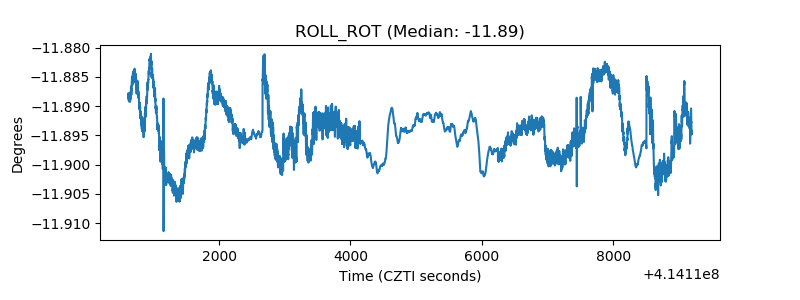 |
| _Roll_DEC | 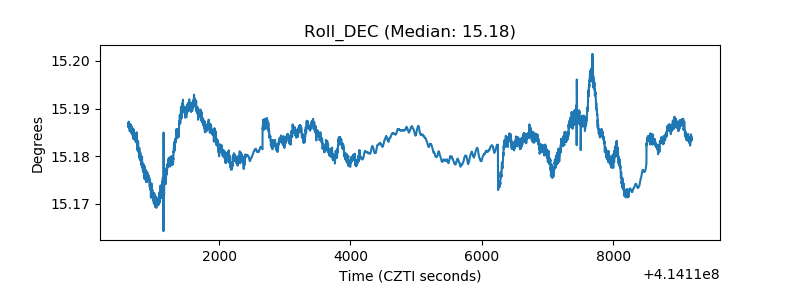 |
| _Roll_RA | 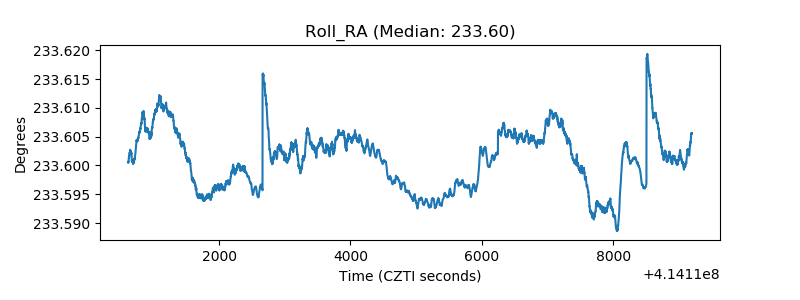 |
| Veto Counter | 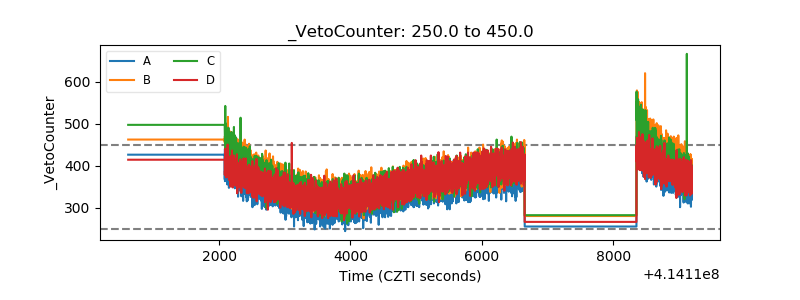 |