| Param | Original file | Final file |
|---|---|---|
| Filename | modeM0/AS1A12_032T02_9000005510_39936cztM0_level2.fits | modeM0/AS1A12_032T02_9000005510_39936cztM0_level2_quad_clean.evt |
| Size (bytes) | 201,441,600 | 54,400,320 |
| Size | 192.1 MB | 51.9 MB |
| Events in quadrant A | 1,717,238 | 370,551 |
| Events in quadrant B | 1,701,527 | 371,762 |
| Events in quadrant C | 2,036,648 | 336,938 |
| Events in quadrant D | 1,735,895 | 327,166 |
| Mode M9 | |||
|---|---|---|---|
| Quadrant | BADHDUFLAG | Total packets | Discarded packets |
| A | 0 | 16 | 0 |
| B | 0 | 16 | 0 |
| C | 0 | 16 | 0 |
| D | 0 | 16 | 0 |
| Mode SS | |||
|---|---|---|---|
| Quadrant | BADHDUFLAG | Total packets | Discarded packets |
| A | 0 | 81 | 5 |
| B | 0 | 85 | 5 |
| C | 0 | 85 | 9 |
| D | 0 | 83 | 8 |
| Mode M0 | |||
|---|---|---|---|
| Quadrant | BADHDUFLAG | Total packets | Discarded packets |
| A | 0 | 8670 | 1377 |
| B | 0 | 9060 | 1601 |
| C | 0 | 9969 | 1899 |
| D | 0 | 9235 | 1583 |
| Quadrant | Total seconds | Saturated seconds | Saturation percentage |
|---|---|---|---|
| A | 3409 | 3 | 0.088002% |
| B | 3377 | 68 | 2.013622% |
| C | 3343 | 210 | 6.281783% |
| D | 3356 | 30 | 0.893921% |
Noise dominated data is calculated using 1-second bins in cleaned event files. If a bin has >2000 counts, and if more than 50% of those come from <1% of pixels, then it is considered to be noise-dominated and hence unusable.
| Quadrant | # 1 sec bins | Bins with >0 counts | Bins with >2000 counts | High rate bins dominated by noise | Noise dominated (total time) | Noise dominated (detector-on time) | Marked lightcurve |
|---|---|---|---|---|---|---|---|
| A | 5815 | 3697 | 0 | 0 | 0.00% | 0.00% | 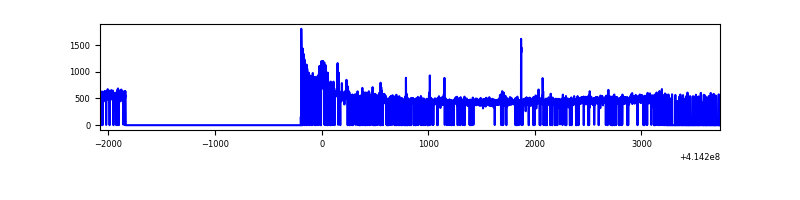 |
| B | 5816 | 3645 | 50 | 50 | 0.86% | 1.37% | 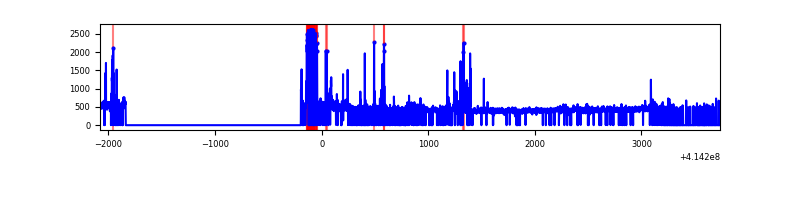 |
| C | 5814 | 3591 | 180 | 180 | 3.10% | 5.01% | 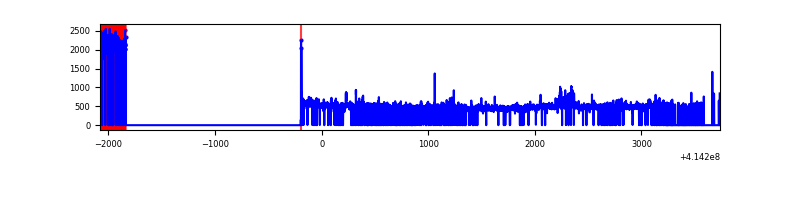 |
| D | 5815 | 3627 | 31 | 31 | 0.53% | 0.85% | 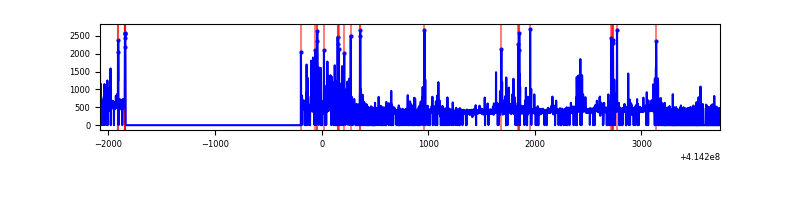 |
Top three noisy pixels from each quadrant. If the there are fewer than three noisy pixels in the level2.evt file, extra rows are filled as -1
| Pixel properties | Quadrant properties | ||||||
|---|---|---|---|---|---|---|---|
| Quadrant | DetID | PixID | Counts | Sigma | Mean | Median | Sigma |
| A | 10 | 83 | 244978 | 3213.82 | 367 | 361 | 76.1 |
| A | 13 | 248 | 23967 | 310.14 | 367 | 361 | 76.1 |
| A | 7 | 192 | 12432 | 158.59 | 367 | 361 | 76.1 |
| B | 4 | 170 | 127283 | 1771.27 | 361 | 350 | 71.7 |
| B | 5 | 255 | 68427 | 949.97 | 361 | 350 | 71.7 |
| B | 0 | 230 | 32569 | 449.6 | 361 | 350 | 71.7 |
| C | 9 | 54 | 543893 | 6580.93 | 346 | 348 | 82.6 |
| C | 15 | 214 | 131995 | 1593.9 | 346 | 348 | 82.6 |
| C | 0 | 10 | 6911 | 79.46 | 346 | 348 | 82.6 |
| D | 12 | 227 | 117180 | 1330.33 | 355 | 345 | 87.8 |
| D | 2 | 249 | 86405 | 979.92 | 355 | 345 | 87.8 |
| D | 1 | 47 | 56059 | 634.38 | 355 | 345 | 87.8 |
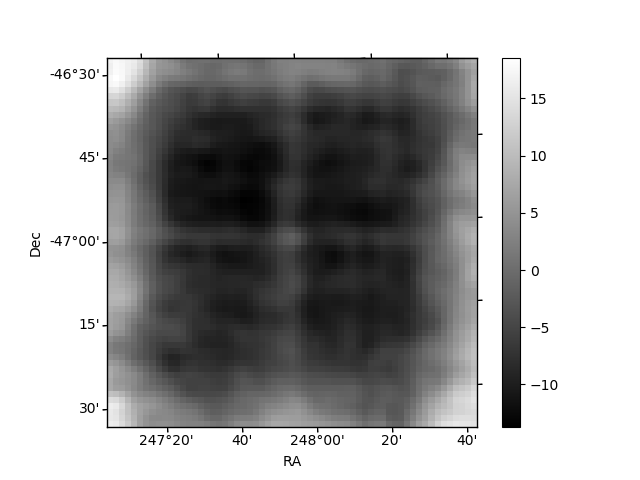
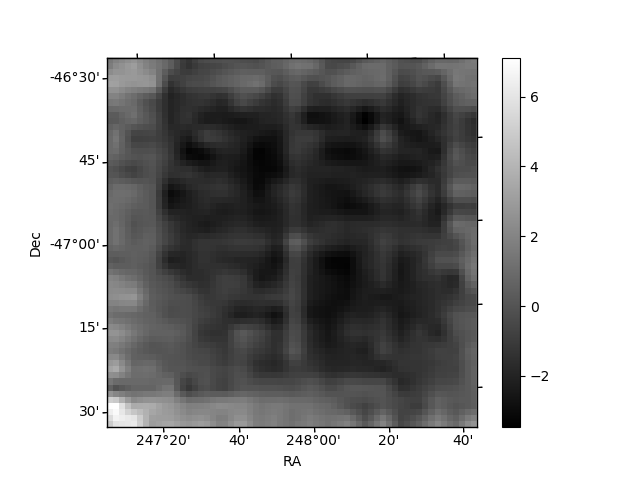
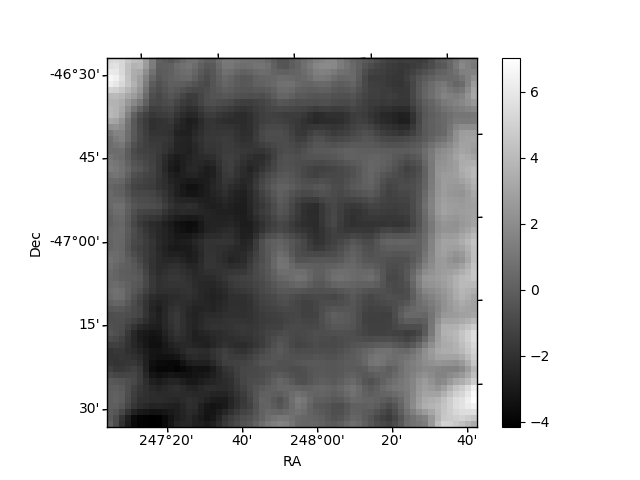
Histogram calculated using DETX and DETY for each event in the final _common_clean file
| Quadrant A | 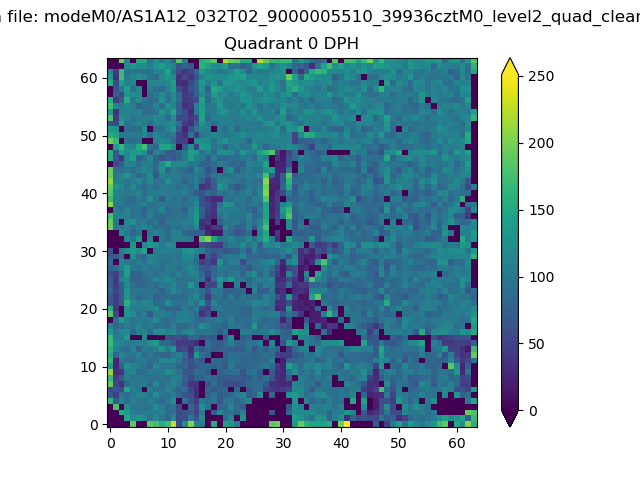 |
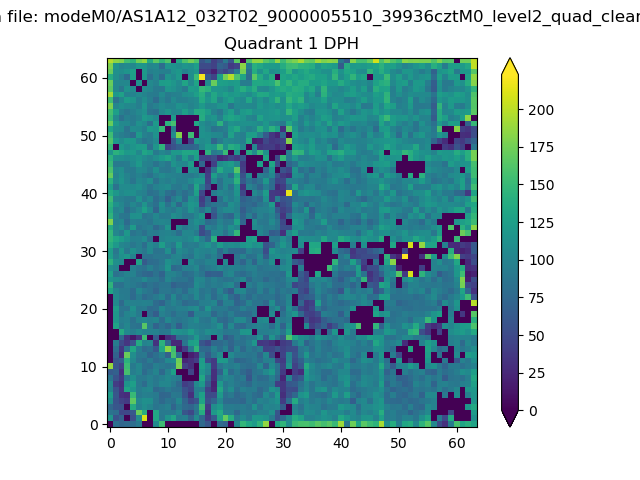 |
Quadrant B |
|---|---|---|---|
| Quadrant D | 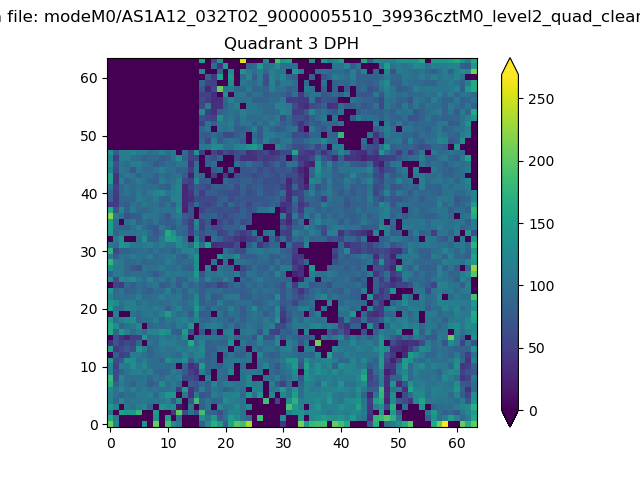 |
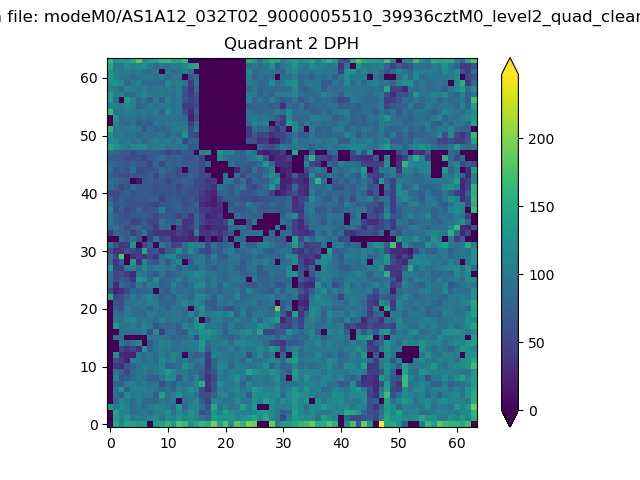 |
Quadrant C |
| Plot type | Count rate plots | Images |
|---|---|---|
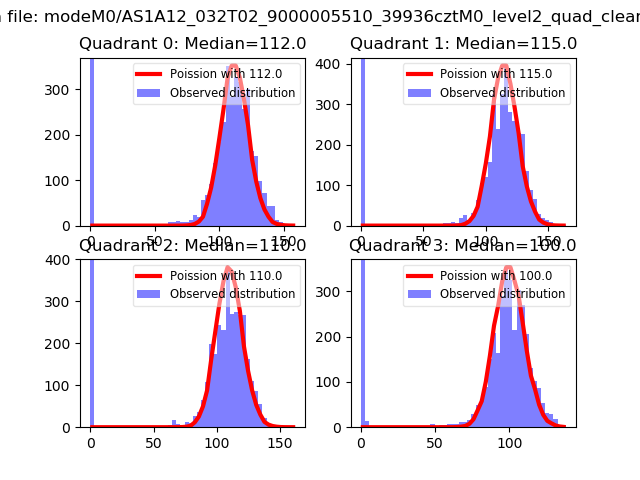
| Comparison with Poisson distribution Blue bars denote a histogram of data divided into 1 sec bins. Red curve is a Poisson curve with rate = median count rate of data. |
 |
 |
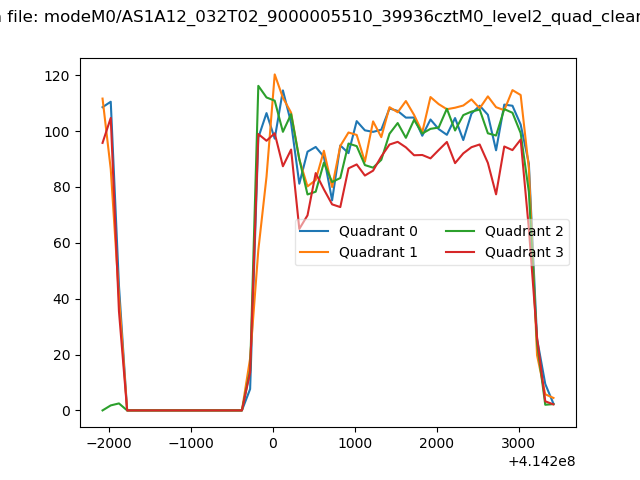
| Quadrant-wise count rates Data is divided into 100 sec bins |
 |
|
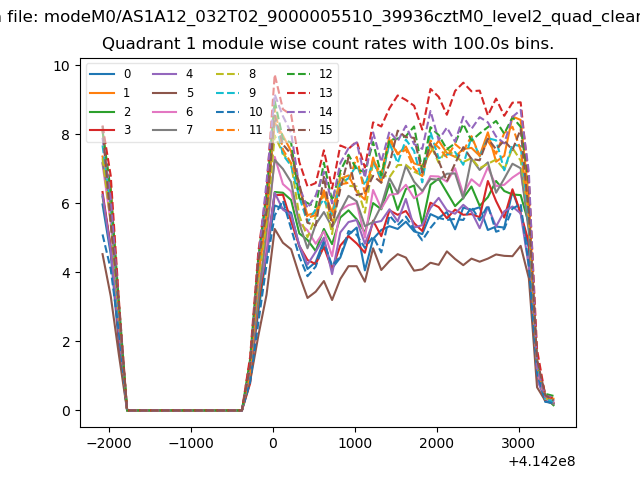
| Module-wise count rates for Quadrant A Data is divided into 100 sec bins |
 |
 |
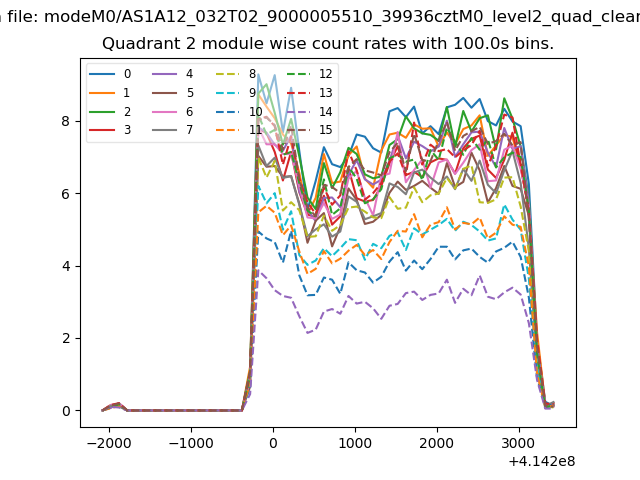
| Module-wise count rates for Quadrant B Data is divided into 100 sec bins |
 |
 |
| Module-wise count rates for Quadrant C Data is divided into 100 sec bins |
 |
 |
| Module-wise count rates for Quadrant D Data is divided into 100 sec bins |
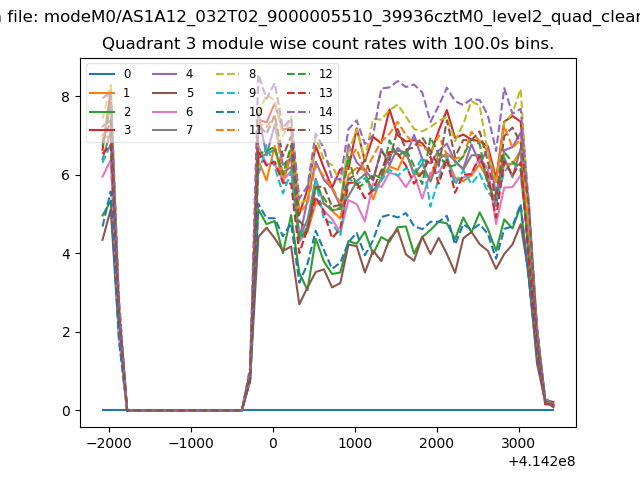 |
 |
| Parameter | Plot |
|---|---|
| CZT HV Monitor | 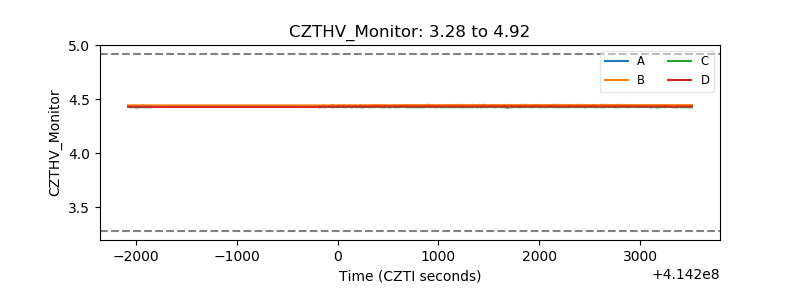 |
| D_VDD | 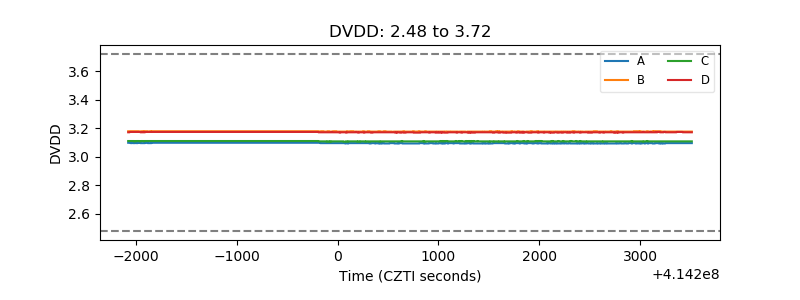 |
| Temperature 1 |  |
| Veto HV Monitor | 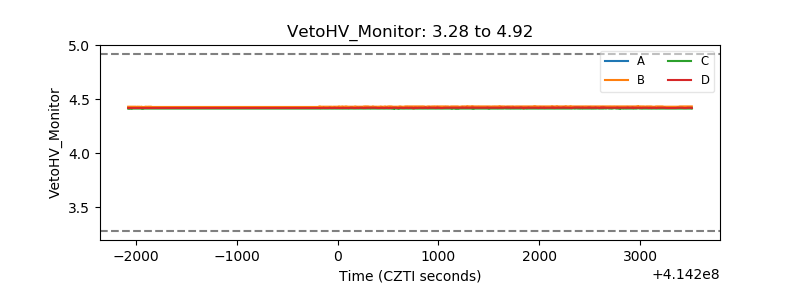 |
| Veto LLD |  |
| Alpha Counter | 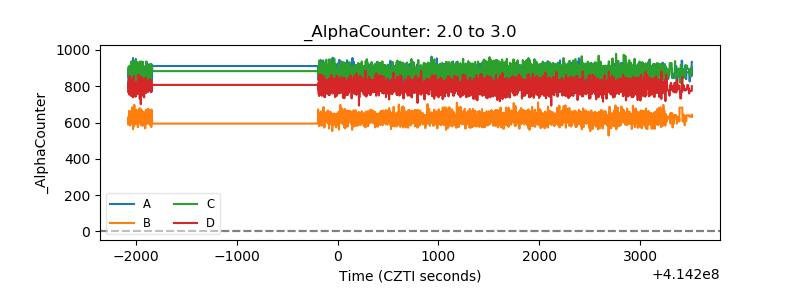 |
| _CPM_Rate | 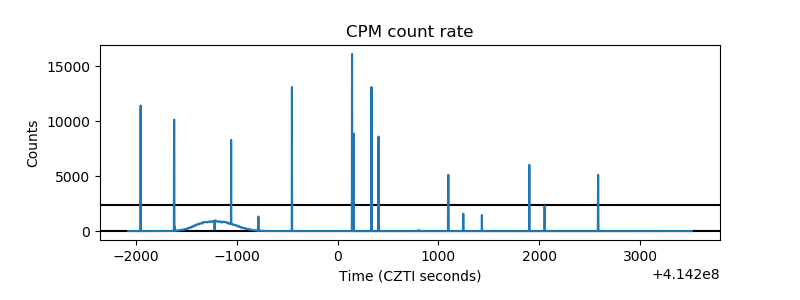 |
| CZT Counter | 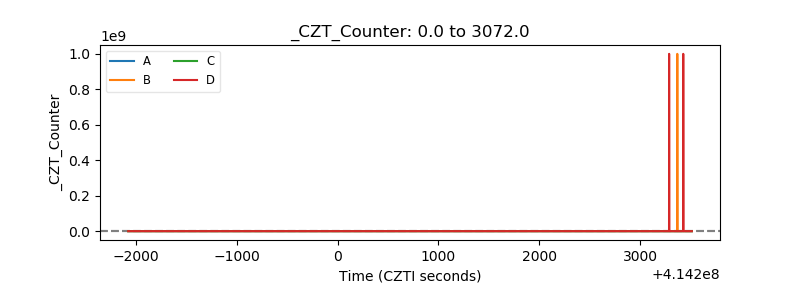 |
| +2.5 Volts monitor | 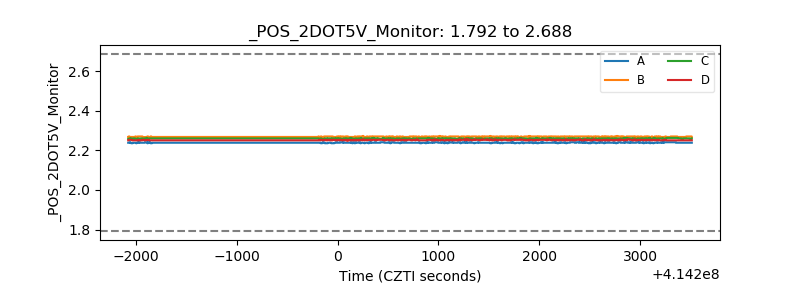 |
| +5 Volts monitor | 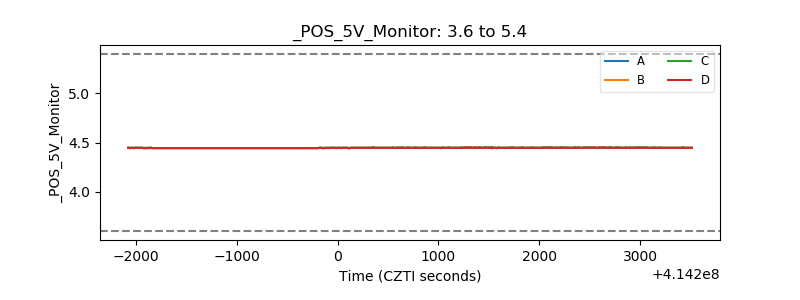 |
| _ROLL_ROT | 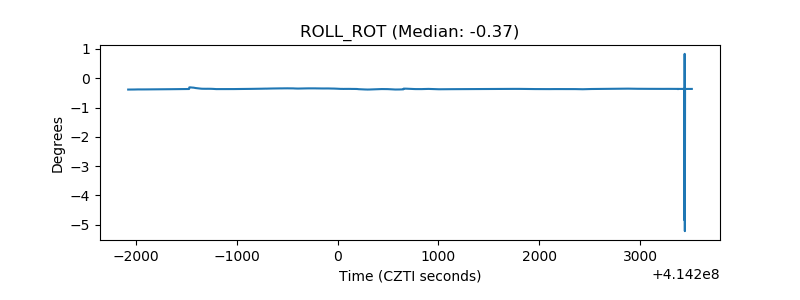 |
| _Roll_DEC | 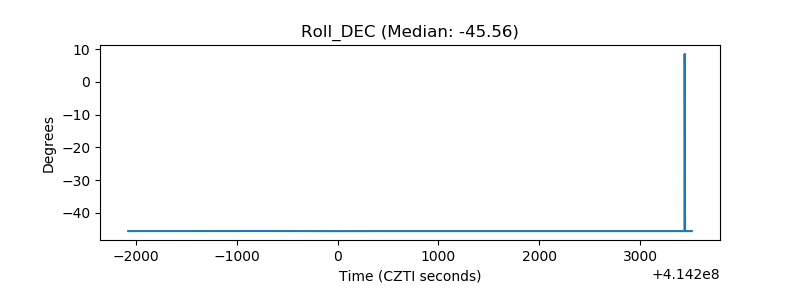 |
| _Roll_RA | 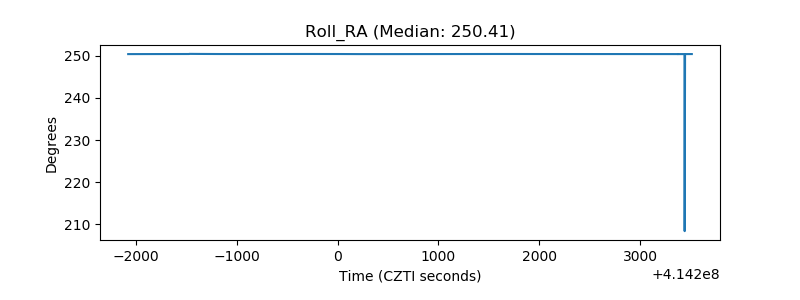 |
| Veto Counter | 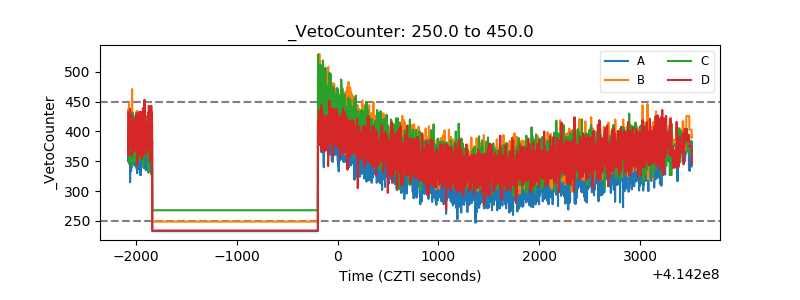 |