| Param | Original file | Final file |
|---|---|---|
| Filename | modeM0/AS1A12_032T02_9000005510_39937cztM0_level2.fits | modeM0/AS1A12_032T02_9000005510_39937cztM0_level2_quad_clean.evt |
| Size (bytes) | 228,427,200 | 65,756,160 |
| Size | 217.8 MB | 62.7 MB |
| Events in quadrant A | 1,998,033 | 440,069 |
| Events in quadrant B | 2,016,732 | 446,279 |
| Events in quadrant C | 2,097,409 | 433,399 |
| Events in quadrant D | 2,035,926 | 393,576 |
| Mode M9 | |||
|---|---|---|---|
| Quadrant | BADHDUFLAG | Total packets | Discarded packets |
| A | 0 | 3 | 0 |
| B | 0 | 3 | 0 |
| C | 0 | 3 | 0 |
| D | 0 | 4 | 0 |
| Mode SS | |||
|---|---|---|---|
| Quadrant | BADHDUFLAG | Total packets | Discarded packets |
| A | 0 | 80 | 0 |
| B | 0 | 80 | 0 |
| C | 0 | 80 | 0 |
| D | 0 | 80 | 0 |
| Mode M0 | |||
|---|---|---|---|
| Quadrant | BADHDUFLAG | Total packets | Discarded packets |
| A | 0 | 8451 | 1 |
| B | 0 | 8776 | 1 |
| C | 0 | 8637 | 1 |
| D | 0 | 8958 | 1 |
| Quadrant | Total seconds | Saturated seconds | Saturation percentage |
|---|---|---|---|
| A | 3933 | 5 | 0.127129% |
| B | 3933 | 94 | 2.390033% |
| C | 3933 | 10 | 0.254259% |
| D | 3933 | 39 | 0.991609% |
Noise dominated data is calculated using 1-second bins in cleaned event files. If a bin has >2000 counts, and if more than 50% of those come from <1% of pixels, then it is considered to be noise-dominated and hence unusable.
| Quadrant | # 1 sec bins | Bins with >0 counts | Bins with >2000 counts | High rate bins dominated by noise | Noise dominated (total time) | Noise dominated (detector-on time) | Marked lightcurve |
|---|---|---|---|---|---|---|---|
| A | 3933 | 3933 | 3 | 3 | 0.08% | 0.08% | 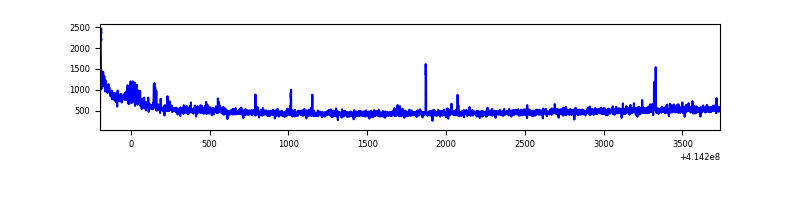 |
| B | 3933 | 3933 | 73 | 73 | 1.86% | 1.86% | 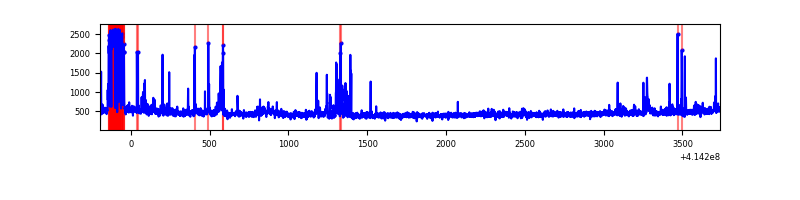 |
| C | 3933 | 3933 | 6 | 6 | 0.15% | 0.15% | 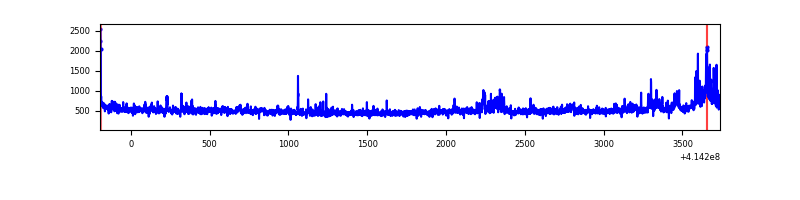 |
| D | 3933 | 3933 | 38 | 38 | 0.97% | 0.97% | 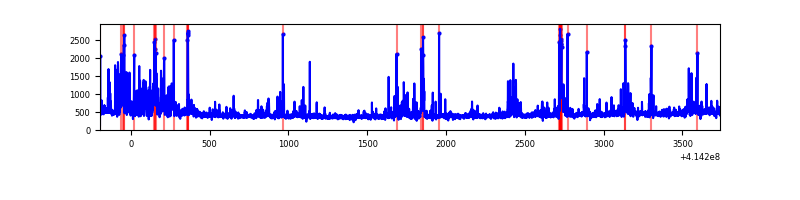 |
Top three noisy pixels from each quadrant. If the there are fewer than three noisy pixels in the level2.evt file, extra rows are filled as -1
| Pixel properties | Quadrant properties | ||||||
|---|---|---|---|---|---|---|---|
| Quadrant | DetID | PixID | Counts | Sigma | Mean | Median | Sigma |
| A | 10 | 83 | 288236 | 3276.28 | 424 | 416 | 87.8 |
| A | 13 | 248 | 29002 | 325.4 | 424 | 416 | 87.8 |
| A | 7 | 192 | 14477 | 160.06 | 424 | 416 | 87.8 |
| B | 4 | 170 | 163110 | 1977.81 | 420 | 408 | 82.3 |
| B | 5 | 255 | 90440 | 1094.43 | 420 | 408 | 82.3 |
| B | 0 | 183 | 51584 | 622.1 | 420 | 408 | 82.3 |
| C | 9 | 54 | 277722 | 2775.55 | 421 | 424 | 99.9 |
| C | 15 | 214 | 158854 | 1585.77 | 421 | 424 | 99.9 |
| C | 0 | 10 | 11015 | 106.01 | 421 | 424 | 99.9 |
| D | 2 | 249 | 120363 | 1162.55 | 416 | 404 | 103.2 |
| D | 12 | 227 | 91925 | 886.95 | 416 | 404 | 103.2 |
| D | 1 | 47 | 63762 | 614.02 | 416 | 404 | 103.2 |
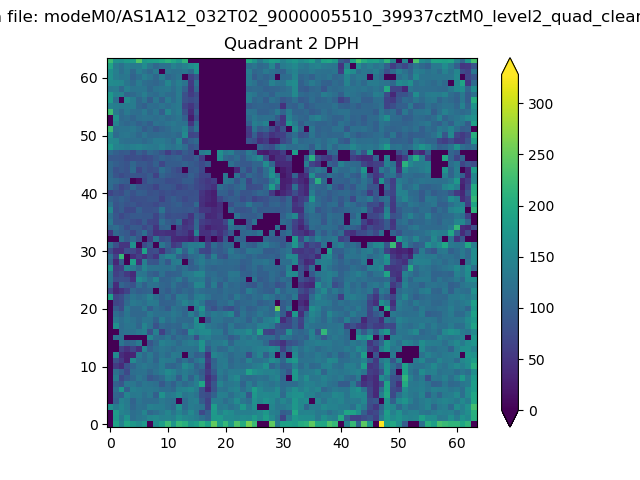
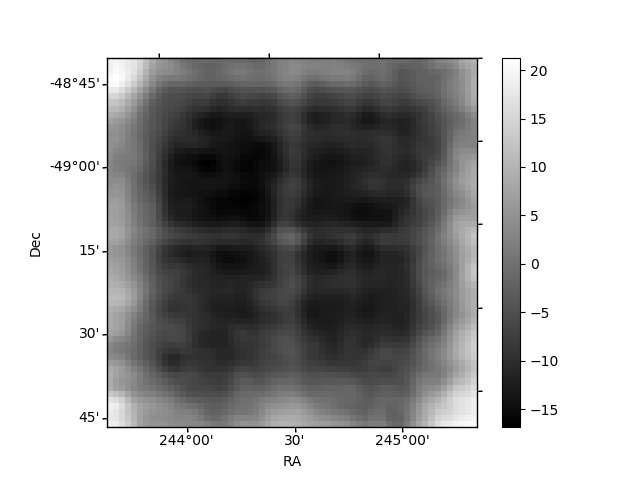
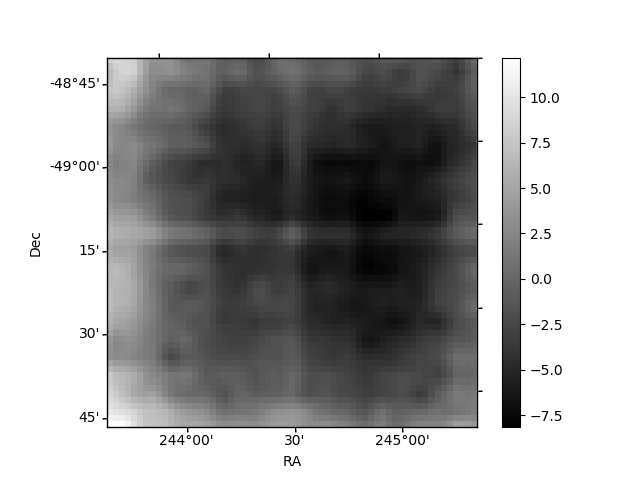
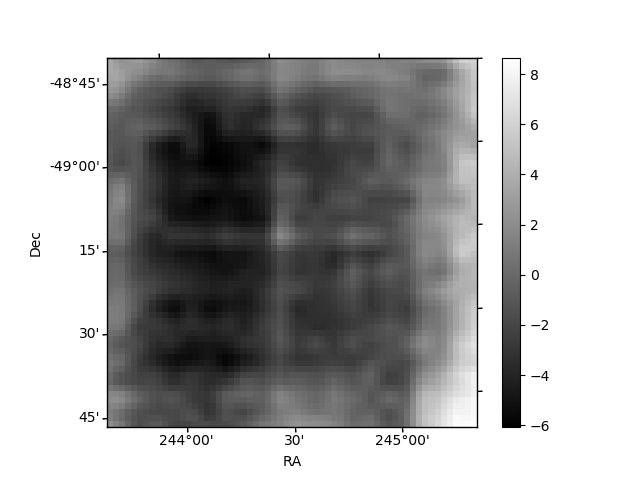
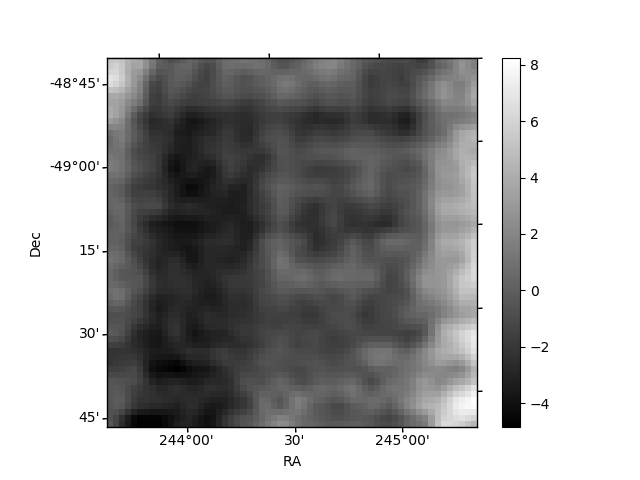
Histogram calculated using DETX and DETY for each event in the final _common_clean file
| Quadrant A | 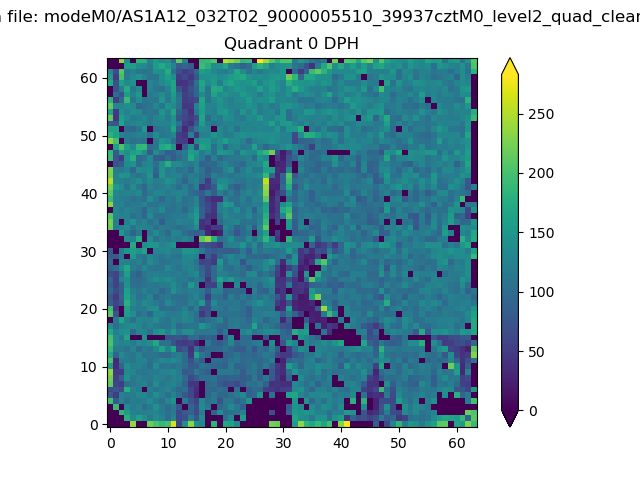 |
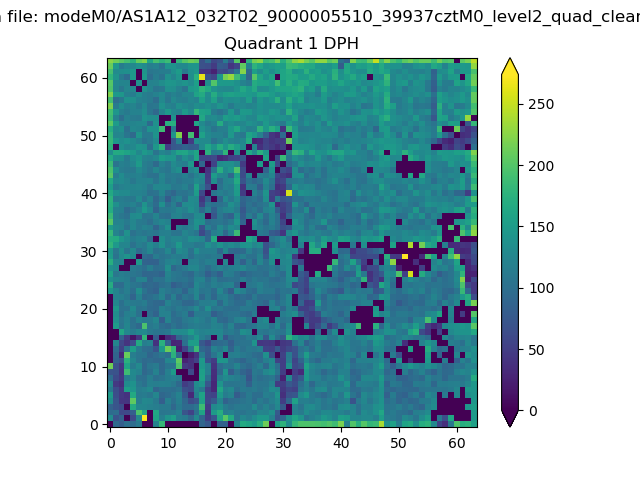 |
Quadrant B |
|---|---|---|---|
| Quadrant D | 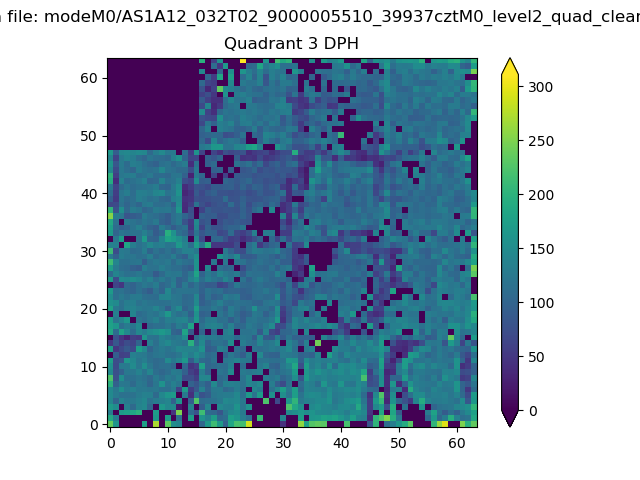 |
 |
Quadrant C |
| Plot type | Count rate plots | Images |
|---|---|---|
| Comparison with Poisson distribution Blue bars denote a histogram of data divided into 1 sec bins. Red curve is a Poisson curve with rate = median count rate of data. |
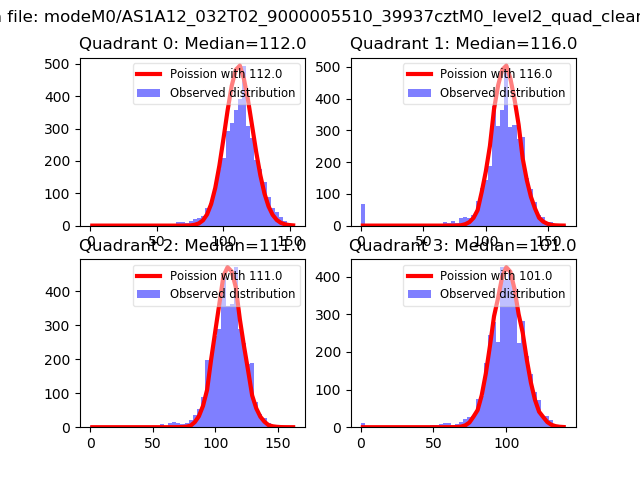 |
 |
| Quadrant-wise count rates Data is divided into 100 sec bins |
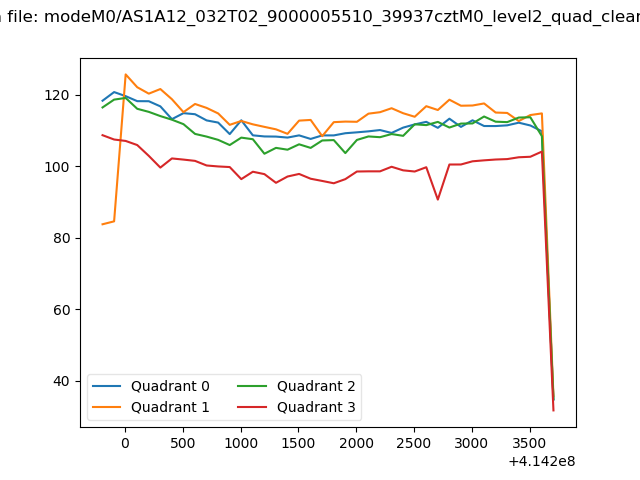 |
|
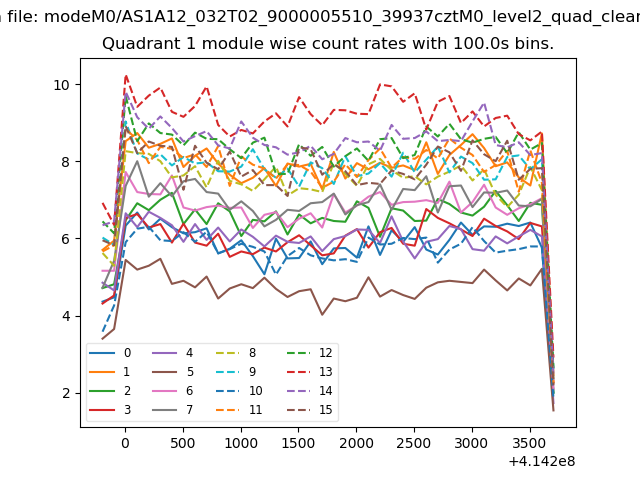
| Module-wise count rates for Quadrant A Data is divided into 100 sec bins |
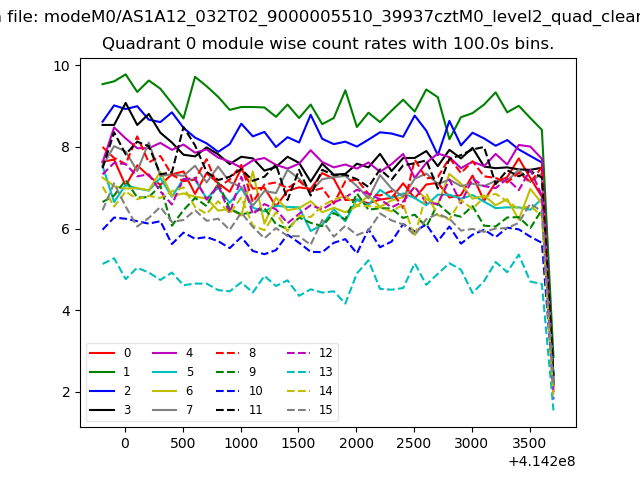 |
 |
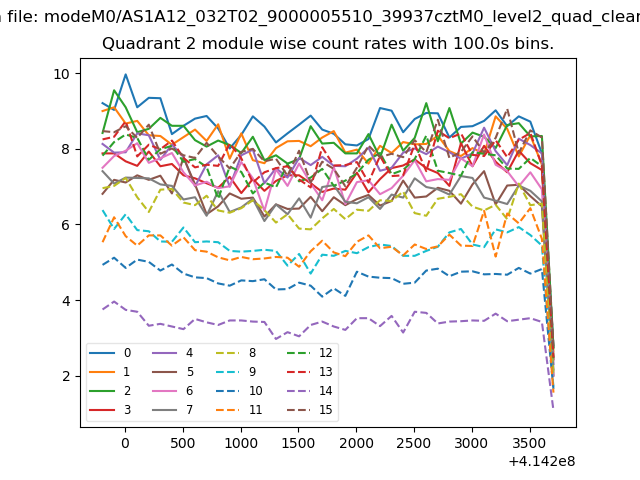
| Module-wise count rates for Quadrant B Data is divided into 100 sec bins |
 |
 |
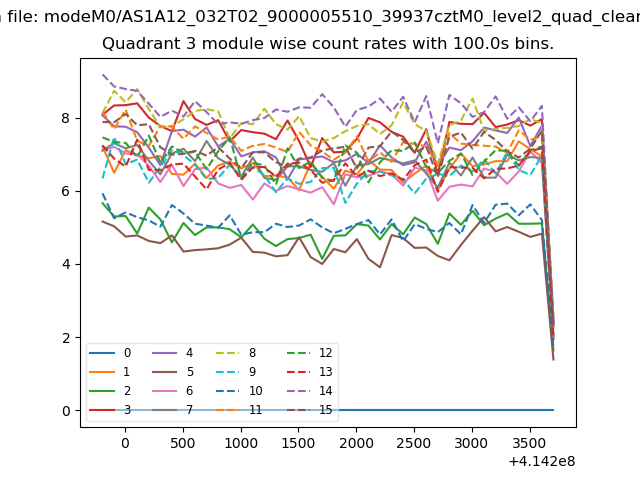
| Module-wise count rates for Quadrant C Data is divided into 100 sec bins |
 |
 |
| Module-wise count rates for Quadrant D Data is divided into 100 sec bins |
 |
 |
| Parameter | Plot |
|---|---|
| CZT HV Monitor | 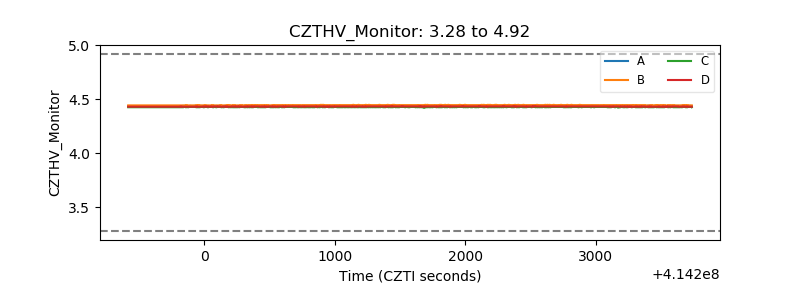 |
| D_VDD | 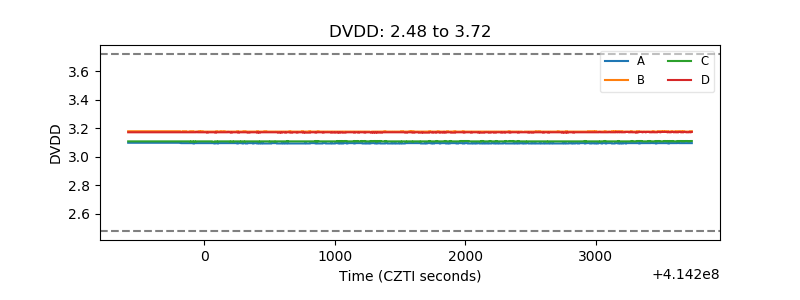 |
| Temperature 1 | 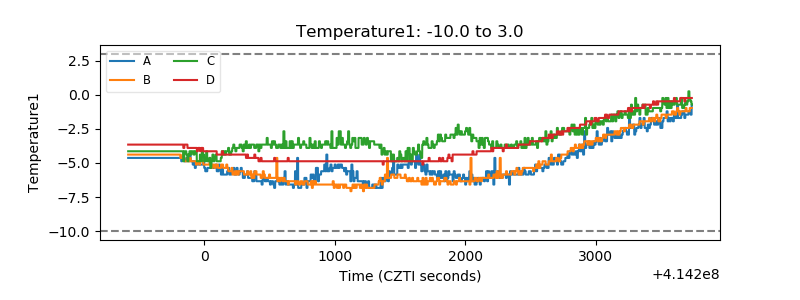 |
| Veto HV Monitor | 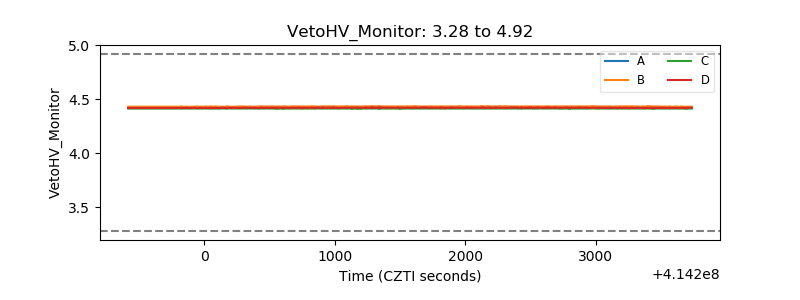 |
| Veto LLD | 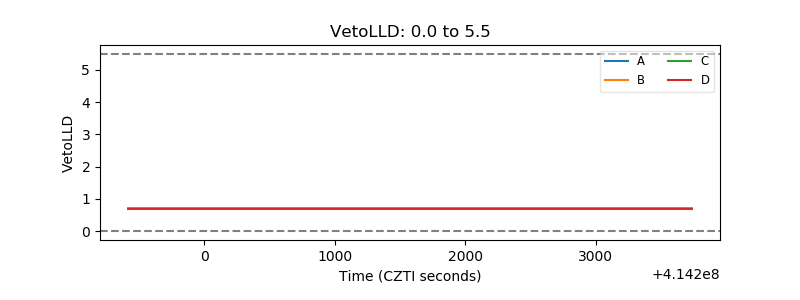 |
| Alpha Counter | 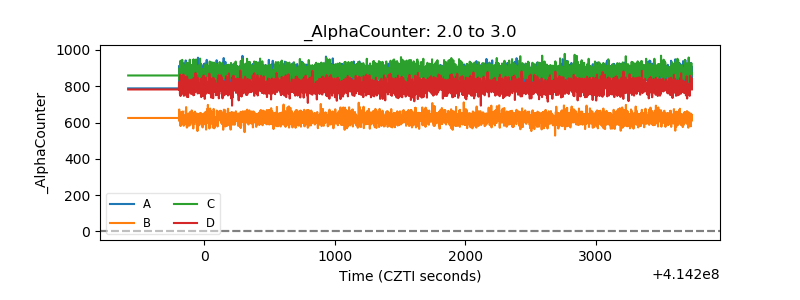 |
| _CPM_Rate | 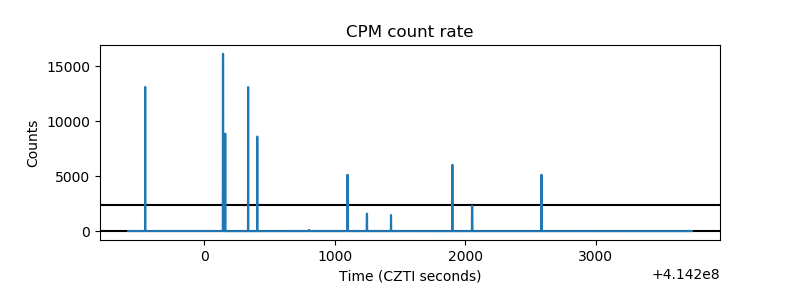 |
| CZT Counter | 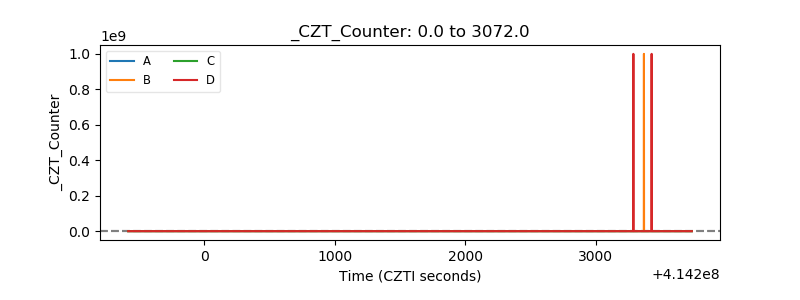 |
| +2.5 Volts monitor | 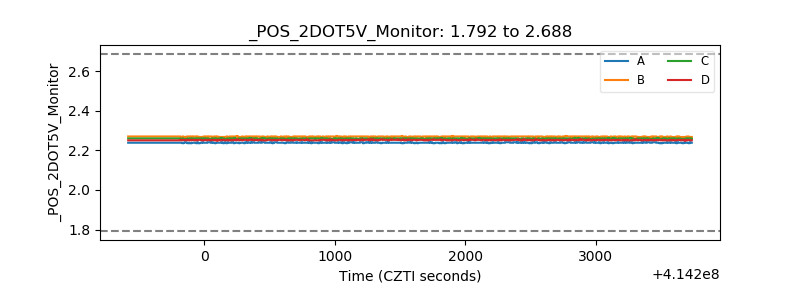 |
| +5 Volts monitor | 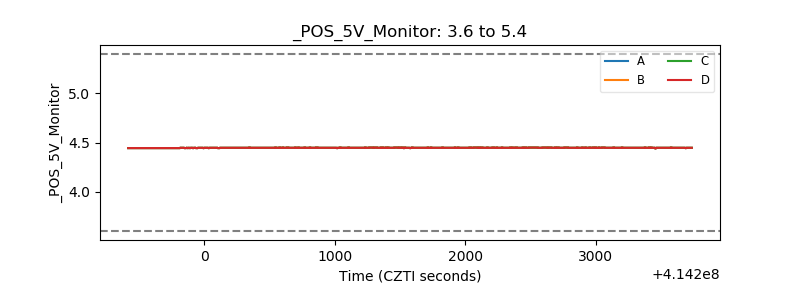 |
| _ROLL_ROT |  |
| _Roll_DEC |  |
| _Roll_RA | 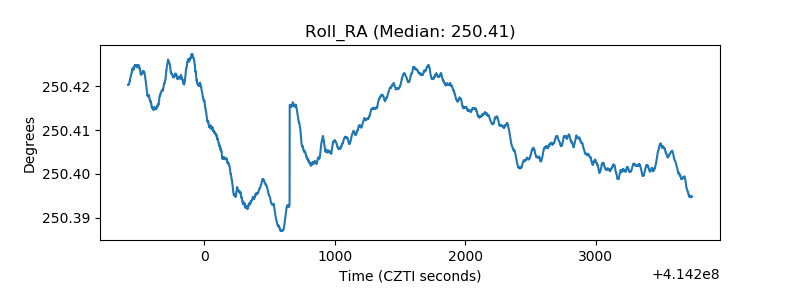 |
| Veto Counter | 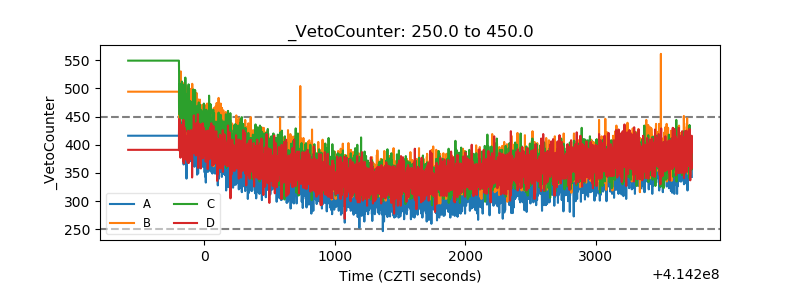 |