| Param | Original file | Final file |
|---|---|---|
| Filename | modeM0/AS1A12_044T21_9000005512_39937cztM0_level2.fits | modeM0/AS1A12_044T21_9000005512_39937cztM0_level2_quad_clean.evt |
| Size (bytes) | 440,098,560 | 94,815,360 |
| Size | 419.7 MB | 90.4 MB |
| Events in quadrant A | 3,112,487 | 651,388 |
| Events in quadrant B | 3,673,049 | 656,421 |
| Events in quadrant C | 5,013,530 | 616,247 |
| Events in quadrant D | 4,058,682 | 556,337 |
| Mode M9 | |||
|---|---|---|---|
| Quadrant | BADHDUFLAG | Total packets | Discarded packets |
| A | 0 | 32 | 0 |
| B | 0 | 32 | 0 |
| C | 0 | 32 | 0 |
| D | 0 | 32 | 0 |
| Mode SS | |||
|---|---|---|---|
| Quadrant | BADHDUFLAG | Total packets | Discarded packets |
| A | 0 | 114 | 0 |
| B | 0 | 114 | 0 |
| C | 0 | 114 | 0 |
| D | 0 | 114 | 0 |
| Mode M0 | |||
|---|---|---|---|
| Quadrant | BADHDUFLAG | Total packets | Discarded packets |
| A | 0 | 12623 | 3 |
| B | 0 | 14571 | 2 |
| C | 0 | 18803 | 2 |
| D | 0 | 15948 | 2 |
| Quadrant | Total seconds | Saturated seconds | Saturation percentage |
|---|---|---|---|
| A | 5581 | 19 | 0.340441% |
| B | 5581 | 246 | 4.407812% |
| C | 5581 | 227 | 4.067371% |
| D | 5581 | 348 | 6.235442% |
Noise dominated data is calculated using 1-second bins in cleaned event files. If a bin has >2000 counts, and if more than 50% of those come from <1% of pixels, then it is considered to be noise-dominated and hence unusable.
| Quadrant | # 1 sec bins | Bins with >0 counts | Bins with >2000 counts | High rate bins dominated by noise | Noise dominated (total time) | Noise dominated (detector-on time) | Marked lightcurve |
|---|---|---|---|---|---|---|---|
| A | 7494 | 5582 | 10 | 10 | 0.13% | 0.18% | 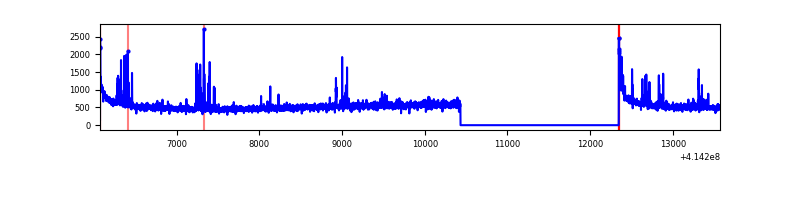 |
| B | 7494 | 5581 | 201 | 201 | 2.68% | 3.60% | 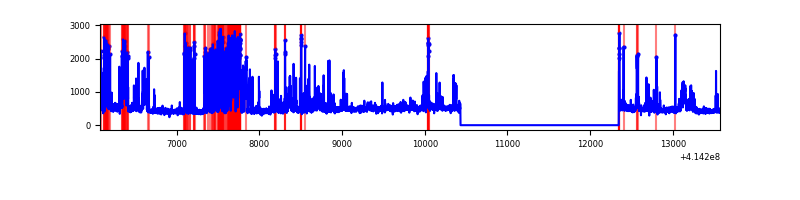 |
| C | 7494 | 5582 | 225 | 225 | 3.00% | 4.03% | 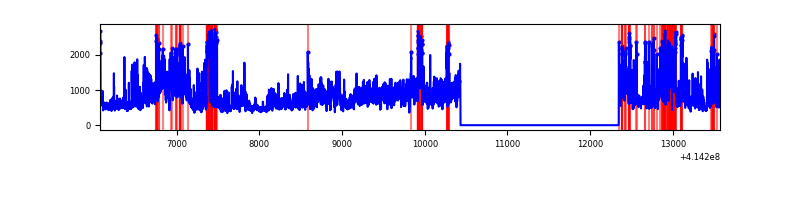 |
| D | 7494 | 5582 | 382 | 382 | 5.10% | 6.84% | 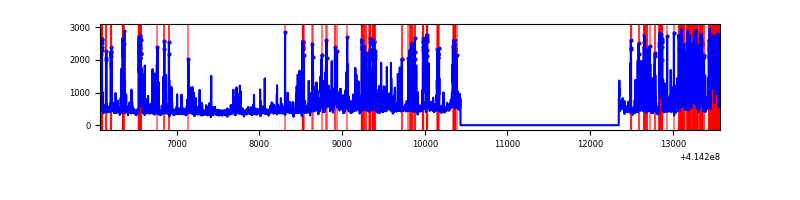 |
Top three noisy pixels from each quadrant. If the there are fewer than three noisy pixels in the level2.evt file, extra rows are filled as -1
| Pixel properties | Quadrant properties | ||||||
|---|---|---|---|---|---|---|---|
| Quadrant | DetID | PixID | Counts | Sigma | Mean | Median | Sigma |
| A | 10 | 83 | 484384 | 3764.52 | 629 | 618 | 128.5 |
| A | 13 | 248 | 96491 | 746.05 | 629 | 618 | 128.5 |
| A | 7 | 3 | 50564 | 388.66 | 629 | 618 | 128.5 |
| B | 5 | 255 | 762622 | 6524.75 | 615 | 600 | 116.8 |
| B | 0 | 183 | 254569 | 2174.59 | 615 | 600 | 116.8 |
| B | 4 | 170 | 178817 | 1525.97 | 615 | 600 | 116.8 |
| C | 9 | 54 | 2407615 | 17125.14 | 598 | 602 | 140.6 |
| C | 15 | 214 | 229060 | 1625.41 | 598 | 602 | 140.6 |
| C | 14 | 254 | 29008 | 202.1 | 598 | 602 | 140.6 |
| D | 12 | 227 | 604809 | 4145.32 | 594 | 577 | 145.8 |
| D | 2 | 250 | 344894 | 2362.18 | 594 | 577 | 145.8 |
| D | 2 | 249 | 325143 | 2226.68 | 594 | 577 | 145.8 |
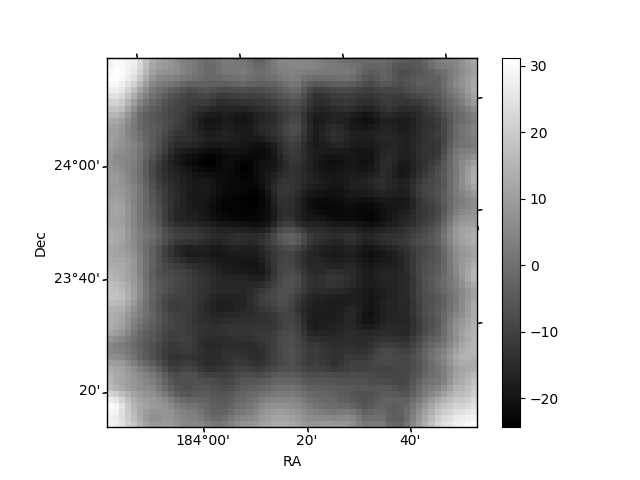
Histogram calculated using DETX and DETY for each event in the final _common_clean file
| Quadrant A | 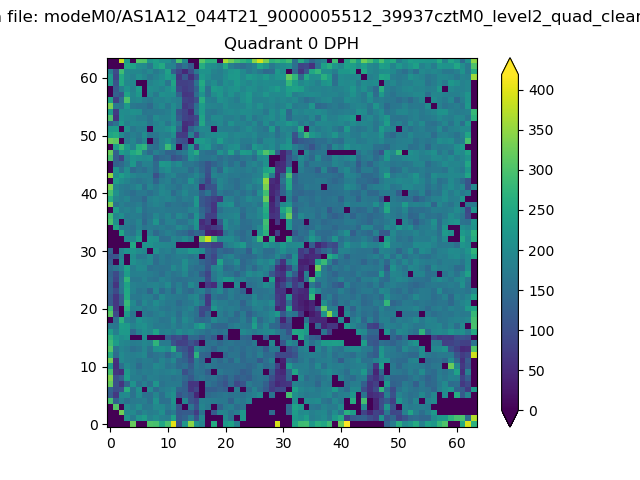 |
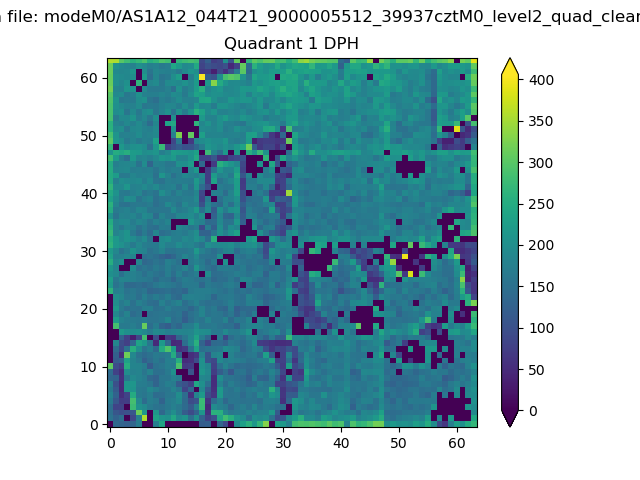 |
Quadrant B |
|---|---|---|---|
| Quadrant D | 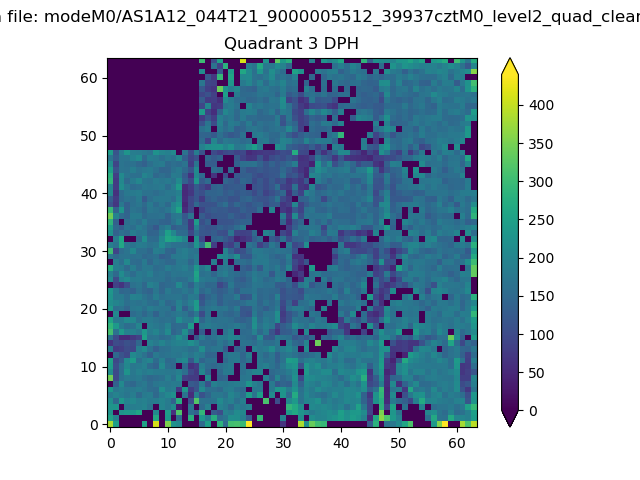 |
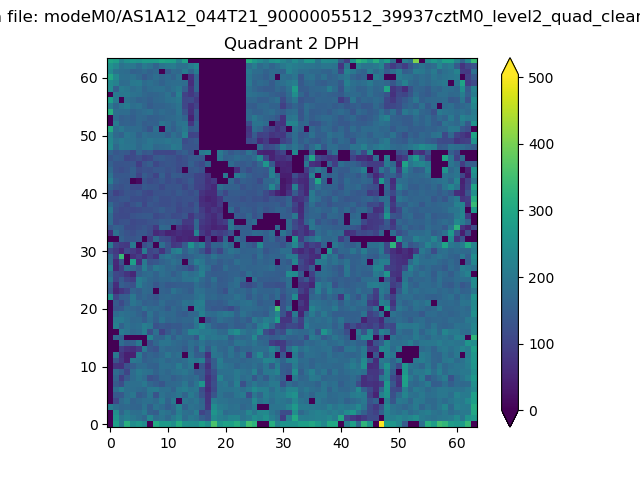 |
Quadrant C |
| Plot type | Count rate plots | Images |
|---|---|---|
| Comparison with Poisson distribution Blue bars denote a histogram of data divided into 1 sec bins. Red curve is a Poisson curve with rate = median count rate of data. |
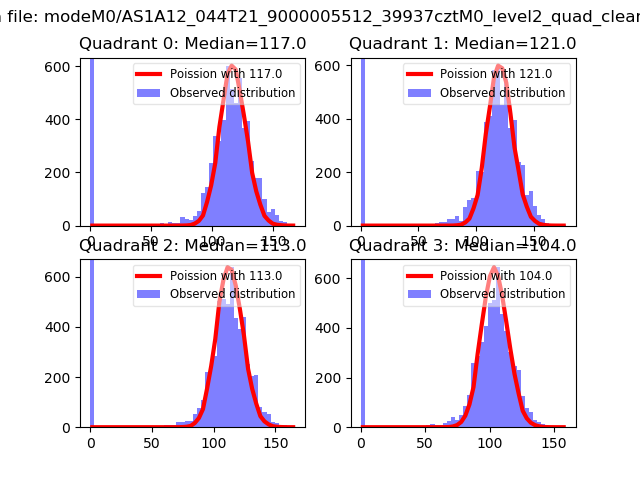 |
 |
| Quadrant-wise count rates Data is divided into 100 sec bins |
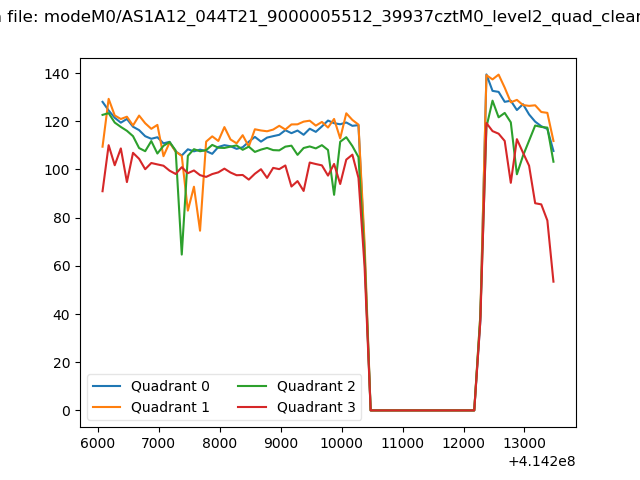 |
|
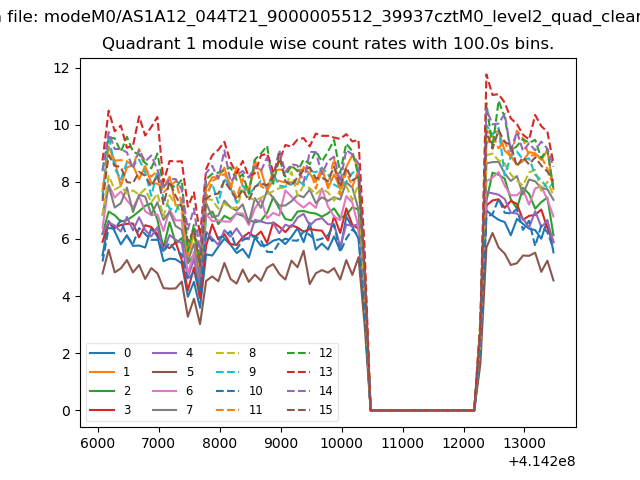
| Module-wise count rates for Quadrant A Data is divided into 100 sec bins |
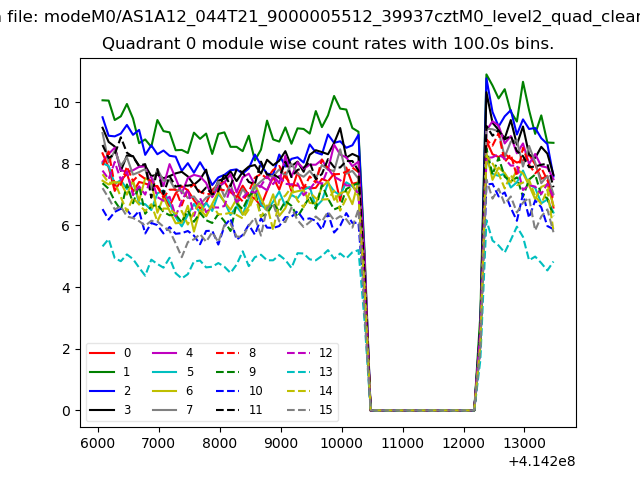 |
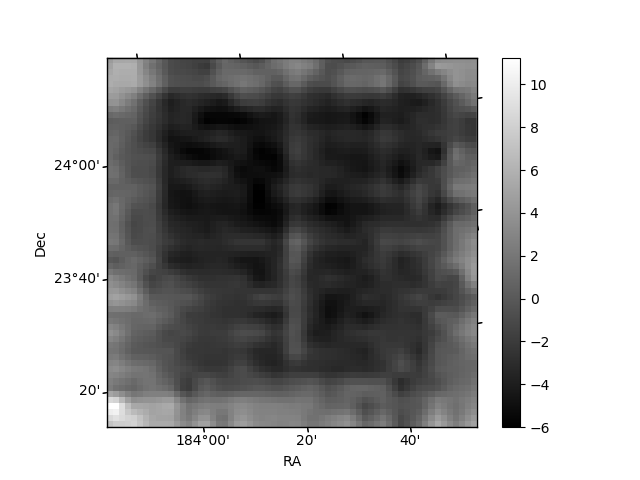 |
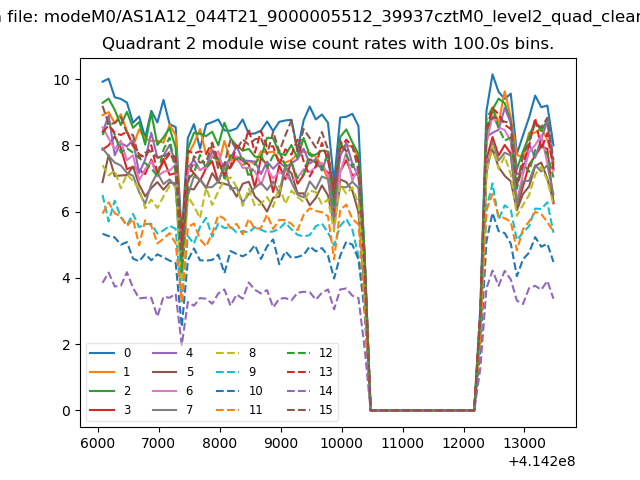
| Module-wise count rates for Quadrant B Data is divided into 100 sec bins |
 |
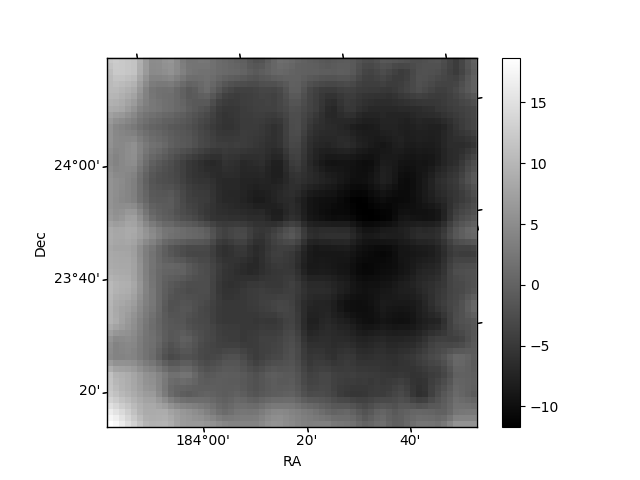 |
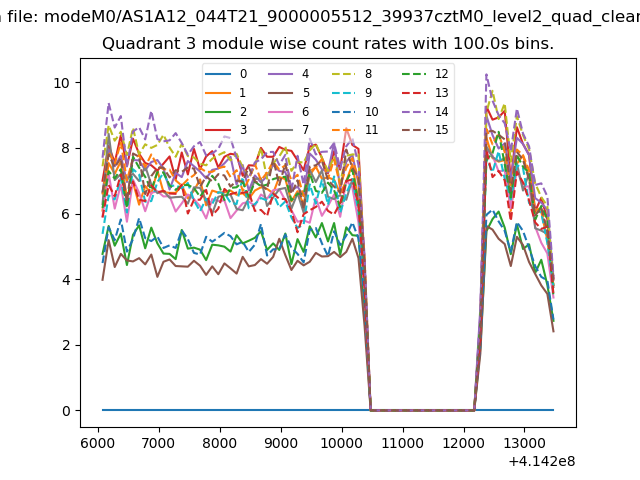
| Module-wise count rates for Quadrant C Data is divided into 100 sec bins |
 |
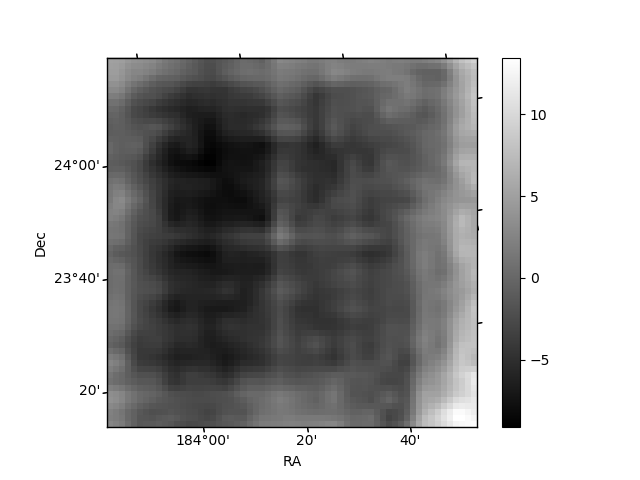 |
| Module-wise count rates for Quadrant D Data is divided into 100 sec bins |
 |
 |
| Parameter | Plot |
|---|---|
| CZT HV Monitor | 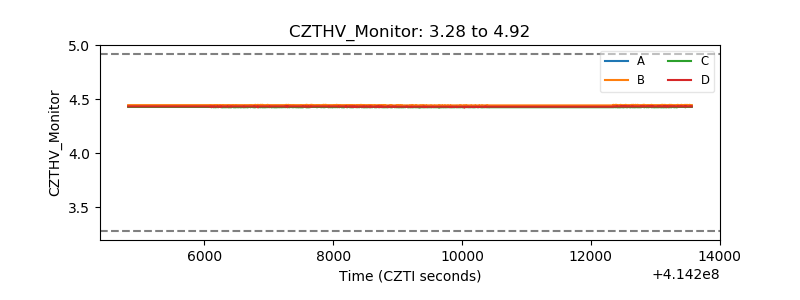 |
| D_VDD | 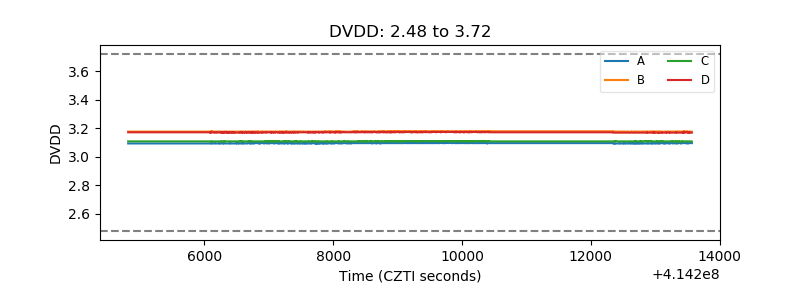 |
| Temperature 1 | 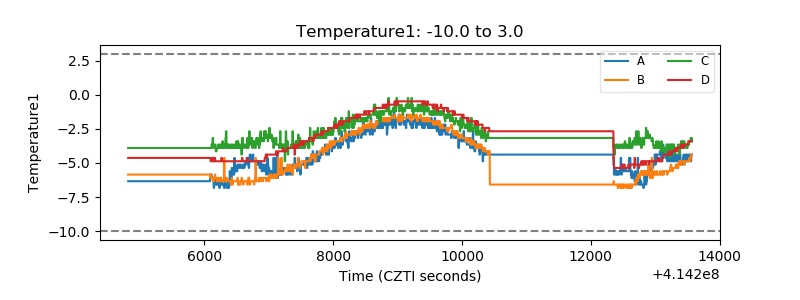 |
| Veto HV Monitor | 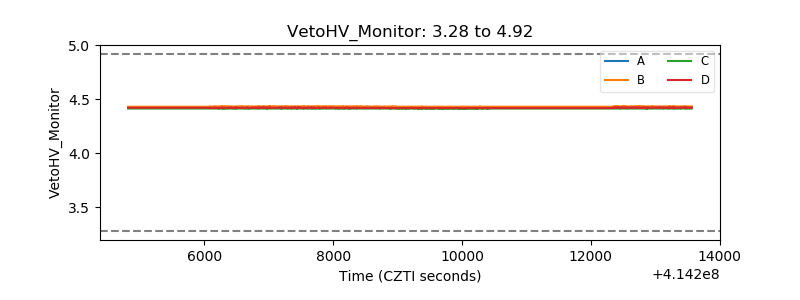 |
| Veto LLD | 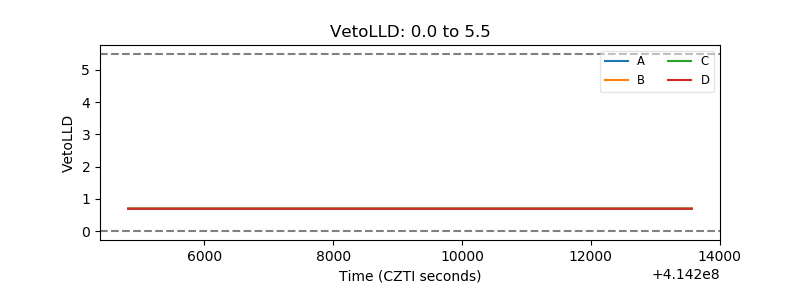 |
| Alpha Counter | 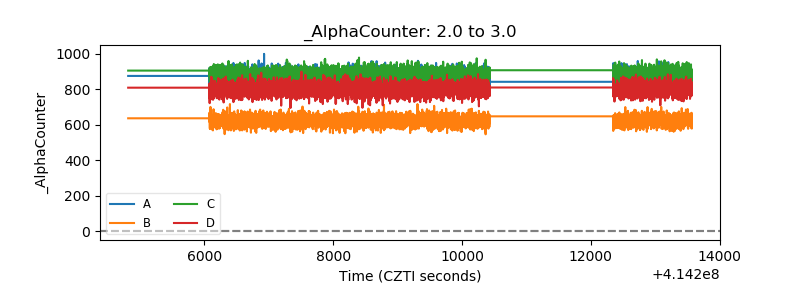 |
| _CPM_Rate | 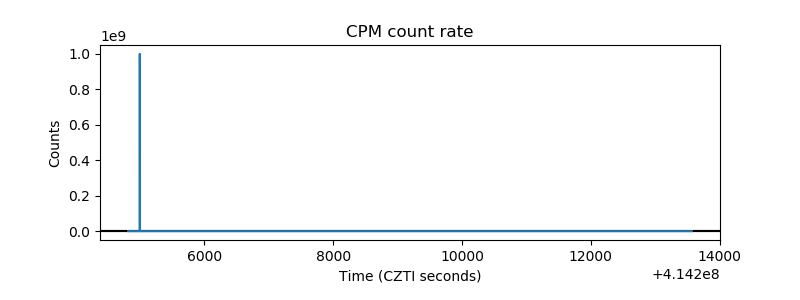 |
| CZT Counter | 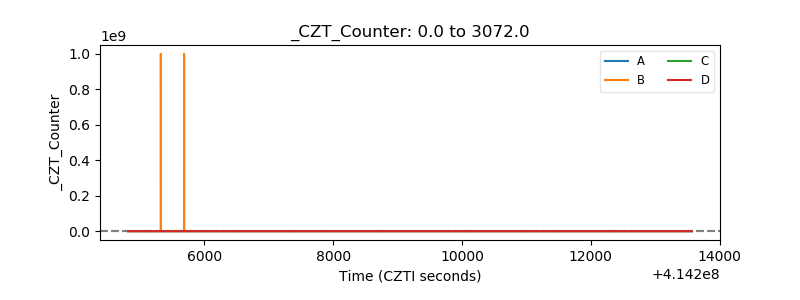 |
| +2.5 Volts monitor | 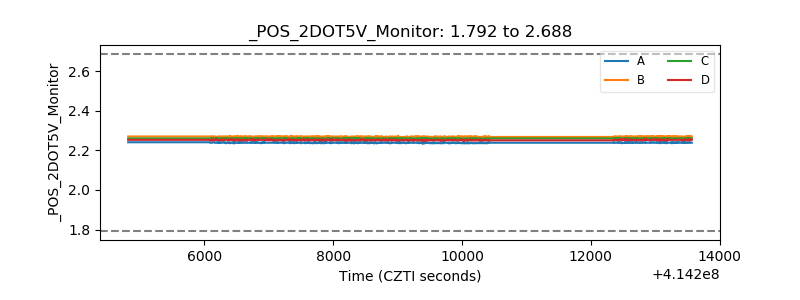 |
| +5 Volts monitor | 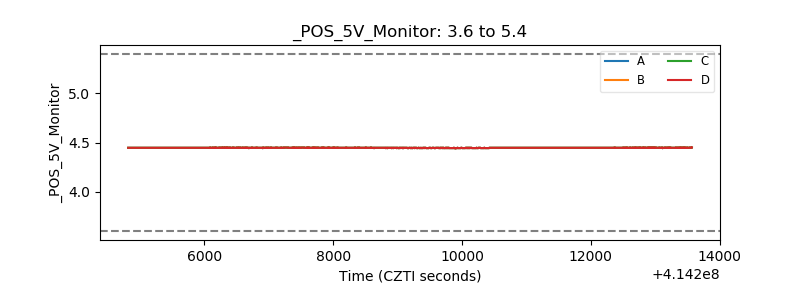 |
| _ROLL_ROT | 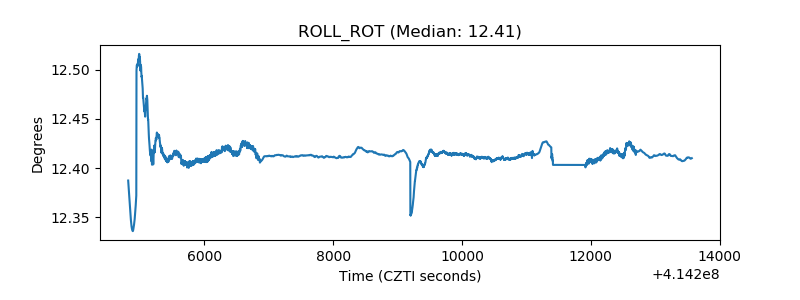 |
| _Roll_DEC | 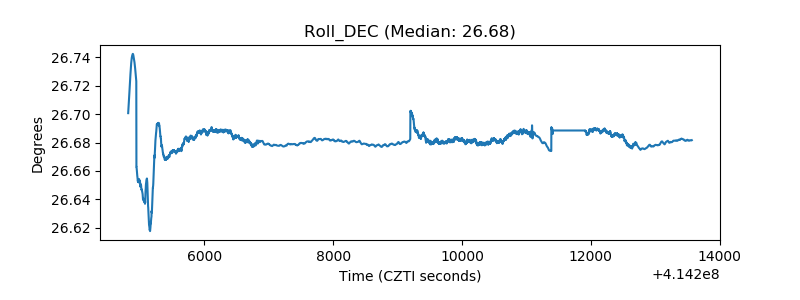 |
| _Roll_RA | 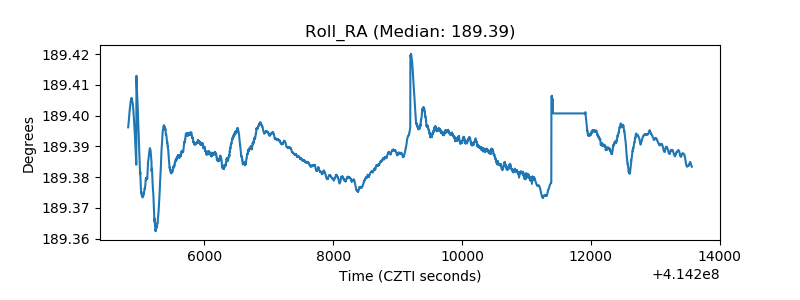 |
| Veto Counter | 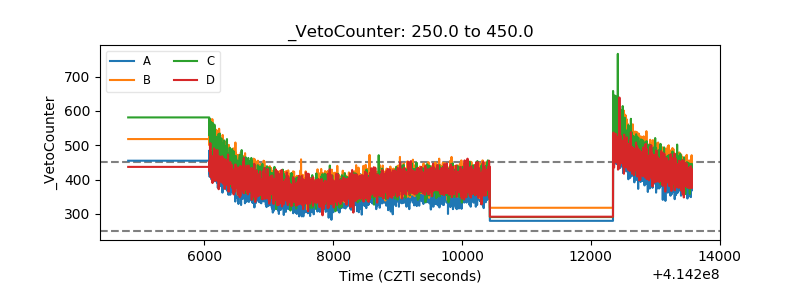 |