| Param | Original file | Final file |
|---|---|---|
| Filename | modeM0/AS1A12_044T21_9000005512_39938cztM0_level2.fits | modeM0/AS1A12_044T21_9000005512_39938cztM0_level2_quad_clean.evt |
| Size (bytes) | 279,288,000 | 71,239,680 |
| Size | 266.3 MB | 67.9 MB |
| Events in quadrant A | 2,226,495 | 493,740 |
| Events in quadrant B | 2,309,949 | 501,183 |
| Events in quadrant C | 2,308,387 | 469,986 |
| Events in quadrant D | 3,178,564 | 408,069 |
| Mode M9 | |||
|---|---|---|---|
| Quadrant | BADHDUFLAG | Total packets | Discarded packets |
| A | 0 | 21 | 0 |
| B | 0 | 21 | 0 |
| C | 0 | 21 | 0 |
| D | 0 | 21 | 0 |
| Mode SS | |||
|---|---|---|---|
| Quadrant | BADHDUFLAG | Total packets | Discarded packets |
| A | 0 | 83 | 3 |
| B | 0 | 84 | 2 |
| C | 0 | 84 | 2 |
| D | 0 | 84 | 2 |
| Mode M0 | |||
|---|---|---|---|
| Quadrant | BADHDUFLAG | Total packets | Discarded packets |
| A | 0 | 8994 | 180 |
| B | 0 | 9673 | 277 |
| C | 0 | 9537 | 371 |
| D | 0 | 12763 | 630 |
| Quadrant | Total seconds | Saturated seconds | Saturation percentage |
|---|---|---|---|
| A | 4041 | 9 | 0.222717% |
| B | 4036 | 61 | 1.511397% |
| C | 4031 | 12 | 0.297693% |
| D | 4026 | 348 | 8.643815% |
Noise dominated data is calculated using 1-second bins in cleaned event files. If a bin has >2000 counts, and if more than 50% of those come from <1% of pixels, then it is considered to be noise-dominated and hence unusable.
| Quadrant | # 1 sec bins | Bins with >0 counts | Bins with >2000 counts | High rate bins dominated by noise | Noise dominated (total time) | Noise dominated (detector-on time) | Marked lightcurve |
|---|---|---|---|---|---|---|---|
| A | 6143 | 4077 | 4 | 4 | 0.07% | 0.10% | 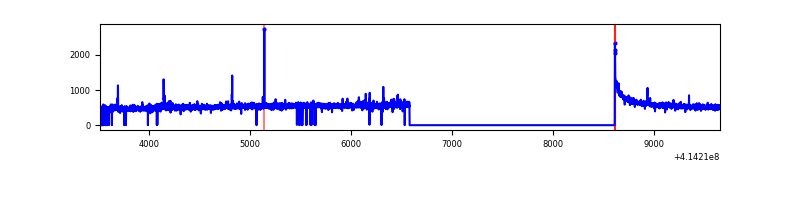 |
| B | 6133 | 4073 | 28 | 28 | 0.46% | 0.69% | 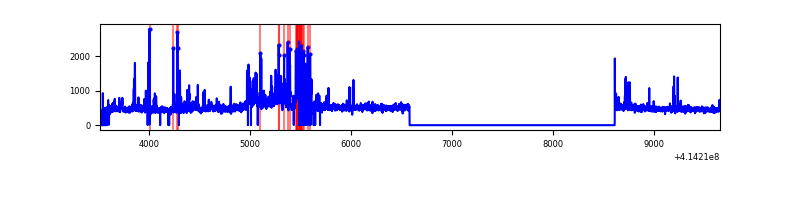 |
| C | 6106 | 4061 | 5 | 5 | 0.08% | 0.12% | 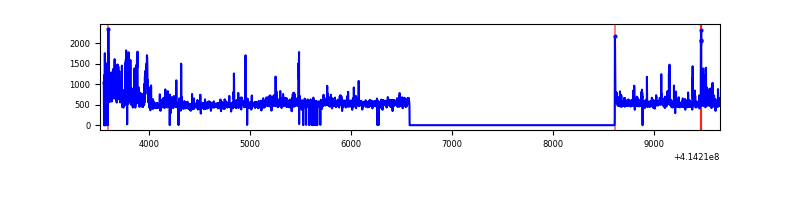 |
| D | 6102 | 4050 | 335 | 335 | 5.49% | 8.27% | 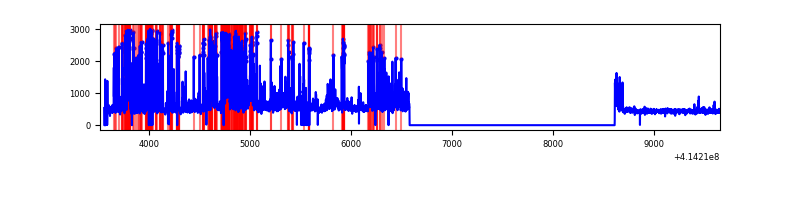 |
Top three noisy pixels from each quadrant. If the there are fewer than three noisy pixels in the level2.evt file, extra rows are filled as -1
| Pixel properties | Quadrant properties | ||||||
|---|---|---|---|---|---|---|---|
| Quadrant | DetID | PixID | Counts | Sigma | Mean | Median | Sigma |
| A | 10 | 83 | 325633 | 3308.2 | 480 | 472 | 98.3 |
| A | 15 | 223 | 12938 | 126.83 | 480 | 472 | 98.3 |
| A | 13 | 248 | 10426 | 101.27 | 480 | 472 | 98.3 |
| B | 4 | 170 | 228348 | 2503.62 | 471 | 460 | 91.0 |
| B | 0 | 183 | 99735 | 1090.65 | 471 | 460 | 91.0 |
| B | 5 | 255 | 66769 | 728.48 | 471 | 460 | 91.0 |
| C | 9 | 54 | 337377 | 3132.97 | 458 | 462 | 107.5 |
| C | 15 | 214 | 166867 | 1547.4 | 458 | 462 | 107.5 |
| C | 0 | 10 | 7706 | 67.36 | 458 | 462 | 107.5 |
| D | 12 | 227 | 782599 | 7135.39 | 442 | 429 | 109.6 |
| D | 2 | 250 | 253192 | 2305.85 | 442 | 429 | 109.6 |
| D | 9 | 49 | 112309 | 1020.63 | 442 | 429 | 109.6 |
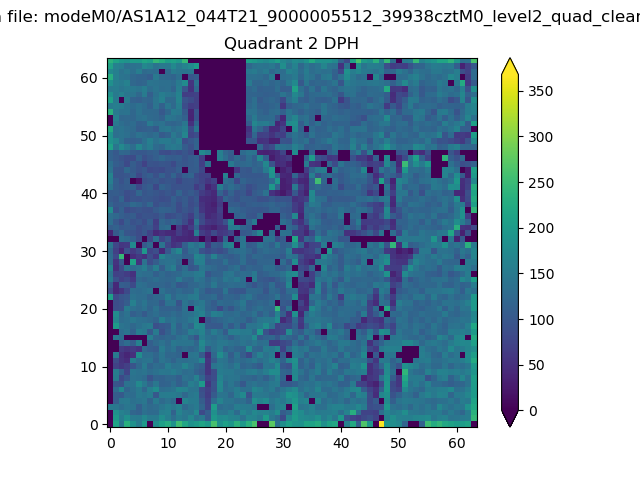
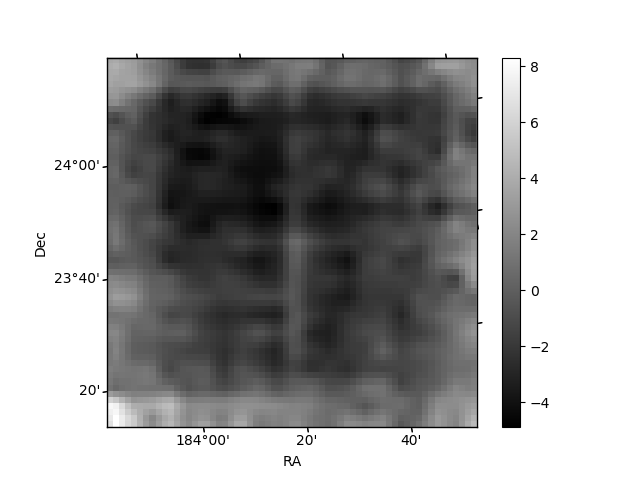
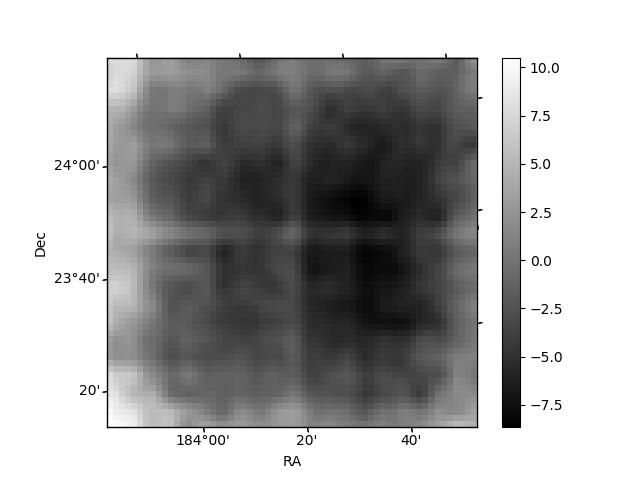
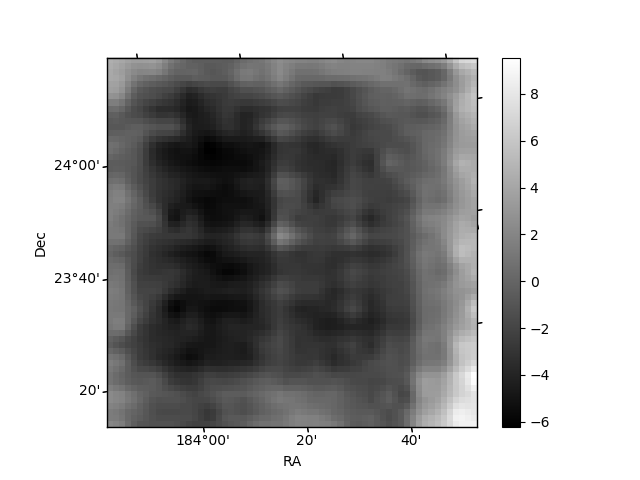
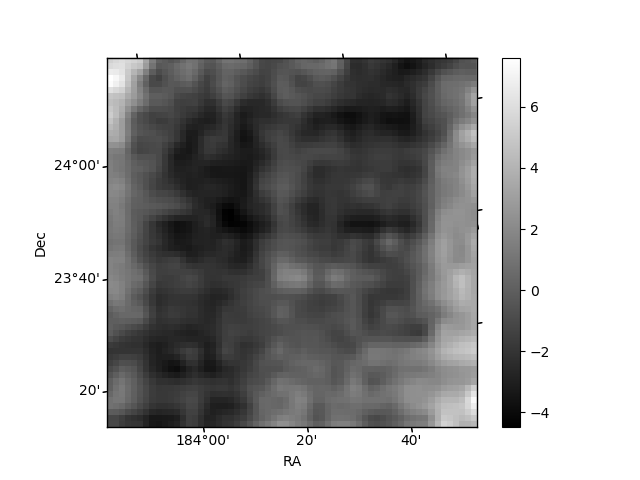
Histogram calculated using DETX and DETY for each event in the final _common_clean file
| Quadrant A | 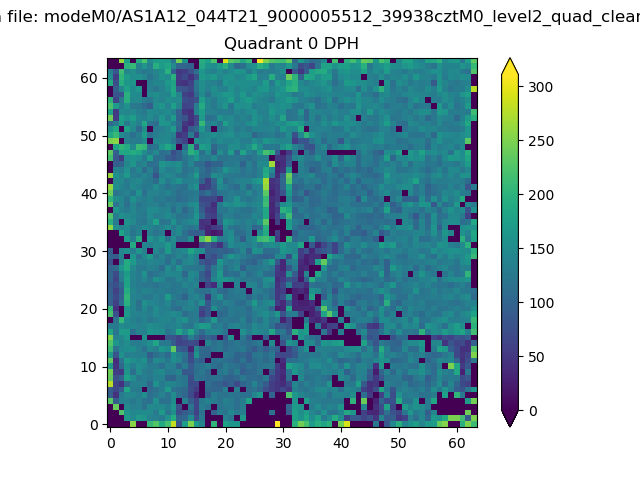 |
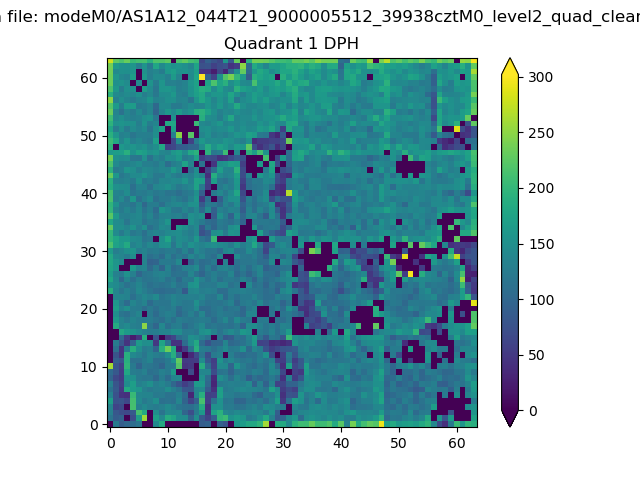 |
Quadrant B |
|---|---|---|---|
| Quadrant D | 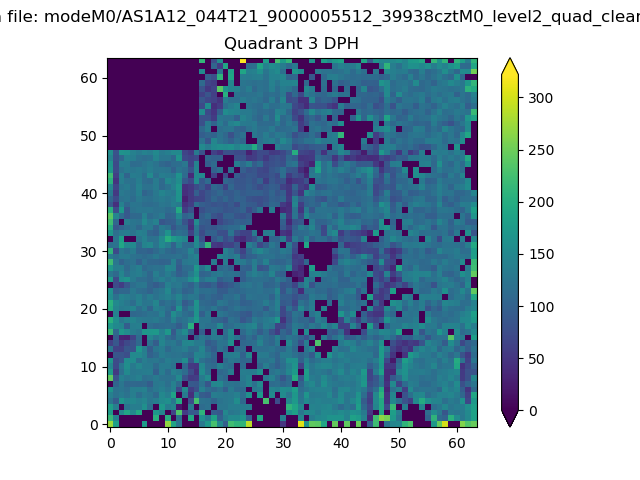 |
 |
Quadrant C |
| Plot type | Count rate plots | Images |
|---|---|---|
| Comparison with Poisson distribution Blue bars denote a histogram of data divided into 1 sec bins. Red curve is a Poisson curve with rate = median count rate of data. |
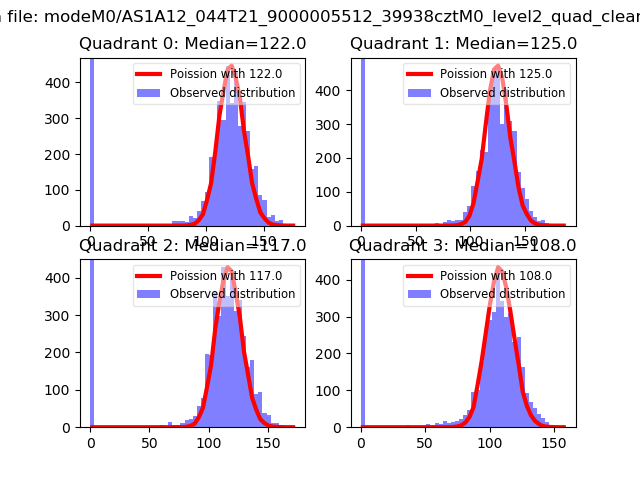 |
 |
| Quadrant-wise count rates Data is divided into 100 sec bins |
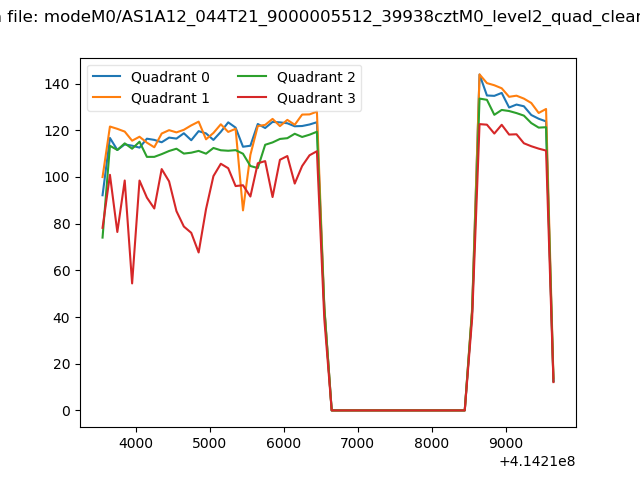 |
|
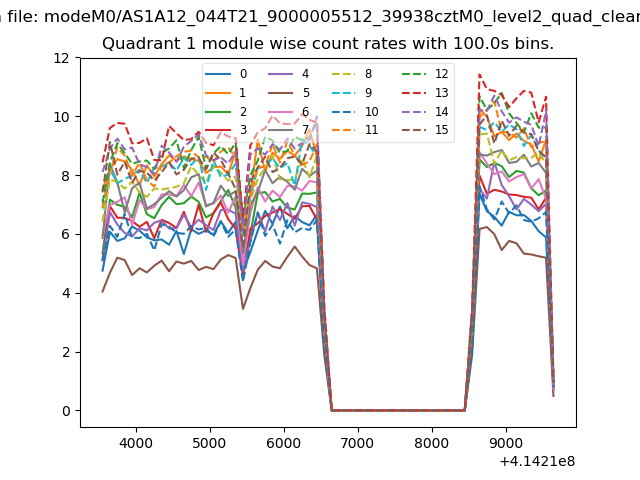
| Module-wise count rates for Quadrant A Data is divided into 100 sec bins |
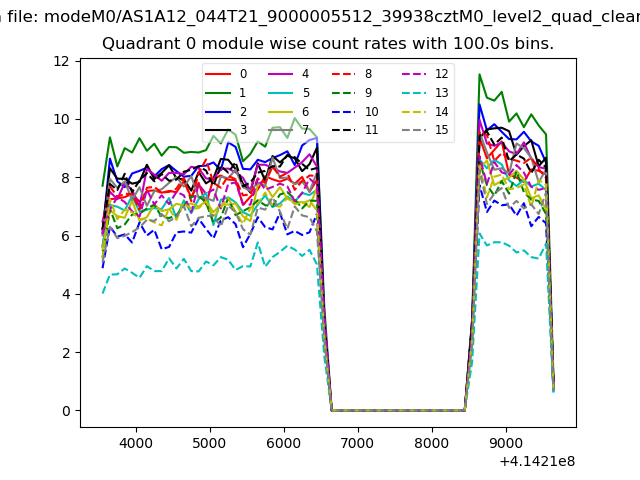 |
 |
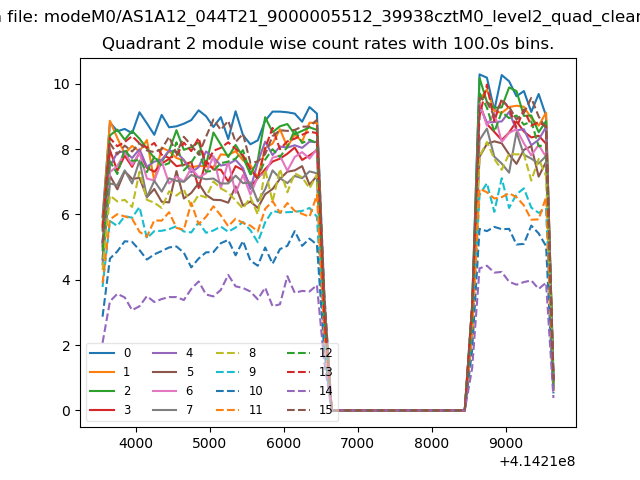
| Module-wise count rates for Quadrant B Data is divided into 100 sec bins |
 |
 |
| Module-wise count rates for Quadrant C Data is divided into 100 sec bins |
 |
 |
| Module-wise count rates for Quadrant D Data is divided into 100 sec bins |
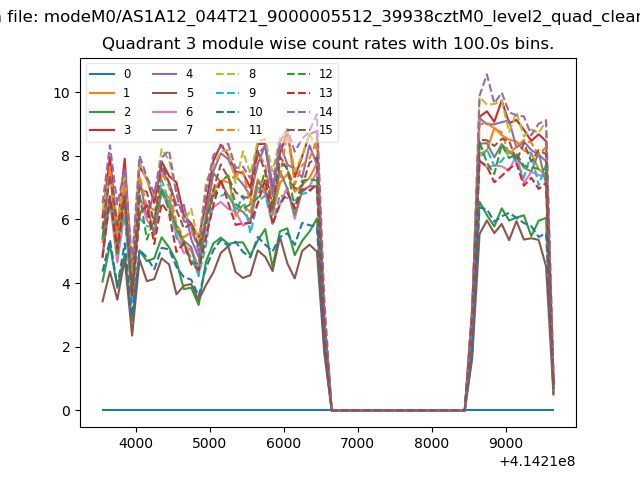 |
 |
| Parameter | Plot |
|---|---|
| CZT HV Monitor | 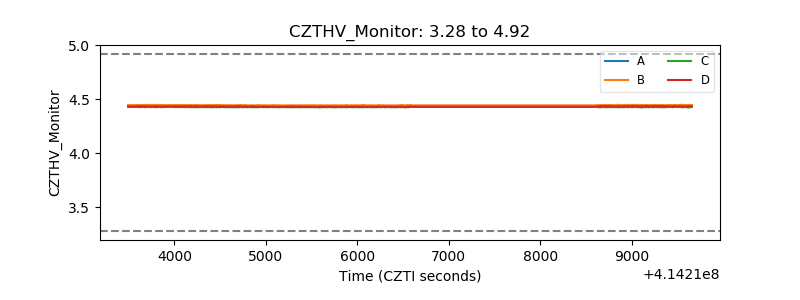 |
| D_VDD | 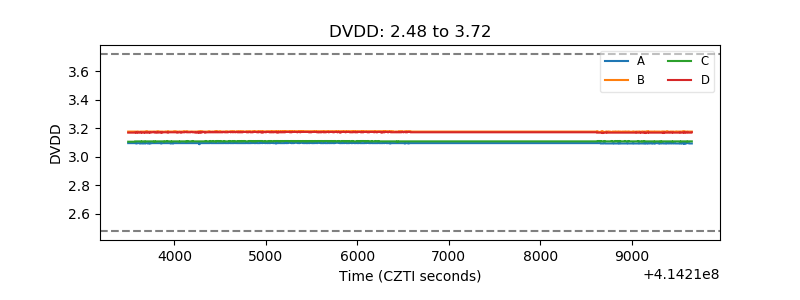 |
| Temperature 1 | 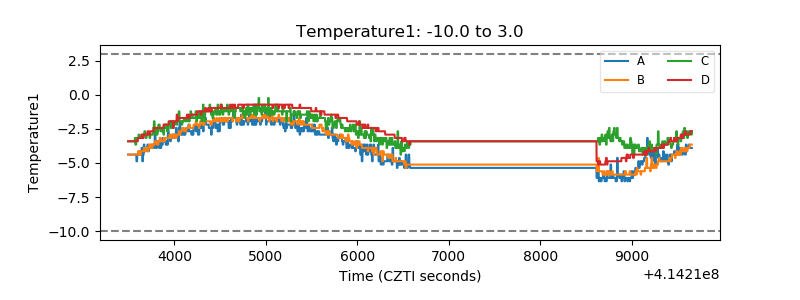 |
| Veto HV Monitor | 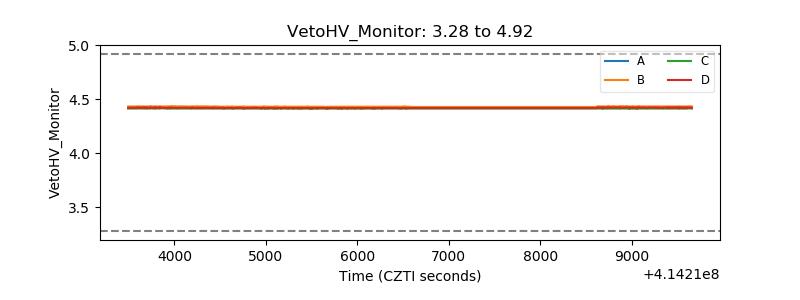 |
| Veto LLD | 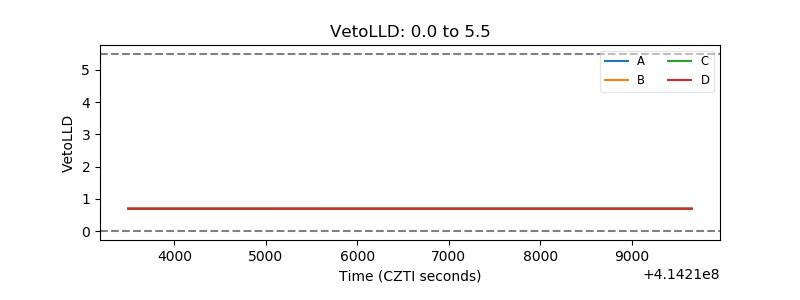 |
| Alpha Counter |  |
| _CPM_Rate | 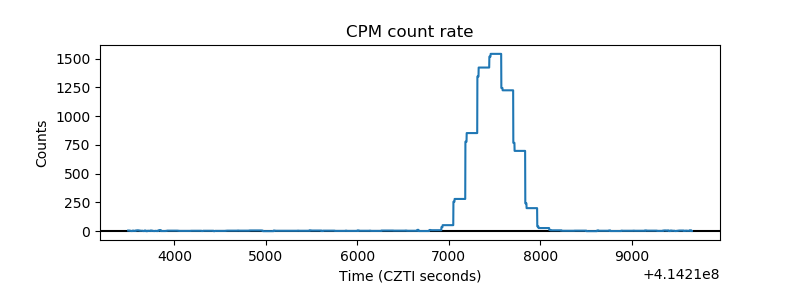 |
| CZT Counter | 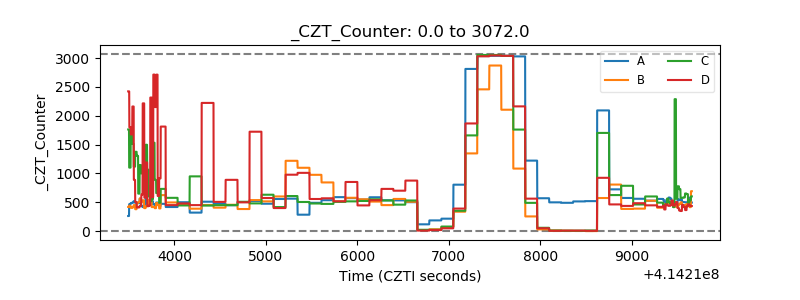 |
| +2.5 Volts monitor | 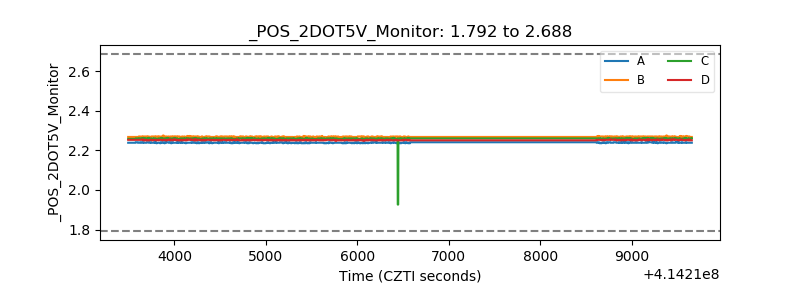 |
| +5 Volts monitor | 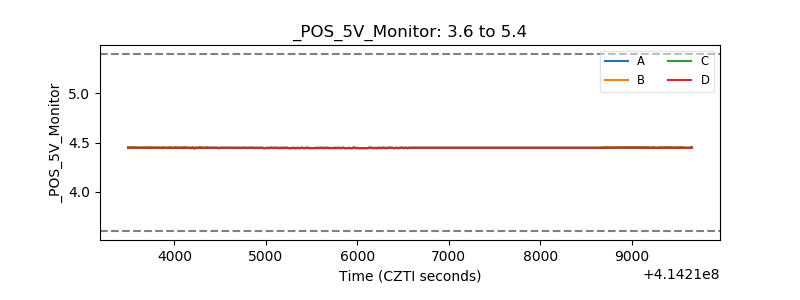 |
| _ROLL_ROT | 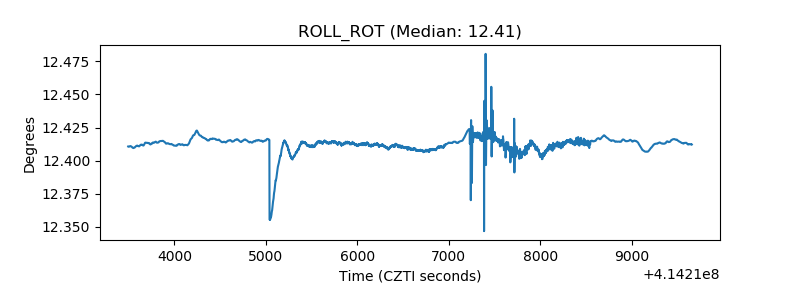 |
| _Roll_DEC | 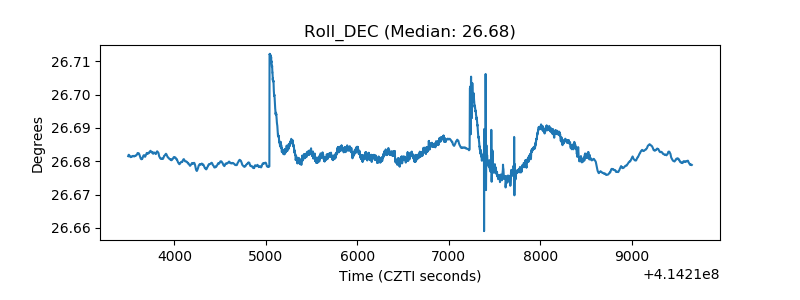 |
| _Roll_RA | 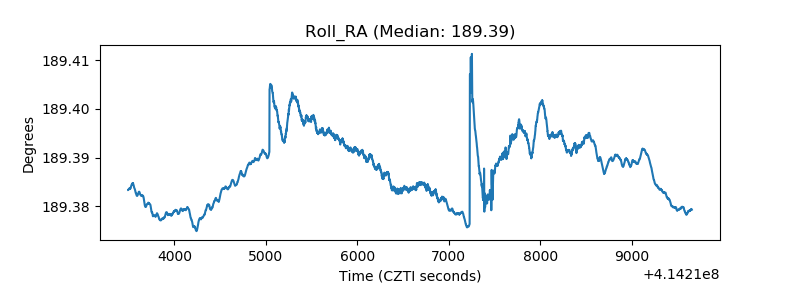 |
| Veto Counter | 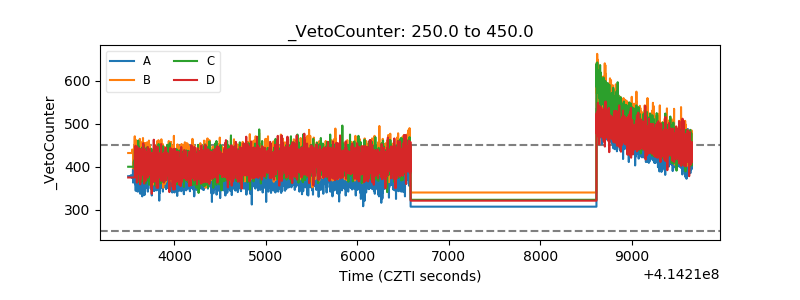 |