| Param | Original file | Final file |
|---|---|---|
| Filename | modeM0/AS1A12_044T21_9000005512_39940cztM0_level2.fits | modeM0/AS1A12_044T21_9000005512_39940cztM0_level2_quad_clean.evt |
| Size (bytes) | 353,764,800 | 79,920,000 |
| Size | 337.4 MB | 76.2 MB |
| Events in quadrant A | 2,628,258 | 566,493 |
| Events in quadrant B | 2,360,571 | 573,189 |
| Events in quadrant C | 3,850,510 | 502,908 |
| Events in quadrant D | 3,898,505 | 454,847 |
| Mode M9 | |||
|---|---|---|---|
| Quadrant | BADHDUFLAG | Total packets | Discarded packets |
| A | 0 | 28 | 0 |
| B | 0 | 28 | 0 |
| C | 0 | 28 | 0 |
| D | 0 | 29 | 0 |
| Mode SS | |||
|---|---|---|---|
| Quadrant | BADHDUFLAG | Total packets | Discarded packets |
| A | 0 | 98 | 2 |
| B | 0 | 99 | 4 |
| C | 0 | 99 | 4 |
| D | 0 | 96 | 4 |
| Mode M0 | |||
|---|---|---|---|
| Quadrant | BADHDUFLAG | Total packets | Discarded packets |
| A | 0 | 10836 | 458 |
| B | 0 | 10370 | 511 |
| C | 0 | 15700 | 1124 |
| D | 0 | 15909 | 1365 |
| Quadrant | Total seconds | Saturated seconds | Saturation percentage |
|---|---|---|---|
| A | 4659 | 9 | 0.193175% |
| B | 4625 | 21 | 0.454054% |
| C | 4531 | 260 | 5.738248% |
| D | 4530 | 418 | 9.227373% |
Noise dominated data is calculated using 1-second bins in cleaned event files. If a bin has >2000 counts, and if more than 50% of those come from <1% of pixels, then it is considered to be noise-dominated and hence unusable.
| Quadrant | # 1 sec bins | Bins with >0 counts | Bins with >2000 counts | High rate bins dominated by noise | Noise dominated (total time) | Noise dominated (detector-on time) | Marked lightcurve |
|---|---|---|---|---|---|---|---|
| A | 7069 | 4776 | 6 | 6 | 0.08% | 0.13% | 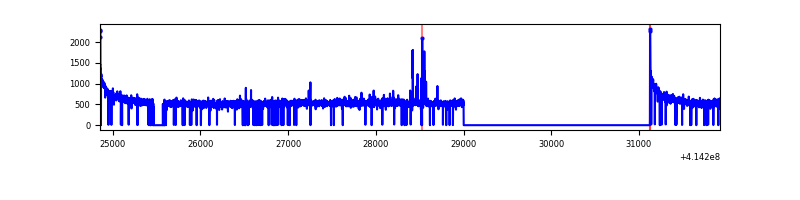 |
| B | 7069 | 4757 | 14 | 14 | 0.20% | 0.29% | 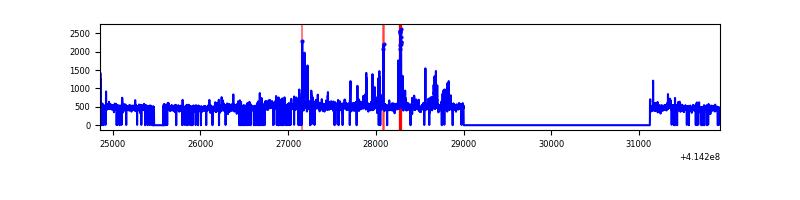 |
| C | 7068 | 4715 | 185 | 185 | 2.62% | 3.92% | 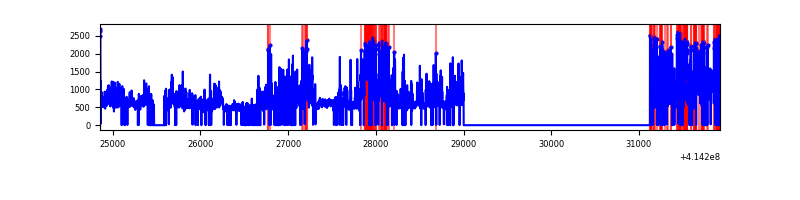 |
| D | 7069 | 4686 | 438 | 438 | 6.20% | 9.35% | 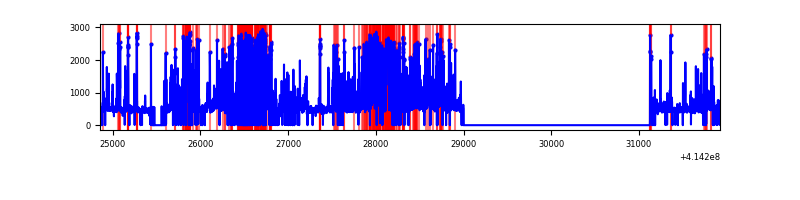 |
Top three noisy pixels from each quadrant. If the there are fewer than three noisy pixels in the level2.evt file, extra rows are filled as -1
| Pixel properties | Quadrant properties | ||||||
|---|---|---|---|---|---|---|---|
| Quadrant | DetID | PixID | Counts | Sigma | Mean | Median | Sigma |
| A | 10 | 83 | 443195 | 3931.05 | 552 | 541 | 112.6 |
| A | 14 | 250 | 15950 | 136.84 | 552 | 541 | 112.6 |
| A | 13 | 248 | 14447 | 123.49 | 552 | 541 | 112.6 |
| B | 0 | 183 | 79705 | 758.19 | 539 | 526 | 104.4 |
| B | 5 | 255 | 50849 | 481.88 | 539 | 526 | 104.4 |
| B | 0 | 230 | 44942 | 425.31 | 539 | 526 | 104.4 |
| C | 9 | 54 | 1655607 | 14101.86 | 503 | 506 | 117.4 |
| C | 15 | 214 | 190632 | 1619.92 | 503 | 506 | 117.4 |
| C | 0 | 10 | 14019 | 115.13 | 503 | 506 | 117.4 |
| D | 12 | 227 | 1077771 | 8590.2 | 504 | 489 | 125.4 |
| D | 12 | 233 | 329419 | 2622.87 | 504 | 489 | 125.4 |
| D | 2 | 250 | 252538 | 2009.83 | 504 | 489 | 125.4 |
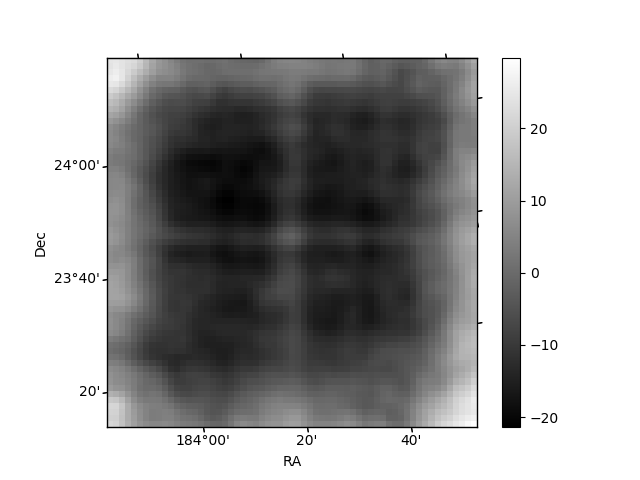
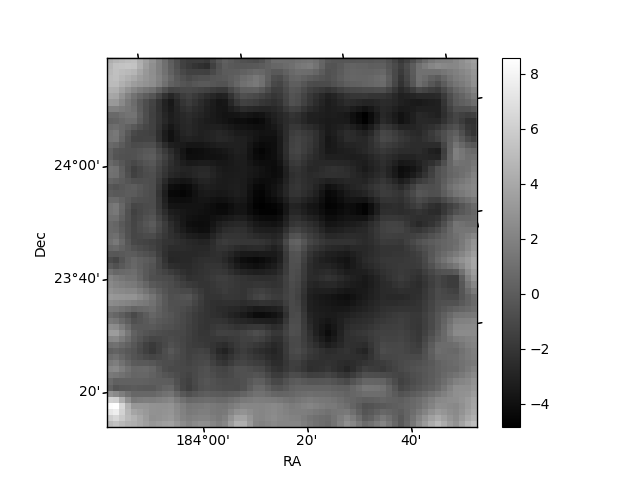
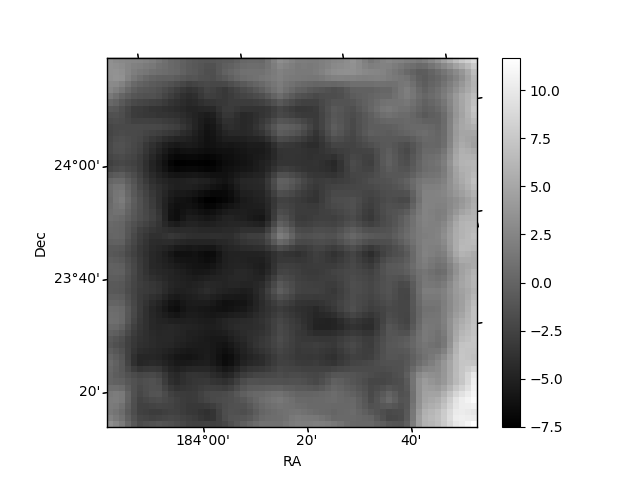
Histogram calculated using DETX and DETY for each event in the final _common_clean file
| Quadrant A | 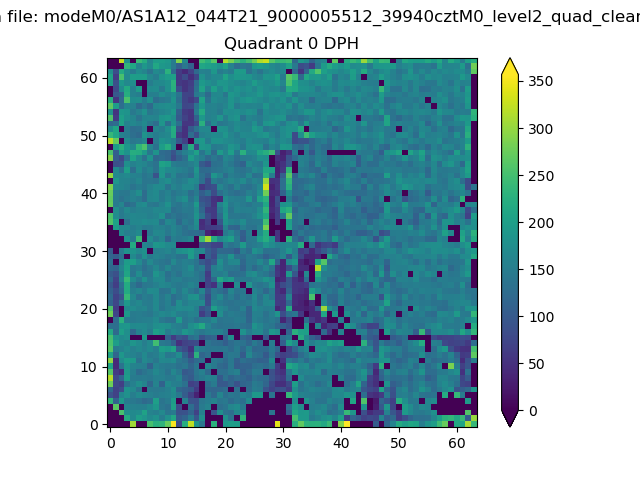 |
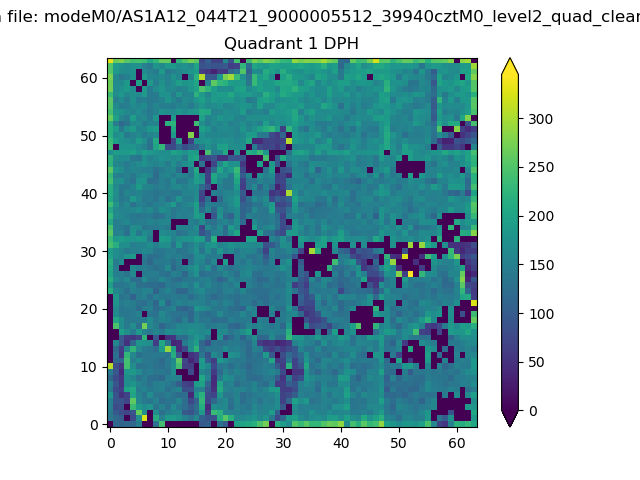 |
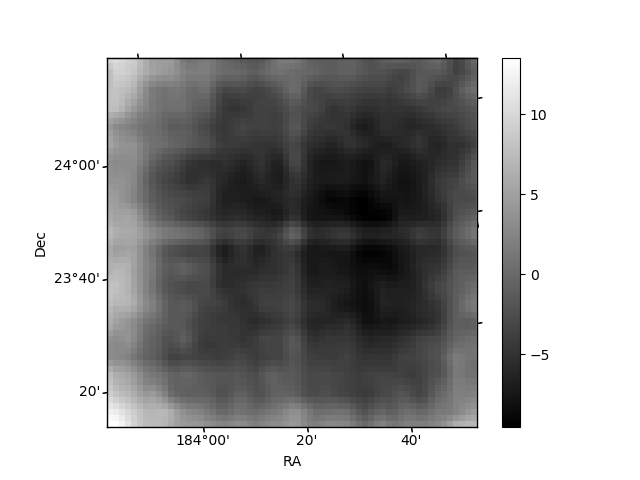
Quadrant B |
|---|---|---|---|
| Quadrant D | 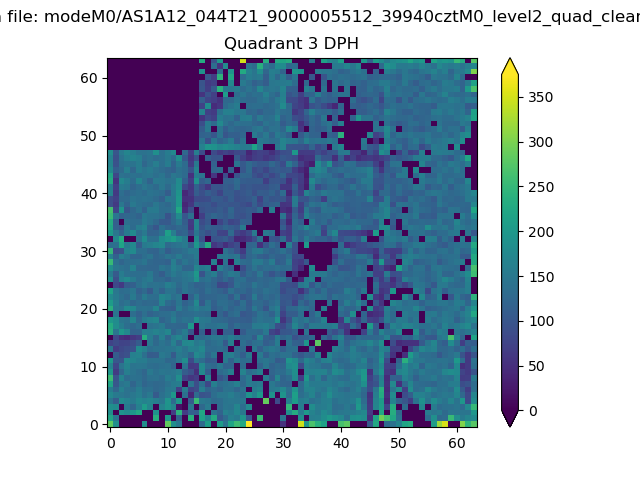 |
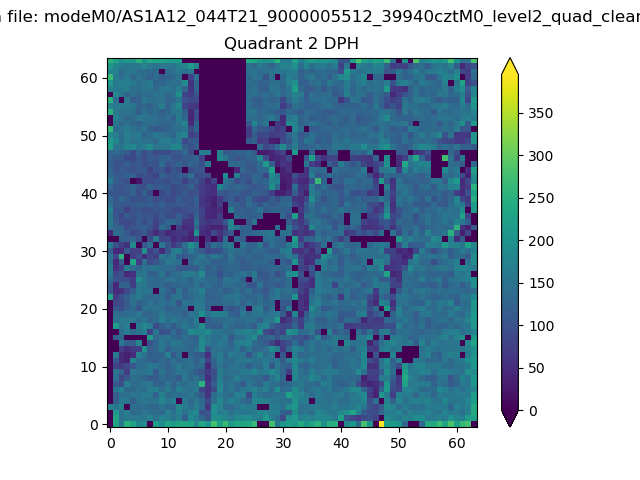 |
Quadrant C |
| Plot type | Count rate plots | Images |
|---|---|---|
| Comparison with Poisson distribution Blue bars denote a histogram of data divided into 1 sec bins. Red curve is a Poisson curve with rate = median count rate of data. |
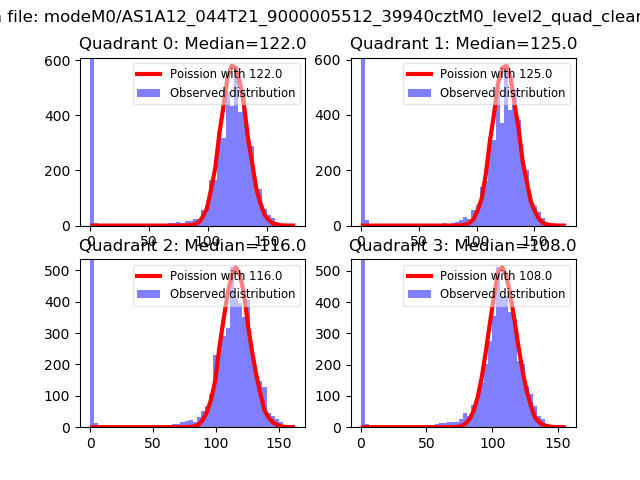 |
 |
| Quadrant-wise count rates Data is divided into 100 sec bins |
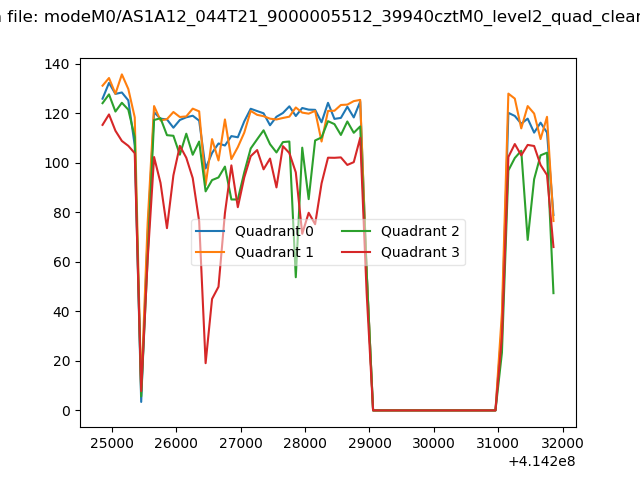 |
|
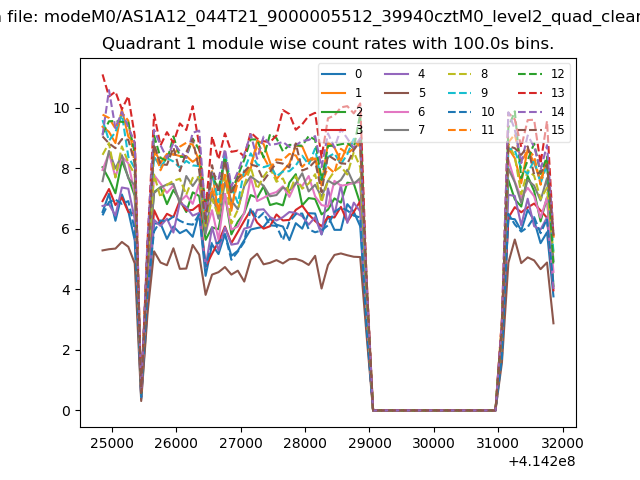
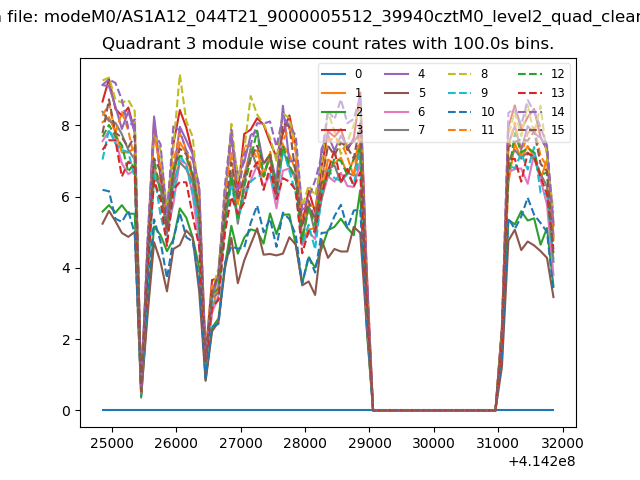
| Module-wise count rates for Quadrant A Data is divided into 100 sec bins |
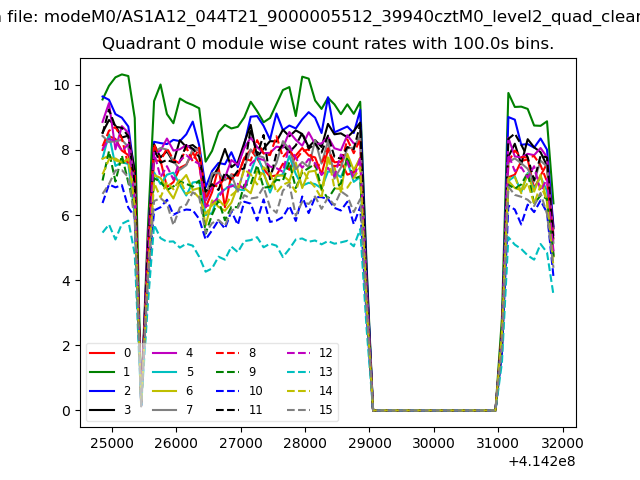 |
 |
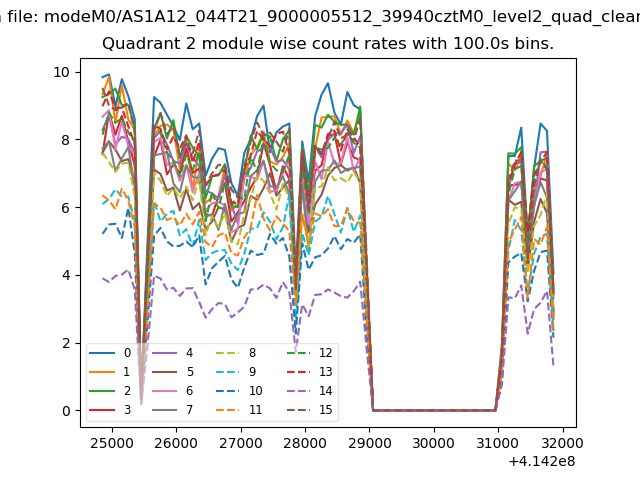
| Module-wise count rates for Quadrant B Data is divided into 100 sec bins |
 |
 |
| Module-wise count rates for Quadrant C Data is divided into 100 sec bins |
 |
 |
| Module-wise count rates for Quadrant D Data is divided into 100 sec bins |
 |
 |
| Parameter | Plot |
|---|---|
| CZT HV Monitor | 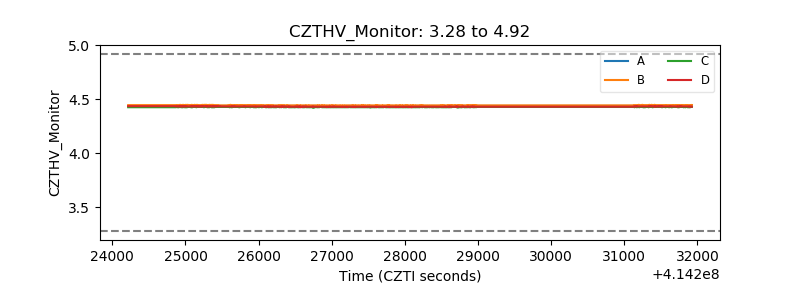 |
| D_VDD | 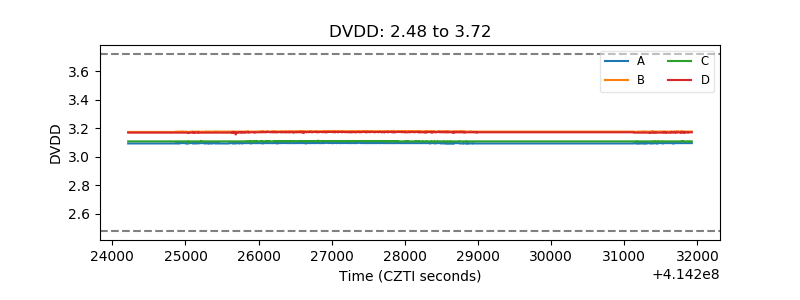 |
| Temperature 1 | 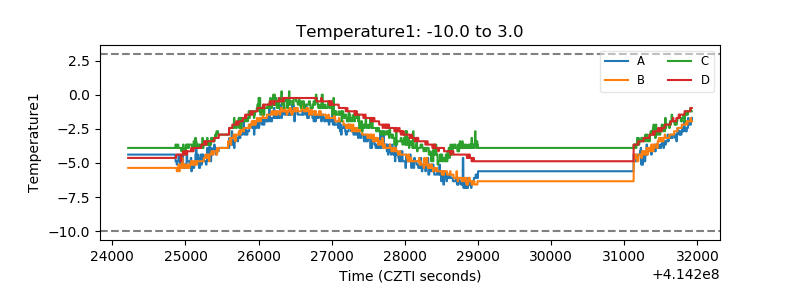 |
| Veto HV Monitor | 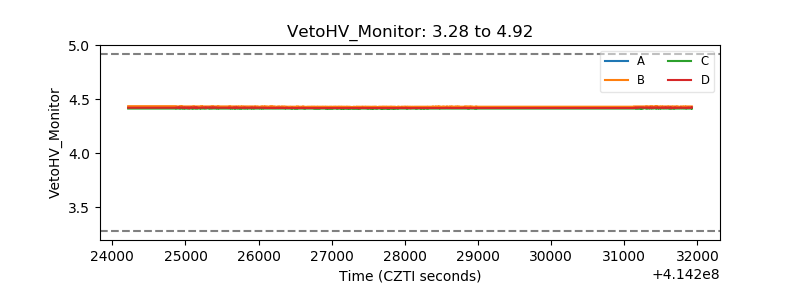 |
| Veto LLD | 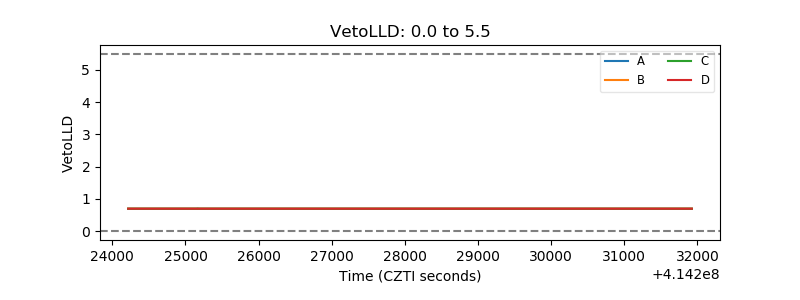 |
| Alpha Counter | 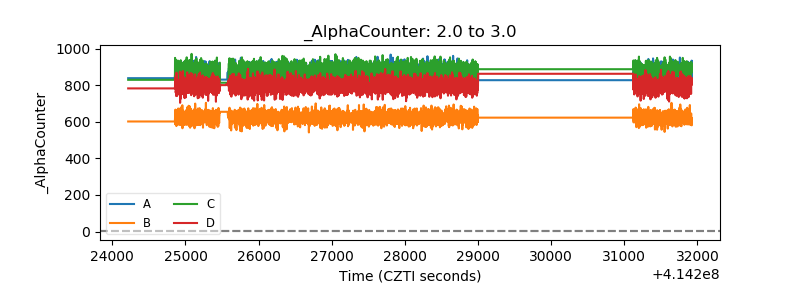 |
| _CPM_Rate | 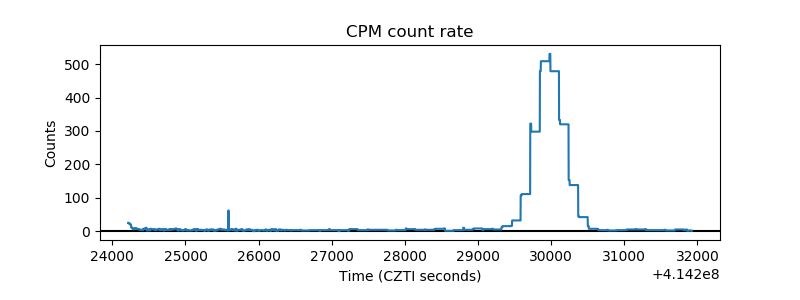 |
| CZT Counter | 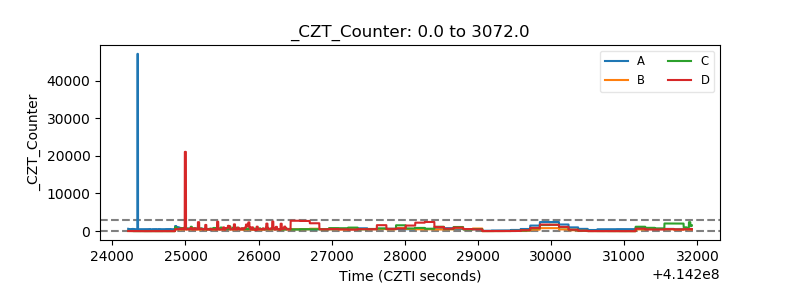 |
| +2.5 Volts monitor | 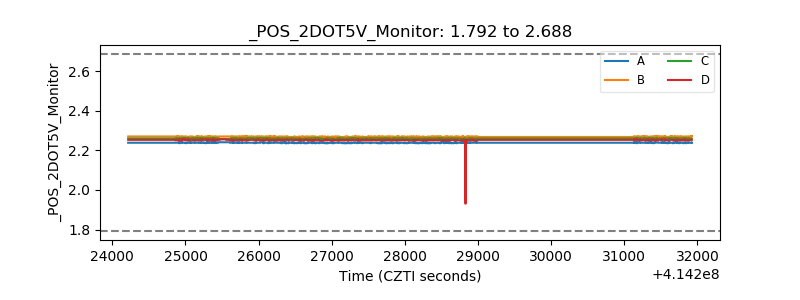 |
| +5 Volts monitor | 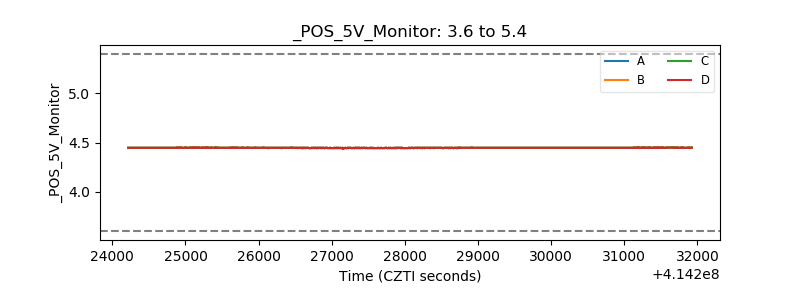 |
| _ROLL_ROT | 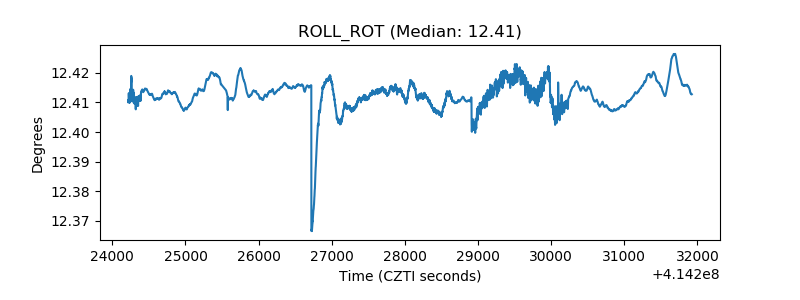 |
| _Roll_DEC | 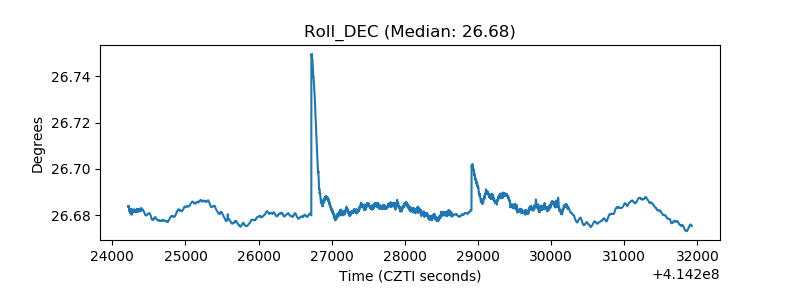 |
| _Roll_RA | 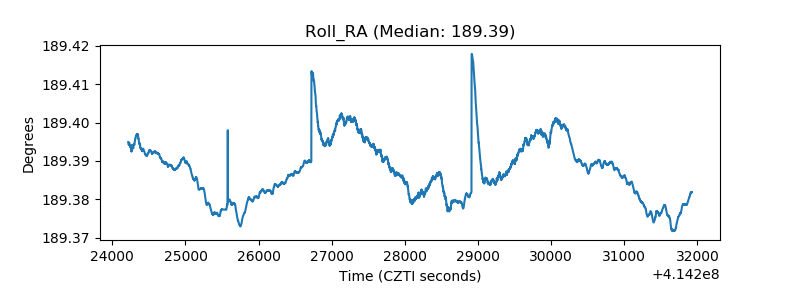 |
| Veto Counter | 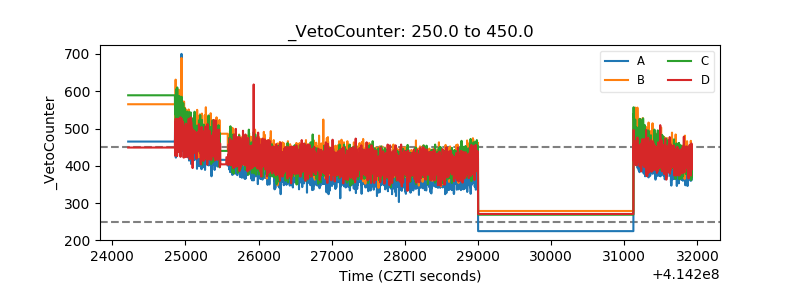 |