| Param | Original file | Final file |
|---|---|---|
| Filename | modeM0/AS1A12_044T21_9000005512_39941cztM0_level2.fits | modeM0/AS1A12_044T21_9000005512_39941cztM0_level2_quad_clean.evt |
| Size (bytes) | 506,986,560 | 83,021,760 |
| Size | 483.5 MB | 79.2 MB |
| Events in quadrant A | 2,855,414 | 612,318 |
| Events in quadrant B | 3,734,125 | 599,383 |
| Events in quadrant C | 7,175,914 | 448,203 |
| Events in quadrant D | 4,593,253 | 485,454 |
| Mode M9 | |||
|---|---|---|---|
| Quadrant | BADHDUFLAG | Total packets | Discarded packets |
| A | 0 | 25 | 0 |
| B | 0 | 25 | 0 |
| C | 0 | 25 | 0 |
| D | 0 | 26 | 0 |
| Mode SS | |||
|---|---|---|---|
| Quadrant | BADHDUFLAG | Total packets | Discarded packets |
| A | 0 | 108 | 0 |
| B | 0 | 108 | 0 |
| C | 0 | 108 | 0 |
| D | 0 | 108 | 0 |
| Mode M0 | |||
|---|---|---|---|
| Quadrant | BADHDUFLAG | Total packets | Discarded packets |
| A | 0 | 11425 | 3 |
| B | 0 | 14593 | 2 |
| C | 0 | 24992 | 2 |
| D | 0 | 17146 | 2 |
| Quadrant | Total seconds | Saturated seconds | Saturation percentage |
|---|---|---|---|
| A | 5256 | 7 | 0.133181% |
| B | 5256 | 275 | 5.232116% |
| C | 5256 | 1588 | 30.213090% |
| D | 5256 | 668 | 12.709285% |
Noise dominated data is calculated using 1-second bins in cleaned event files. If a bin has >2000 counts, and if more than 50% of those come from <1% of pixels, then it is considered to be noise-dominated and hence unusable.
| Quadrant | # 1 sec bins | Bins with >0 counts | Bins with >2000 counts | High rate bins dominated by noise | Noise dominated (total time) | Noise dominated (detector-on time) | Marked lightcurve |
|---|---|---|---|---|---|---|---|
| A | 7319 | 5257 | 4 | 4 | 0.05% | 0.08% | 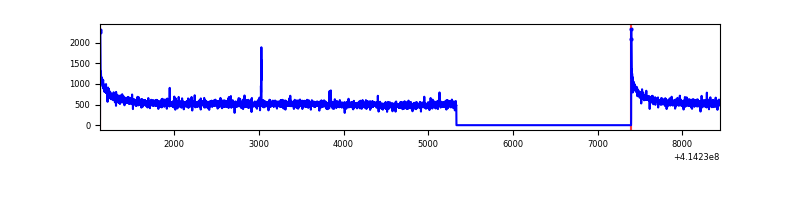 |
| B | 7319 | 5257 | 231 | 231 | 3.16% | 4.39% | 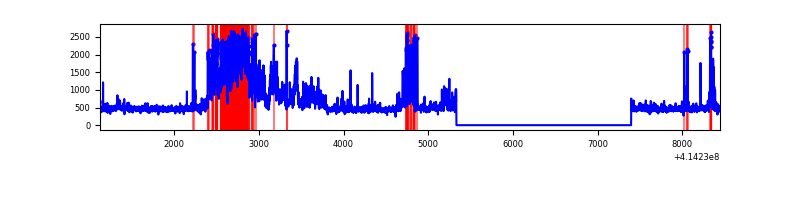 |
| C | 7319 | 5257 | 1143 | 1143 | 15.62% | 21.74% | 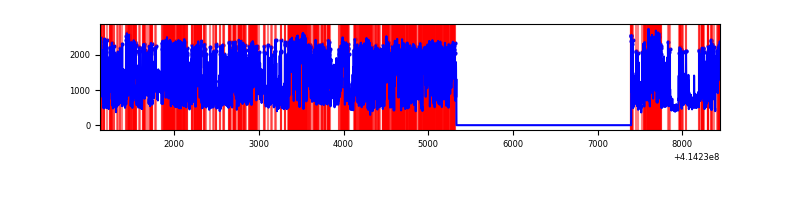 |
| D | 7319 | 5257 | 683 | 683 | 9.33% | 12.99% | 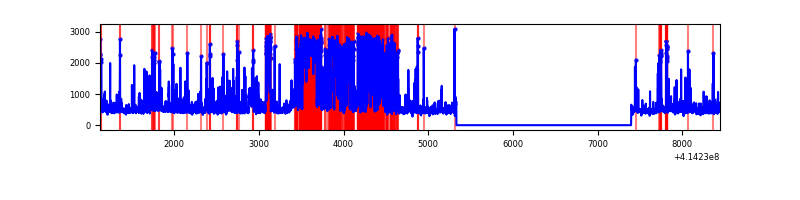 |
Top three noisy pixels from each quadrant. If the there are fewer than three noisy pixels in the level2.evt file, extra rows are filled as -1
| Pixel properties | Quadrant properties | ||||||
|---|---|---|---|---|---|---|---|
| Quadrant | DetID | PixID | Counts | Sigma | Mean | Median | Sigma |
| A | 10 | 83 | 484728 | 3878.09 | 603 | 592 | 124.8 |
| A | 14 | 250 | 9618 | 72.3 | 603 | 592 | 124.8 |
| A | 11 | 84 | 7495 | 55.3 | 603 | 592 | 124.8 |
| B | 4 | 170 | 1085613 | 9554.98 | 587 | 570 | 113.6 |
| B | 5 | 255 | 201958 | 1773.44 | 587 | 570 | 113.6 |
| B | 0 | 230 | 47852 | 416.37 | 587 | 570 | 113.6 |
| C | 9 | 54 | 4911115 | 39890.81 | 523 | 526 | 123.1 |
| C | 15 | 214 | 203119 | 1645.75 | 523 | 526 | 123.1 |
| C | 0 | 10 | 15297 | 119.99 | 523 | 526 | 123.1 |
| D | 12 | 227 | 1327449 | 9620.1 | 555 | 539 | 137.9 |
| D | 12 | 233 | 373900 | 2706.87 | 555 | 539 | 137.9 |
| D | 2 | 250 | 361750 | 2618.78 | 555 | 539 | 137.9 |
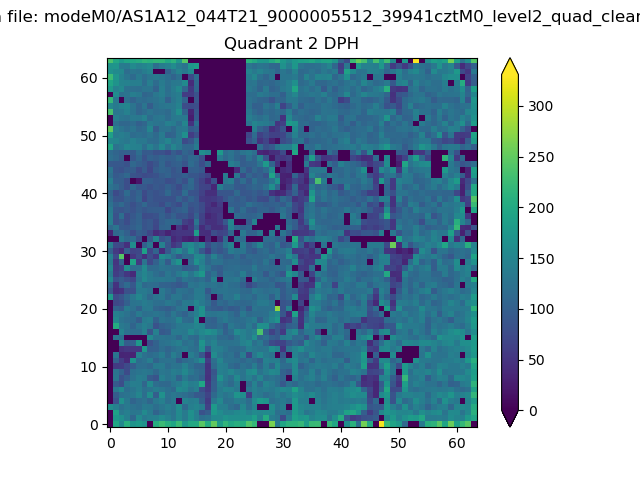
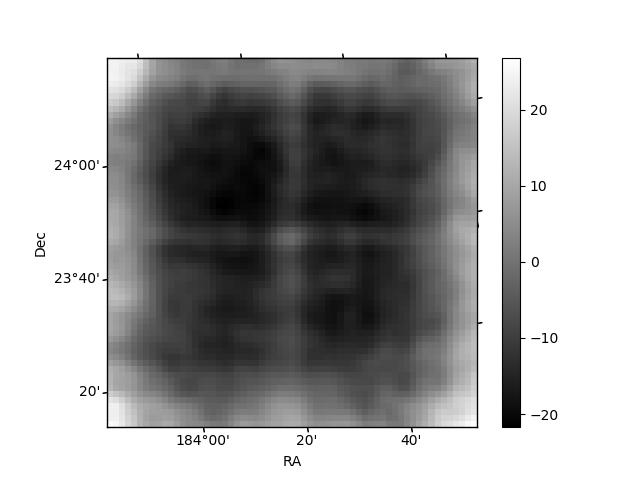
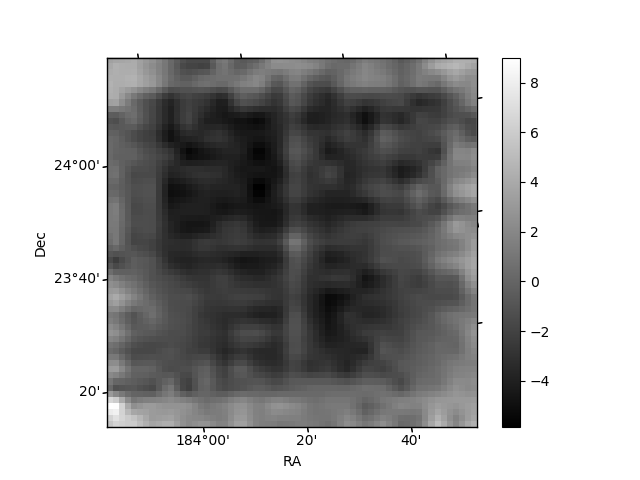
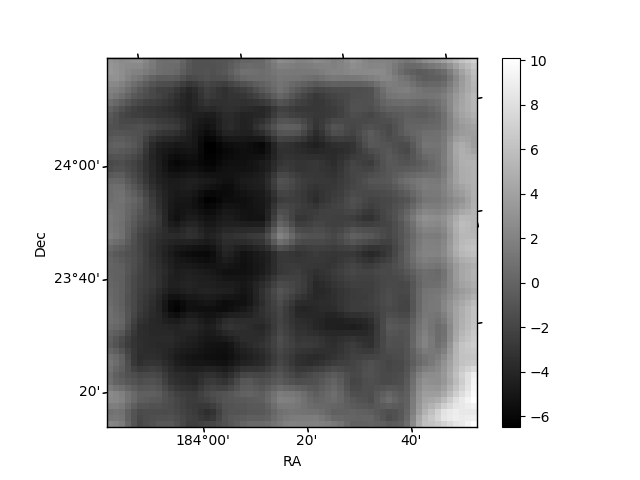
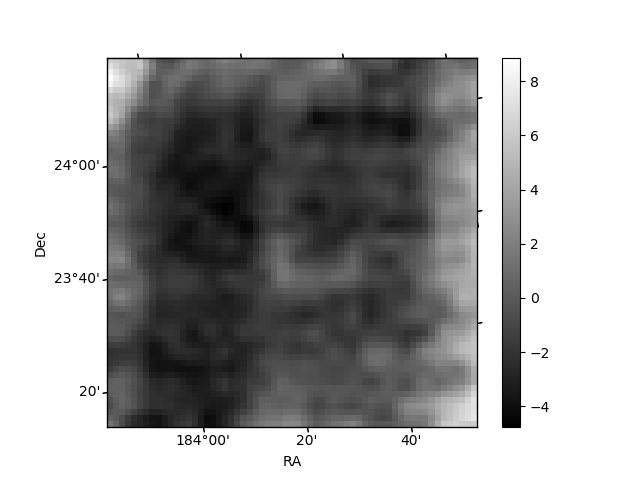
Histogram calculated using DETX and DETY for each event in the final _common_clean file
| Quadrant A | 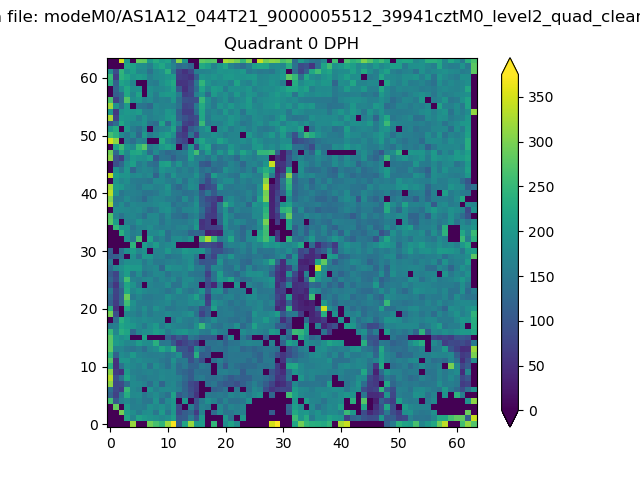 |
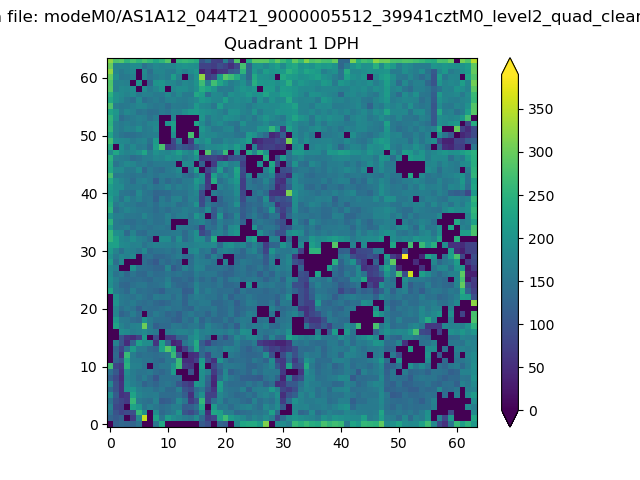 |
Quadrant B |
|---|---|---|---|
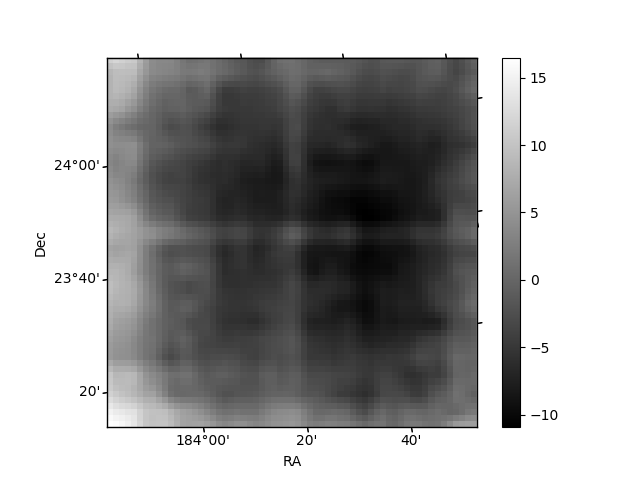
| Quadrant D | 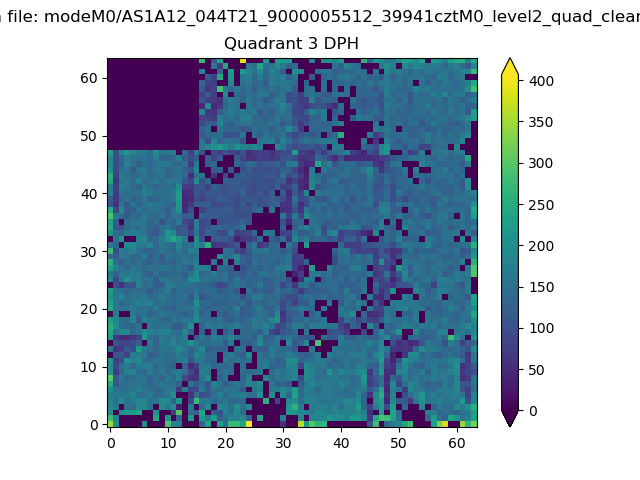 |
 |
Quadrant C |
| Plot type | Count rate plots | Images |
|---|---|---|
| Comparison with Poisson distribution Blue bars denote a histogram of data divided into 1 sec bins. Red curve is a Poisson curve with rate = median count rate of data. |
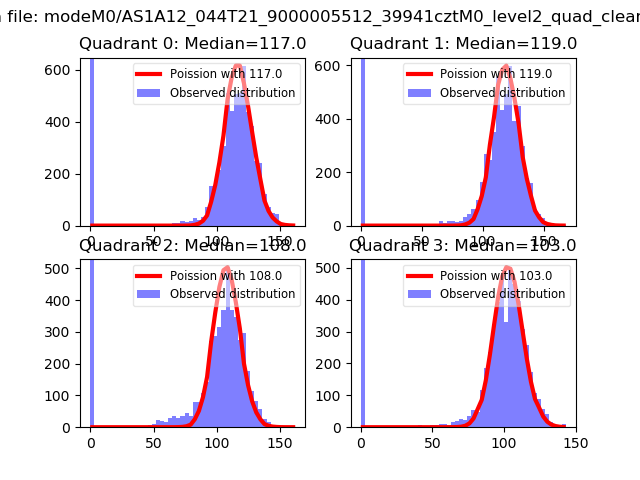 |
 |
| Quadrant-wise count rates Data is divided into 100 sec bins |
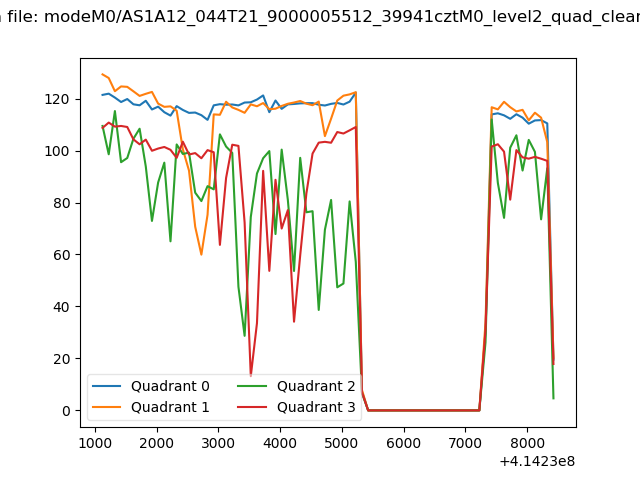 |
|
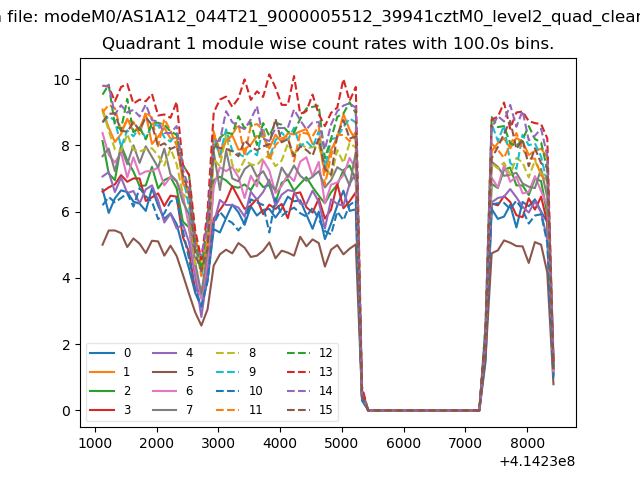
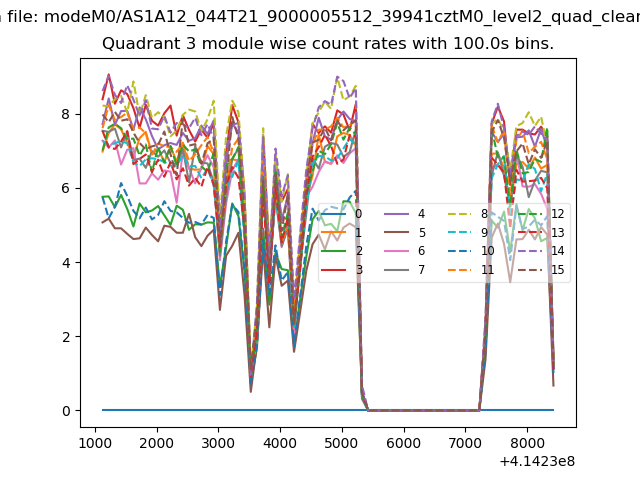
| Module-wise count rates for Quadrant A Data is divided into 100 sec bins |
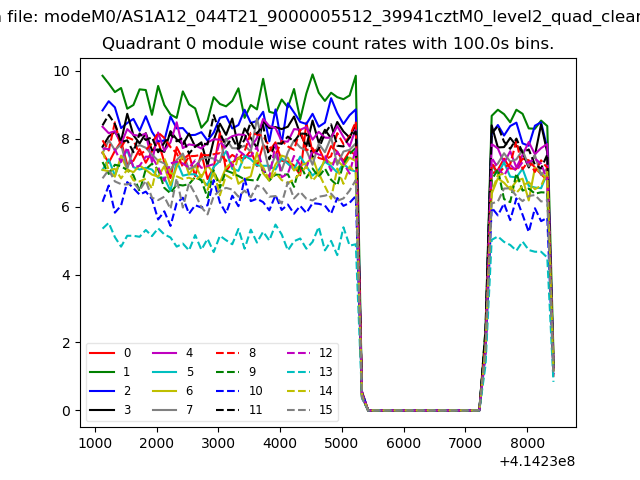 |
 |
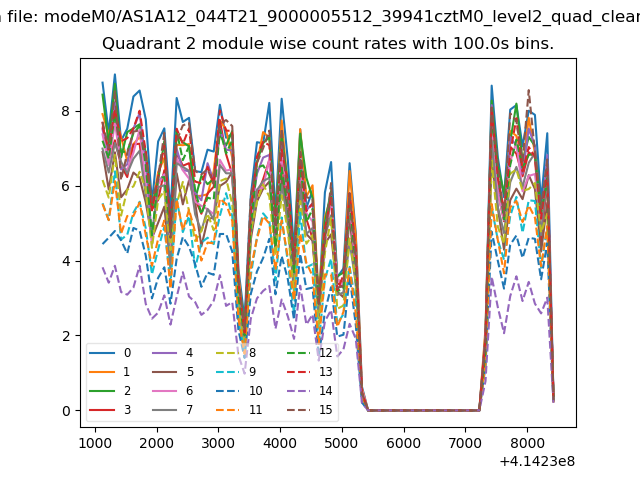
| Module-wise count rates for Quadrant B Data is divided into 100 sec bins |
 |
 |
| Module-wise count rates for Quadrant C Data is divided into 100 sec bins |
 |
 |
| Module-wise count rates for Quadrant D Data is divided into 100 sec bins |
 |
 |
| Parameter | Plot |
|---|---|
| CZT HV Monitor | 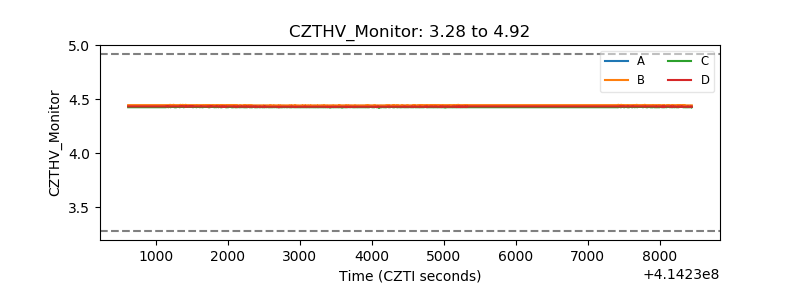 |
| D_VDD | 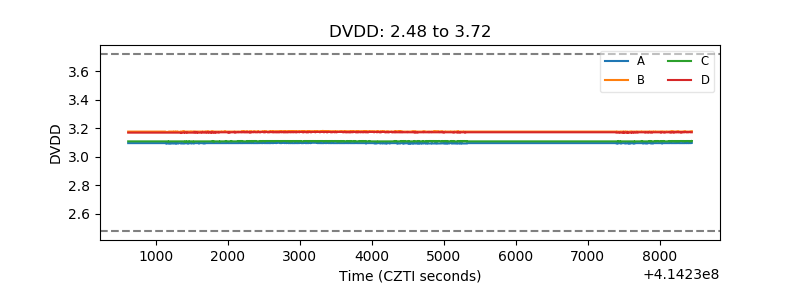 |
| Temperature 1 | 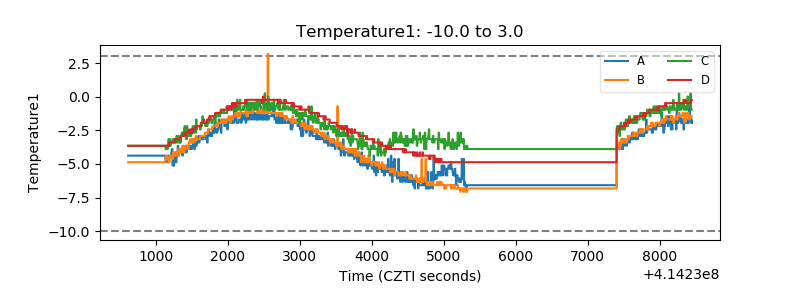 |
| Veto HV Monitor | 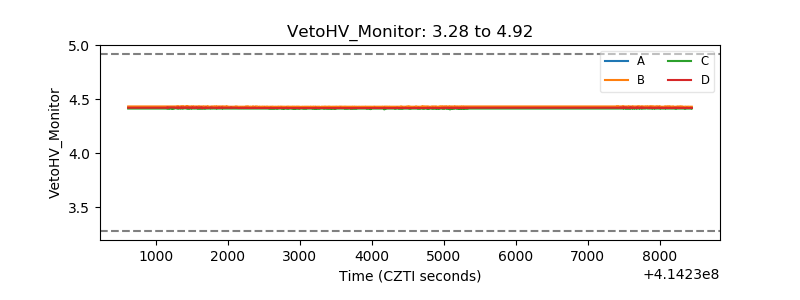 |
| Veto LLD | 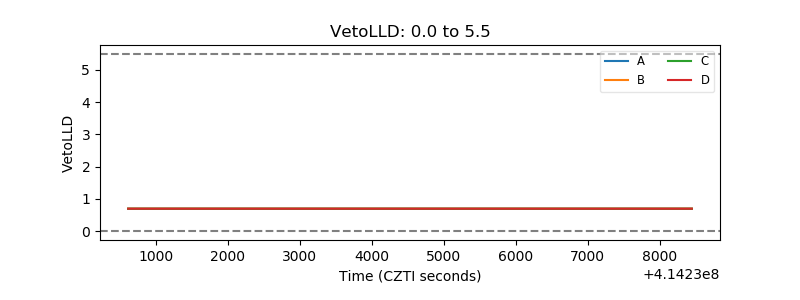 |
| Alpha Counter | 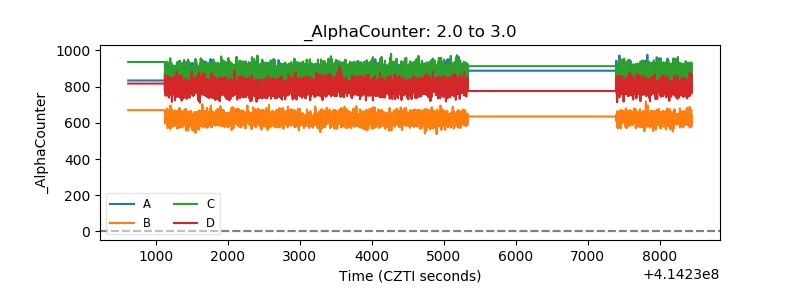 |
| _CPM_Rate | 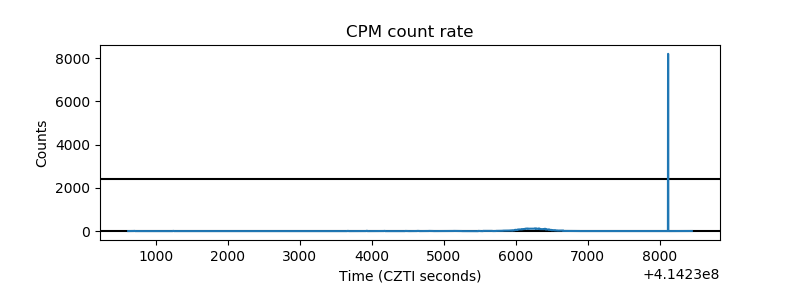 |
| CZT Counter | 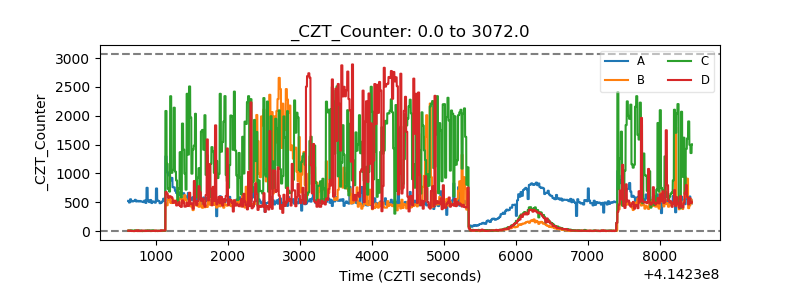 |
| +2.5 Volts monitor | 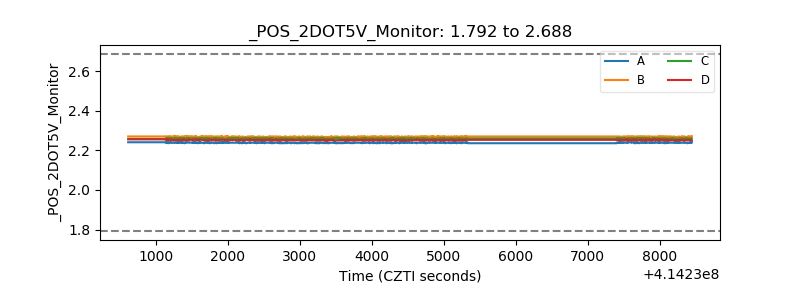 |
| +5 Volts monitor | 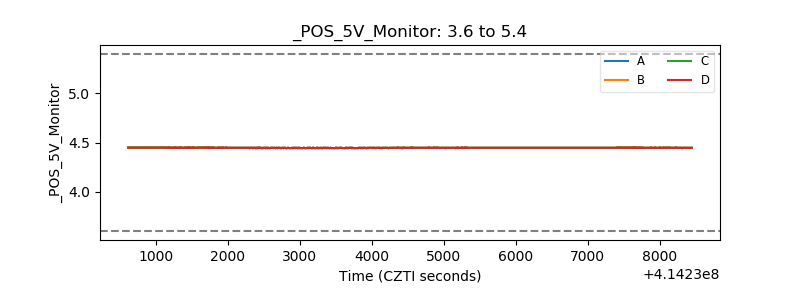 |
| _ROLL_ROT | 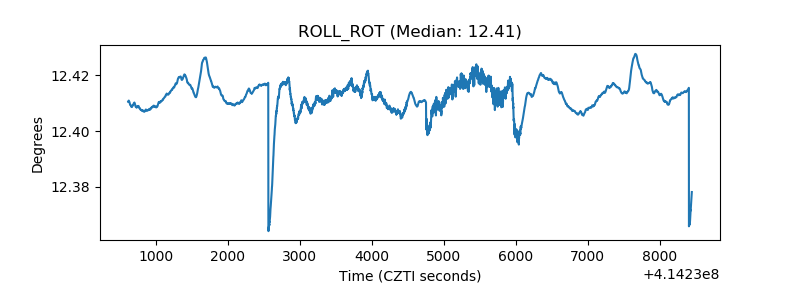 |
| _Roll_DEC | 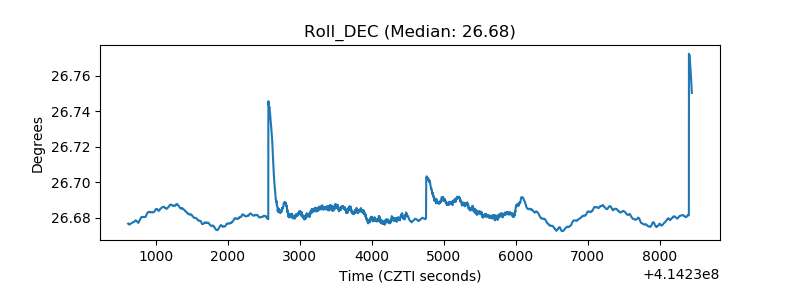 |
| _Roll_RA | 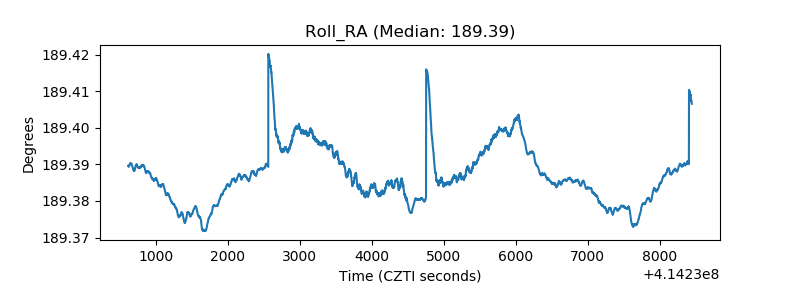 |
| Veto Counter | 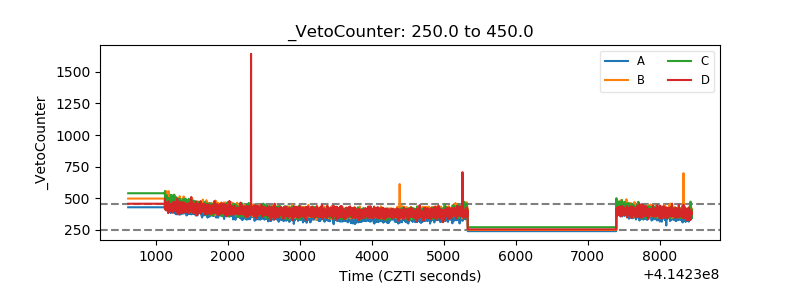 |