| Param | Original file | Final file |
|---|---|---|
| Filename | modeM0/AS1A12_044T21_9000005512_39942cztM0_level2.fits | modeM0/AS1A12_044T21_9000005512_39942cztM0_level2_quad_clean.evt |
| Size (bytes) | 436,262,400 | 87,278,400 |
| Size | 416.1 MB | 83.2 MB |
| Events in quadrant A | 3,001,812 | 610,004 |
| Events in quadrant B | 3,160,309 | 605,171 |
| Events in quadrant C | 6,131,697 | 527,023 |
| Events in quadrant D | 3,431,510 | 519,016 |
| Mode M9 | |||
|---|---|---|---|
| Quadrant | BADHDUFLAG | Total packets | Discarded packets |
| A | 0 | 26 | 0 |
| B | 0 | 26 | 0 |
| C | 0 | 26 | 0 |
| D | 0 | 27 | 0 |
| Mode SS | |||
|---|---|---|---|
| Quadrant | BADHDUFLAG | Total packets | Discarded packets |
| A | 0 | 110 | 0 |
| B | 0 | 110 | 0 |
| C | 0 | 110 | 0 |
| D | 0 | 110 | 0 |
| Mode M0 | |||
|---|---|---|---|
| Quadrant | BADHDUFLAG | Total packets | Discarded packets |
| A | 0 | 12219 | 3 |
| B | 0 | 13009 | 2 |
| C | 0 | 22005 | 2 |
| D | 0 | 13982 | 2 |
| Quadrant | Total seconds | Saturated seconds | Saturation percentage |
|---|---|---|---|
| A | 5453 | 20 | 0.366771% |
| B | 5453 | 187 | 3.429305% |
| C | 5453 | 783 | 14.359068% |
| D | 5453 | 273 | 5.006418% |
Noise dominated data is calculated using 1-second bins in cleaned event files. If a bin has >2000 counts, and if more than 50% of those come from <1% of pixels, then it is considered to be noise-dominated and hence unusable.
| Quadrant | # 1 sec bins | Bins with >0 counts | Bins with >2000 counts | High rate bins dominated by noise | Noise dominated (total time) | Noise dominated (detector-on time) | Marked lightcurve |
|---|---|---|---|---|---|---|---|
| A | 7306 | 5454 | 19 | 19 | 0.26% | 0.35% | 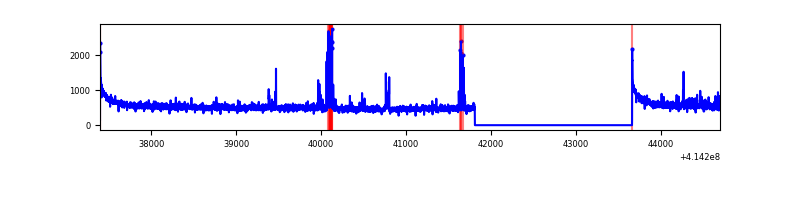 |
| B | 7306 | 5454 | 153 | 153 | 2.09% | 2.81% | 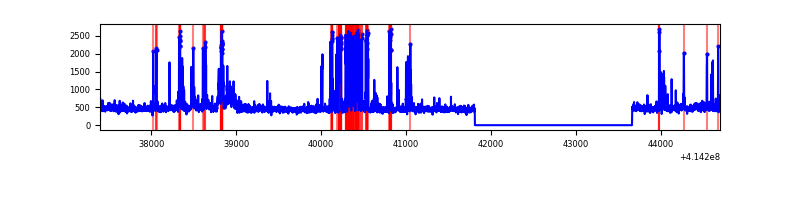 |
| C | 7306 | 5454 | 566 | 566 | 7.75% | 10.38% | 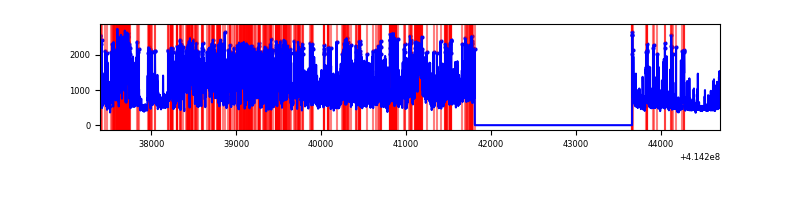 |
| D | 7306 | 5453 | 264 | 264 | 3.61% | 4.84% | 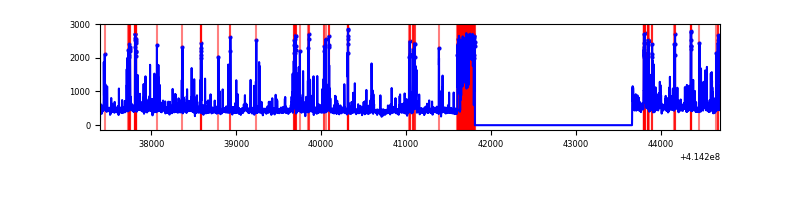 |
Top three noisy pixels from each quadrant. If the there are fewer than three noisy pixels in the level2.evt file, extra rows are filled as -1
| Pixel properties | Quadrant properties | ||||||
|---|---|---|---|---|---|---|---|
| Quadrant | DetID | PixID | Counts | Sigma | Mean | Median | Sigma |
| A | 10 | 83 | 486778 | 3921.64 | 607 | 596 | 124.0 |
| A | 13 | 248 | 70737 | 565.77 | 607 | 596 | 124.0 |
| A | 2 | 79 | 52800 | 421.09 | 607 | 596 | 124.0 |
| B | 5 | 255 | 491579 | 4244.1 | 596 | 579 | 115.7 |
| B | 0 | 183 | 91049 | 782.0 | 596 | 579 | 115.7 |
| B | 4 | 170 | 86348 | 741.37 | 596 | 579 | 115.7 |
| C | 9 | 54 | 3645033 | 27788.25 | 564 | 569 | 131.2 |
| C | 15 | 214 | 221336 | 1683.3 | 564 | 569 | 131.2 |
| C | 0 | 10 | 22569 | 167.75 | 564 | 569 | 131.2 |
| D | 2 | 249 | 512743 | 3516.48 | 581 | 563 | 145.7 |
| D | 2 | 250 | 283824 | 1944.79 | 581 | 563 | 145.7 |
| D | 12 | 227 | 106942 | 730.37 | 581 | 563 | 145.7 |
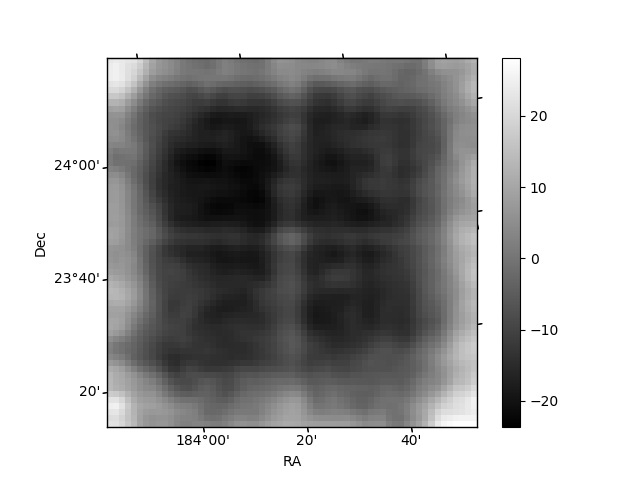
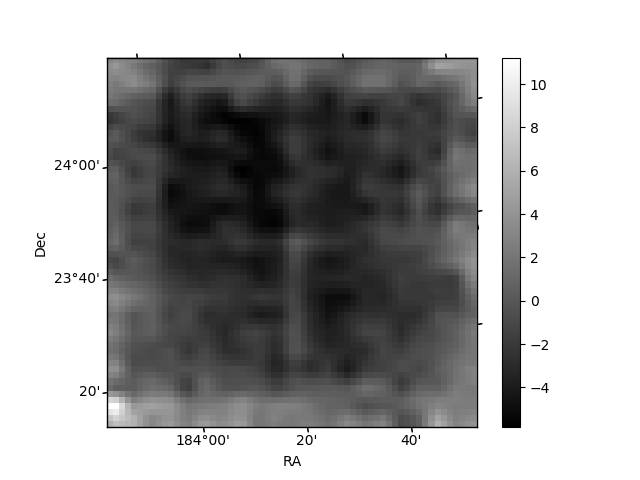
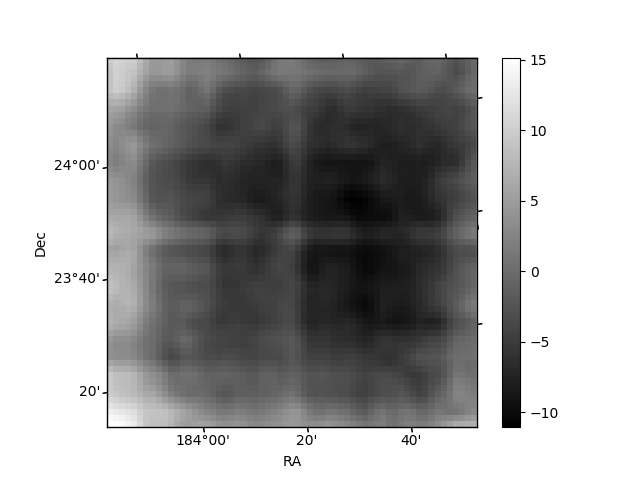
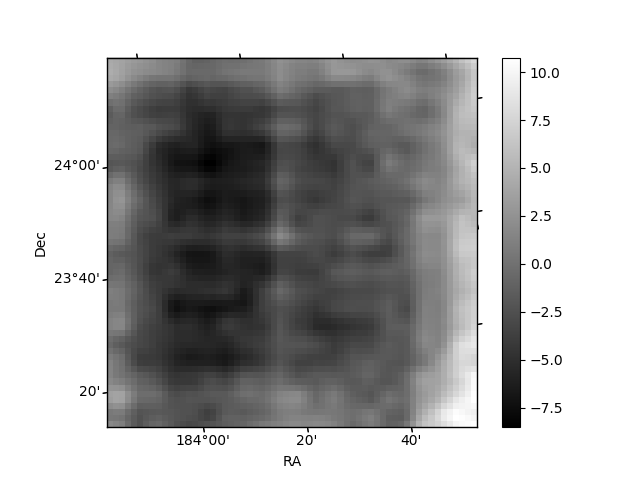
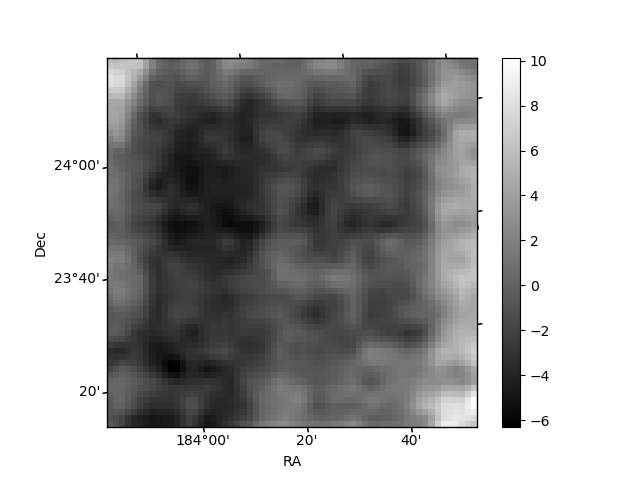
Histogram calculated using DETX and DETY for each event in the final _common_clean file
| Quadrant A | 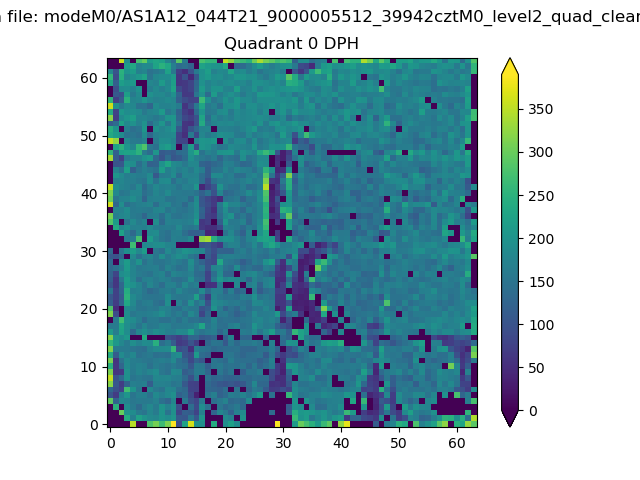 |
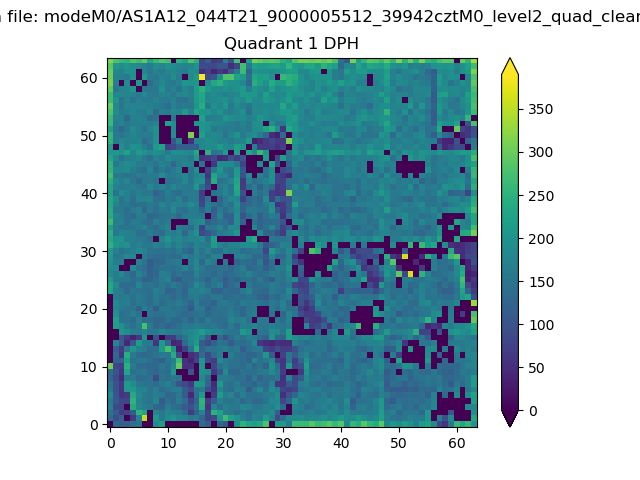 |
Quadrant B |
|---|---|---|---|
| Quadrant D | 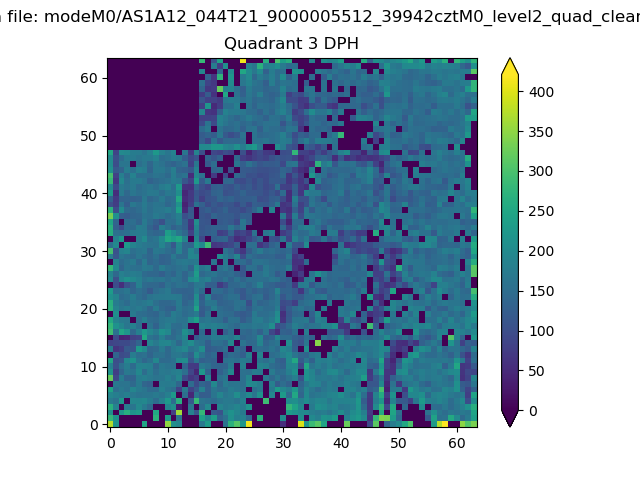 |
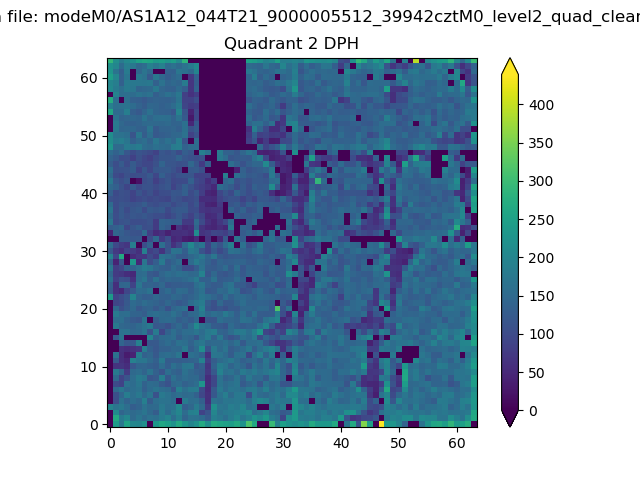 |
Quadrant C |
| Plot type | Count rate plots | Images |
|---|---|---|
| Comparison with Poisson distribution Blue bars denote a histogram of data divided into 1 sec bins. Red curve is a Poisson curve with rate = median count rate of data. |
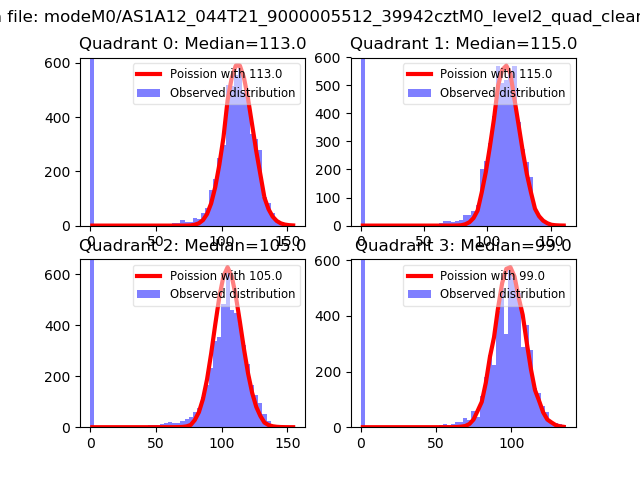 |
 |
| Quadrant-wise count rates Data is divided into 100 sec bins |
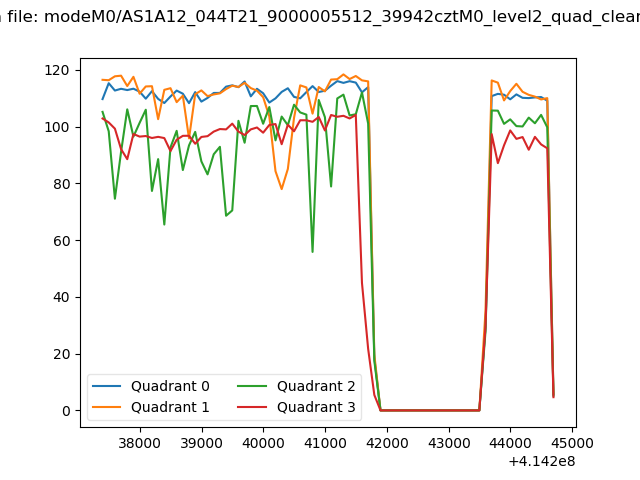 |
|
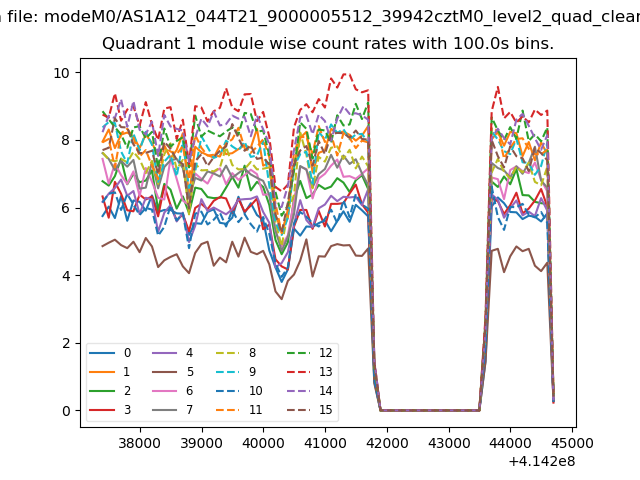
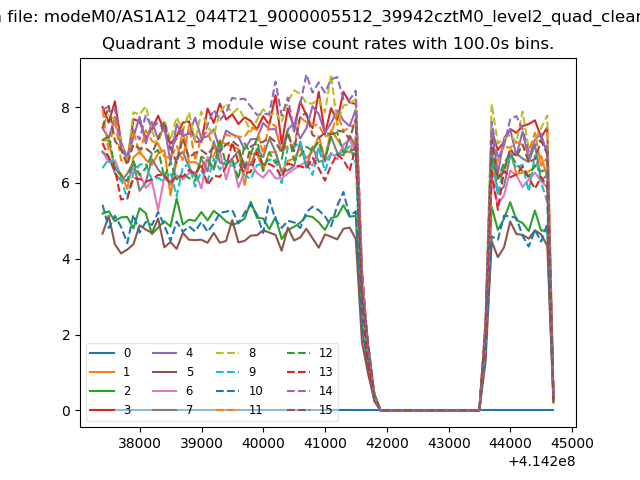
| Module-wise count rates for Quadrant A Data is divided into 100 sec bins |
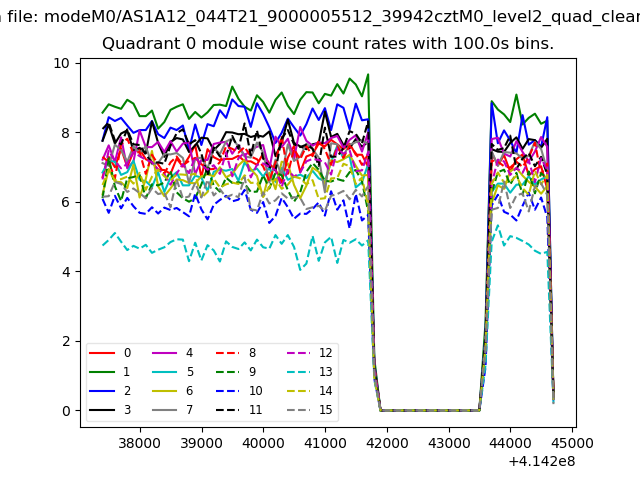 |
 |
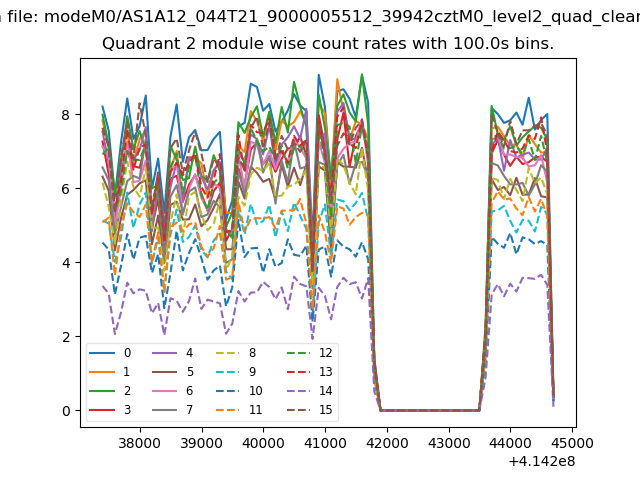
| Module-wise count rates for Quadrant B Data is divided into 100 sec bins |
 |
 |
| Module-wise count rates for Quadrant C Data is divided into 100 sec bins |
 |
 |
| Module-wise count rates for Quadrant D Data is divided into 100 sec bins |
 |
 |
| Parameter | Plot |
|---|---|
| CZT HV Monitor | 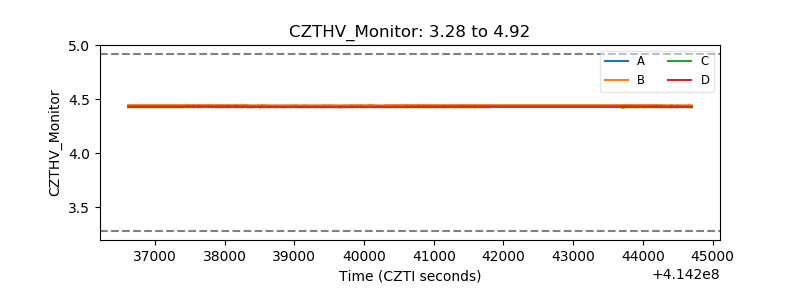 |
| D_VDD | 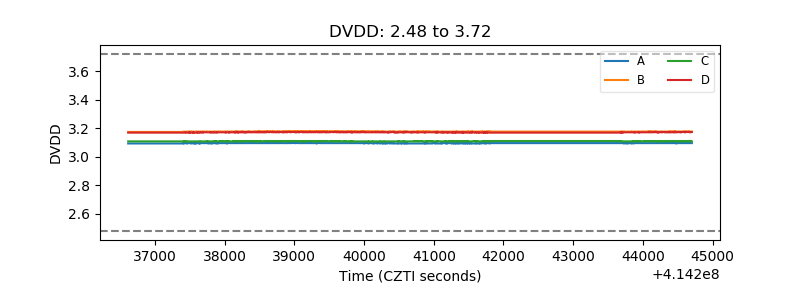 |
| Temperature 1 | 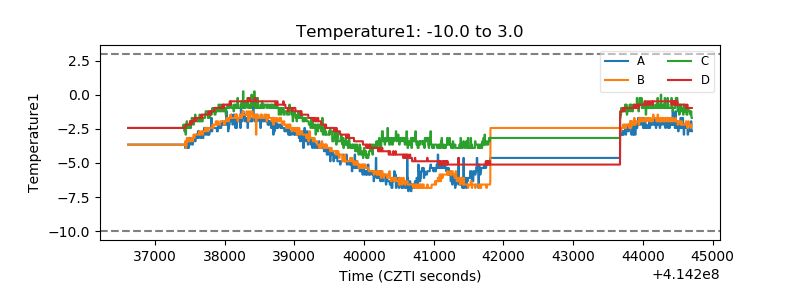 |
| Veto HV Monitor | 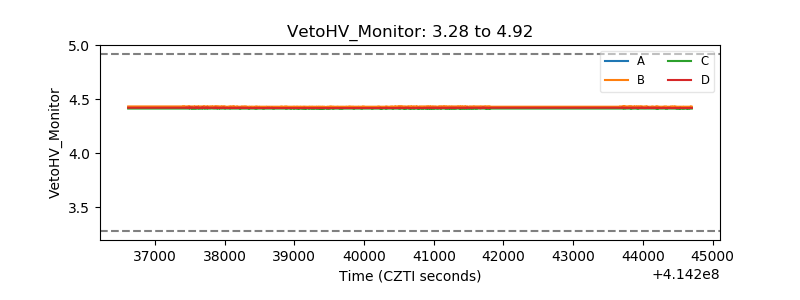 |
| Veto LLD | 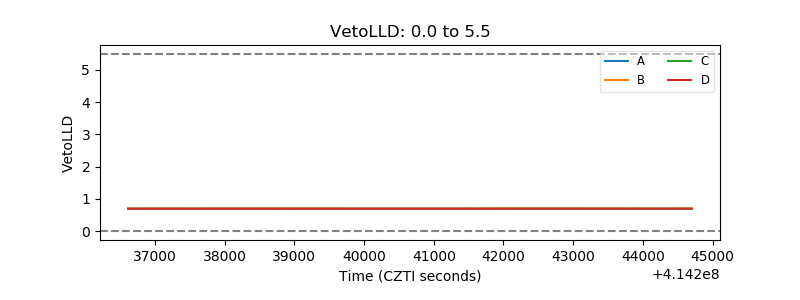 |
| Alpha Counter | 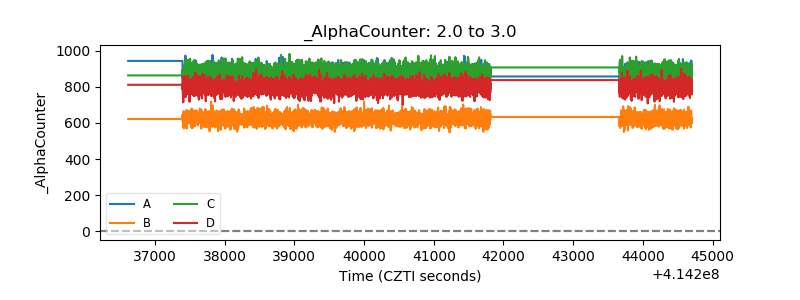 |
| _CPM_Rate | 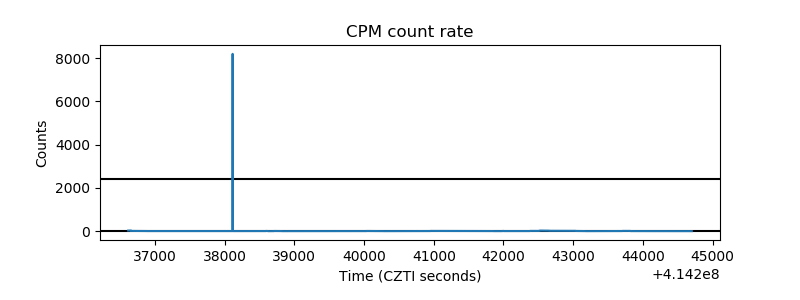 |
| CZT Counter | 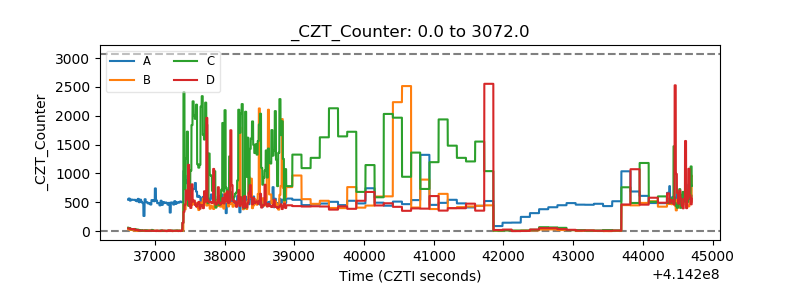 |
| +2.5 Volts monitor | 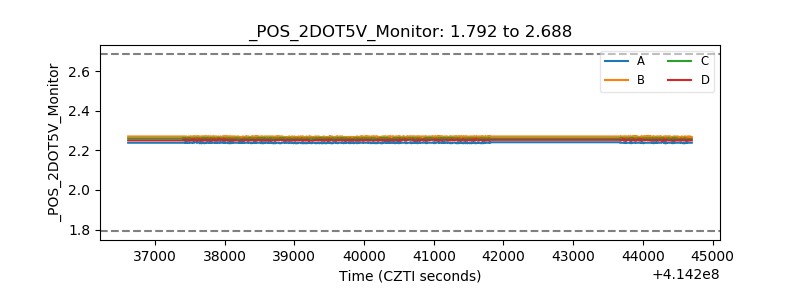 |
| +5 Volts monitor | 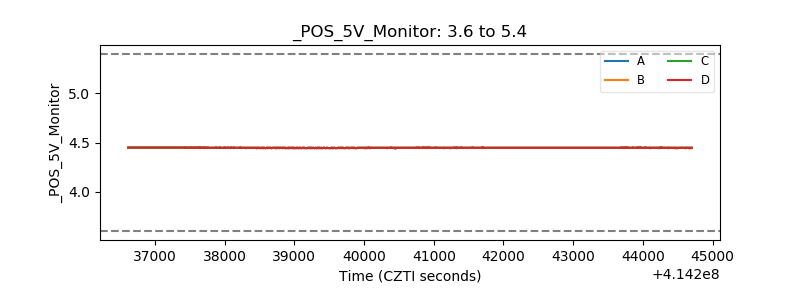 |
| _ROLL_ROT | 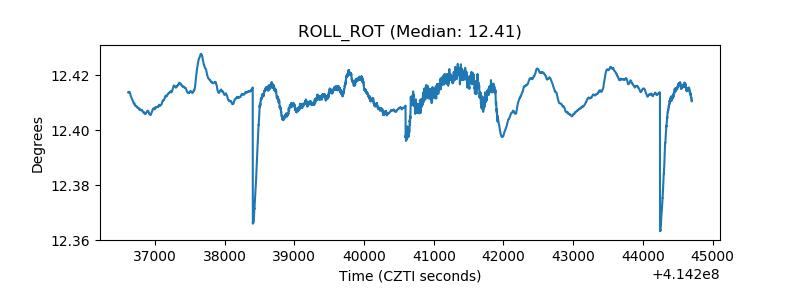 |
| _Roll_DEC | 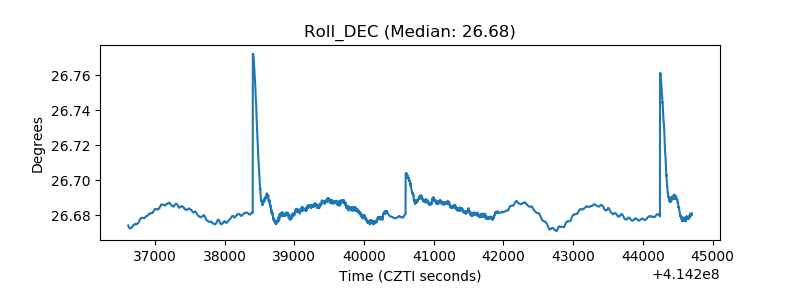 |
| _Roll_RA | 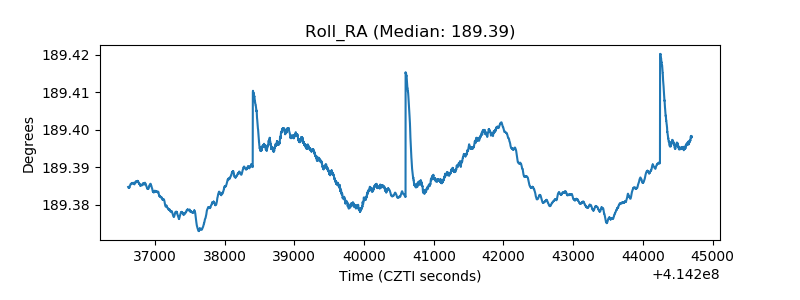 |
| Veto Counter | 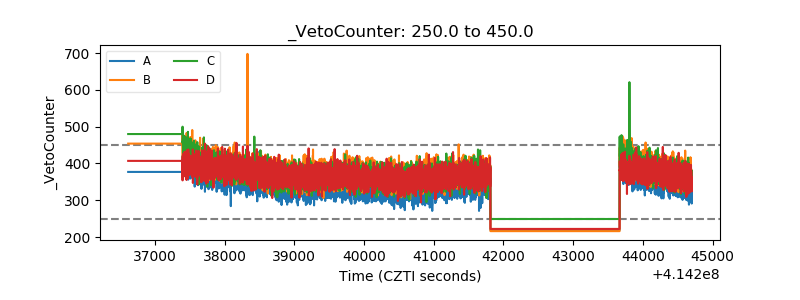 |